. 2014 Apr 15;9(4):e95197.
doi: 10.1371/journal.pone.0095197. eCollection 2014.

Rotavirus increases levels of lipidated LC3 supporting accumulation of infectious progeny virus without inducing autophagosome formation

Affiliations

Rotavirus increases levels of lipidated LC3 supporting accumulation of infectious progeny virus without inducing autophagosome formation

Francesca Arnoldi et al. PLoS One. .

Abstract

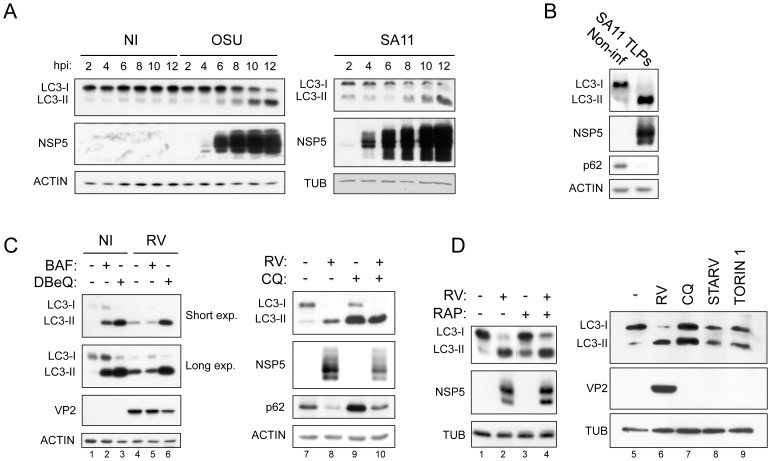
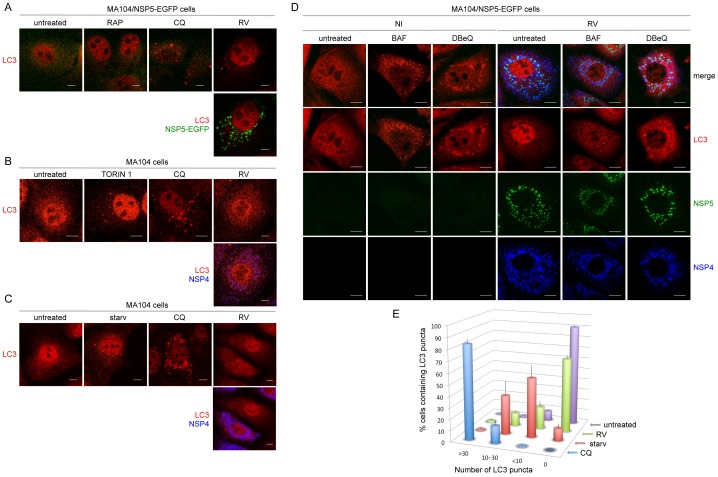
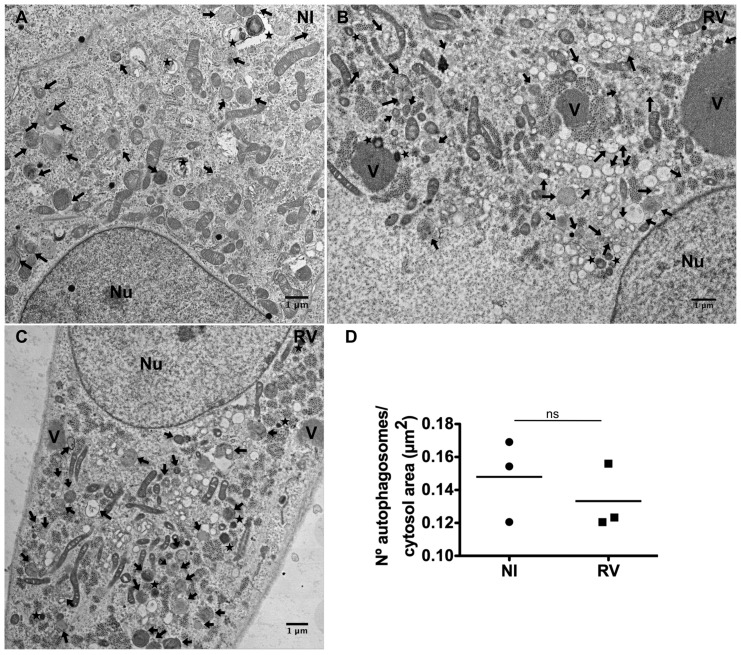
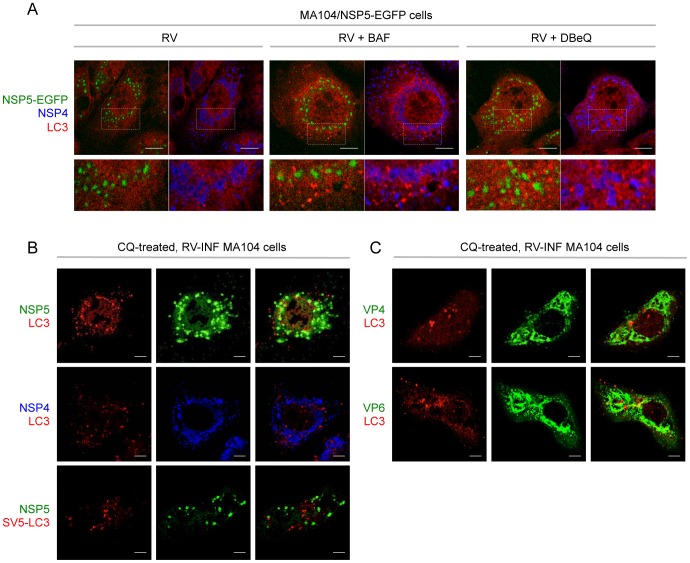
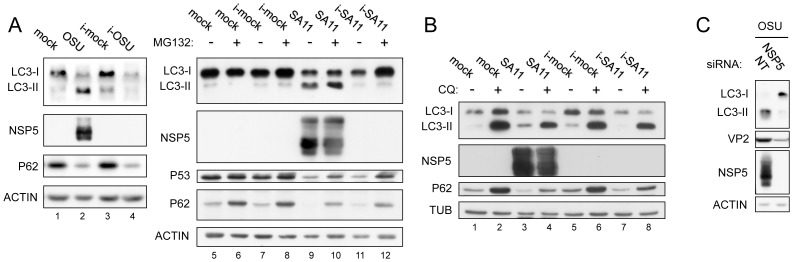
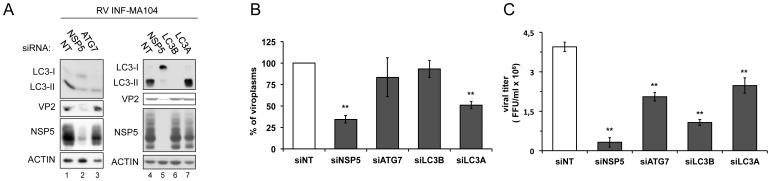
Replication of many RNA viruses benefits from subversion of the autophagic pathway through many different mechanisms. Rotavirus, the main etiologic agent of pediatric gastroenteritis worldwide, has been recently described to induce accumulation of autophagosomes as a mean for targeting viral proteins to the sites of viral replication. Here we show that the viral-induced increase of the lipidated form of LC3 does not correlate with an augmented formation of autophagosomes, as detected by immunofluorescence and electron microscopy. The LC3-II accumulation was found to be dependent on active rotavirus replication through the use of antigenically intact inactivated viral particles and of siRNAs targeting viral genes that are essential for viral replication. Silencing expression of LC3 or of Atg7, a protein involved in LC3 lipidation, resulted in a significant impairment of viral titers, indicating that these elements of the autophagic pathway are required at late stages of the viral cycle.


Conflict of interest statement

Competing Interests: The authors have declared that no competing interests exist.

Figures

Figure 1
Figure 1. LC3 lipidation induced by RV infection.
A) Western blot of extracts from non-infected (NI) and OSU- or SA11-infected MA104 cells at different times post-infection. Crude viral preparations were used for infection. B) As in A, using SA11 purified triple-layered particles (TLPs) (13 hpi). C–D) Western blots of extracts from NI and OSU-infected cells at 13 hpi, treated or not with BAF (0.1 µM), DBeQ (15 µM), CQ (50 µM), RAP (0.1 µM) or torin 1 (0.25 µM), or maintained under starvation conditions, as indicated.
Figure 2
Figure 2. Autophagosomes in RV-infected cells.
A–D) Confocal immunofluorescence of non-infected (NI) and RV-infected (OSU strain, 13 hpi; MOI: 0,5 in A–C; 5 in D) MA104/NSP5-EGFP cells (A, D) and MA104 cells (B, C). Cells were treated or not with BAF (0.1 µM), DBeQ (15 µM), CQ (50 µM), RAP (0.1 µM), or torin 1 (0.25 µM), or maintained under starvation conditions (starv), as indicated. Autophagosomes were visualized with an anti-LC3 antibody (red). In A and D viroplasms were visualized using NSP5-EGFP (green). In B and C NSP4 was visualized using an anti-NSP4 antibody (blue). Single optical sections are shown. Scale bar is 5 µm. Images are representative of three independent experiments in which at least 150 cells per each experimental condition were analyzed. E) Quantification of LC3 puncta: the results are expressed as mean ±SEM from at least three independent samples for each experimental condition.
Figure 3
Figure 3. GFP-LC3 and SV5-LC3 fusion constructs in RV-infected cells.
Confocal immunofluorescence of MA104 cells transiently over-expressing the fusion construct GFP-LC3 (A) or SV5-LC3 (B). Cells were untreated, RV-infected (OSU strain; MOI, 5; 13 hpi) or treated from 1 hpi to 13 hpi with RAP (0.1 µM), CQ (50 µM), or torin 1 (0.25 µM), as indicated. Viroplasms were visualized with an anti-NSP5 antibody (red) and the fusion constructs with the GFP fluorescence in A and with an anti-SV5 antibody in B (green). Single optical sections are shown. Scale bar, 10 µm. Images are representative of three independent experiments in which at least 150 cells per each experimental condition were analyzed.
Figure 4
Figure 4. Electron microscopy of autophagosomes in RV-infected cells.
High-definition electron microscopy of non-infected (A) and RV-infected (SA11 strain; MOI, 250 VFU/ml) (B and C) MA104 cells at 14 hpi. V, viroplasms; Nu, nucleus; black arrows, AVi (early/initial autophagic vacuoles corresponding to autophagosomes); stars, AVd (late/degradative autophagic vacuoles including amphisomes and autolysosomes). Scale bars are 1 µm. D) Quantification of autophagosomes in non-infected (NI) and RV-infected MA104 cells (14 hpi). The data correspond to the mean of three-independent experiments with 25 cells per experimental point. Student's t-test, ns, p>0.05.
Figure 5
Figure 5. Cellular localization of LC3 in RV-infected cells.
Confocal immunofluorescence of RV-infected (OSU strain, 13 hpi; MOI, 5) MA104/NSP5-EGFP cells (A) and MA104 cells (B–C). In B, bottom row, cells were transiently transfected with the pSV5-LC3 construct. Where indicated, autophagy inhibitors (BAF, DBeQ, CQ) were used. Autophagosomes were visualized with an anti-LC3 antibody (red) in A, in the upper and middle rows of B and in C, and with an anti-SV5 antibody (red) in the bottom row of B. Viroplasms were visualized using the fluorescence of NSP5-EGFP in A and with an anti-NSP5 antibody (green) in B. NSP4, VP4 and VP6 were visualized using anti-NSP4 (blue), anti-VP6 (green) and anti-VP4 (green) antibodies, respectively. In A, bottom row shows magnification of insets indicated by dotted squares. Single optical sections are shown. Scale bar, 5 µm. Images are representative of three independent experiments in which at least 150 cells per each experimental condition were analyzed.
Figure 6
Figure 6. Requirement of virus replication for accumulation of lipidated LC3.
A–B) Western blots of extracts from MA104 cells infected or not with antigenically intact inactivated RV particles (i-OSU or i-SA11, 13 hpi) and untreated or treated with MG132 (5 µM, added at 1 h before infection) in A and with CQ (50 µM, added at 1 h after infection) in B. Since virus inactivation was performed on crude preparations, equal amounts of lysates derived from non-infected cells were psoralen-treated and UV-exposed and used as mock-infection controls (i-mock). C) Western blot of extracts from MA104 cells transfected with the indicated siRNAs and infected with RV (OSU strain; MOI, 5; 13 hpi) at 48 h after transfection.
Figure 7
Figure 7. Proviral effect of LC3 lipidation.
MA104 cells were transfected with the indicated siRNAs and at 48(OSU strain; MOI, 5) for 13 h (A, B) or 24 h (C). A) Western blot of cellular extracts. B) Quantification of the accumulation of viroplasms per cell. C) Viral titers obtained from each condition. The results are expressed as mean ±SEM from at least three independent samples for each experimental condition, and in B data were normalized as percentage from the control. In all figures: siNT, control non-targeting siRNA. t-test, **, p<0.01.

References

    1. Rabinowitz JD, White E (2010) Autophagy and metabolism. Science 330: 1344–1348. - PMC - PubMed
    1. Maiuri MC, Zalckvar E, Kimchi A, Kroemer G (2007) Self-eating and self-killing: crosstalk between autophagy and apoptosis. Nature reviews Molecular cell biology 8: 741–752. - PubMed
    1. Weidberg H, Shvets E, Elazar Z (2011) Biogenesis and cargo selectivity of autophagosomes. Annual review of biochemistry 80: 125–156. - PubMed
    1. Jung CH, Ro SH, Cao J, Otto NM, Kim DH (2010) mTOR regulation of autophagy. FEBS letters 584: 1287–1295. - PMC - PubMed
    1. Matsunaga K, Saitoh T, Tabata K, Omori H, Satoh T, et al. (2009) Two Beclin 1-binding proteins, Atg14L and Rubicon, reciprocally regulate autophagy at different stages. Nature cell biology 11: 385–396. - PubMed

Publication types

Substances

LinkOut - more resources