. 2014 Jun 6;289(23):16114-28.
doi: 10.1074/jbc.M114.556530. Epub 2014 Apr 15.

Endorepellin evokes autophagy in endothelial cells

Affiliations

Endorepellin evokes autophagy in endothelial cells

Chiara Poluzzi et al. J Biol Chem. .

Abstract

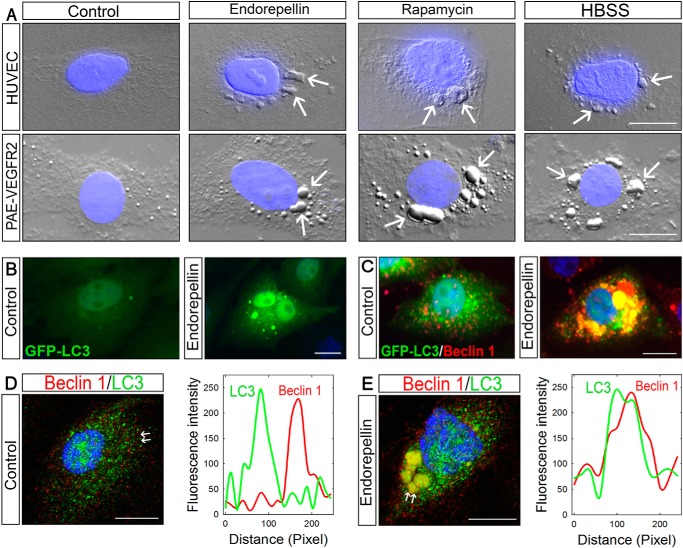
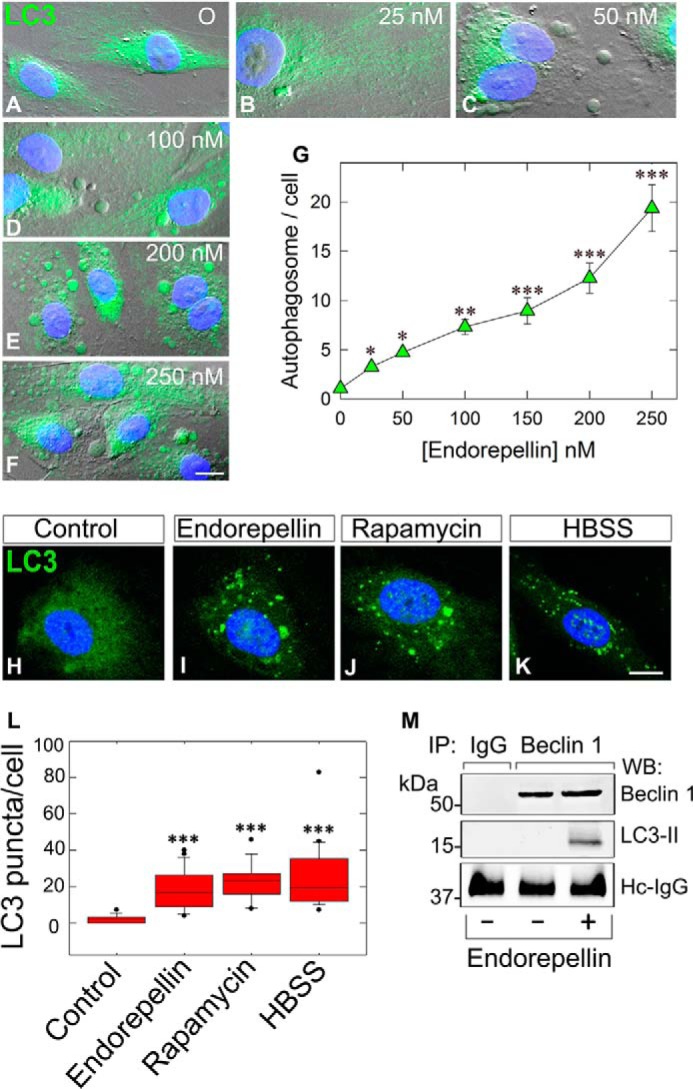
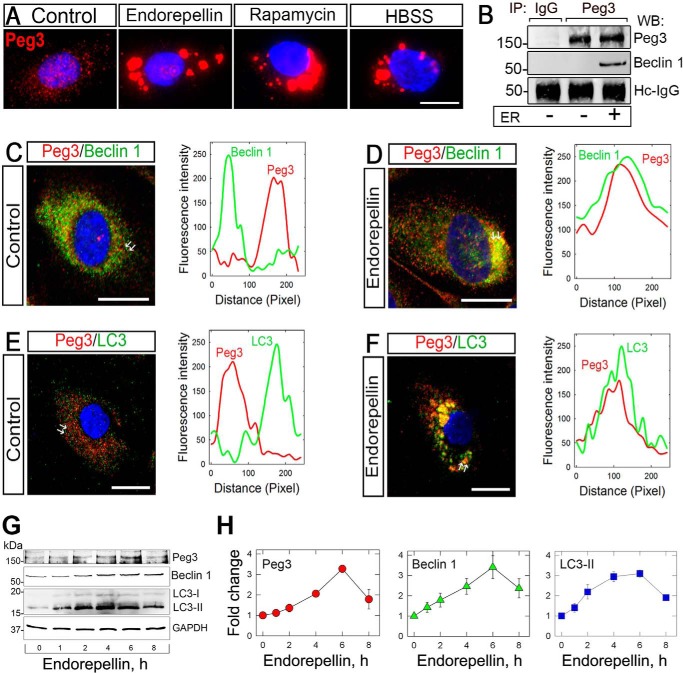
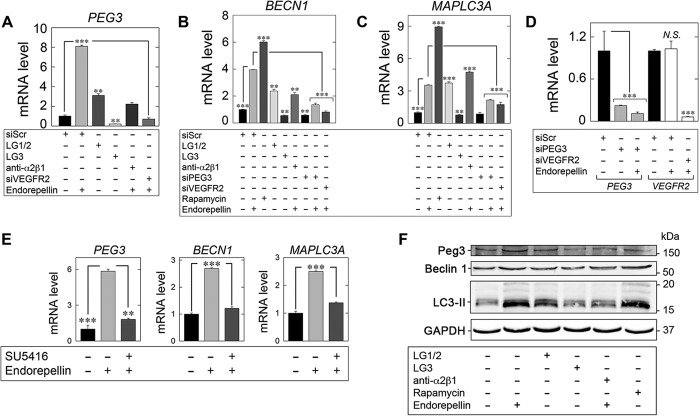
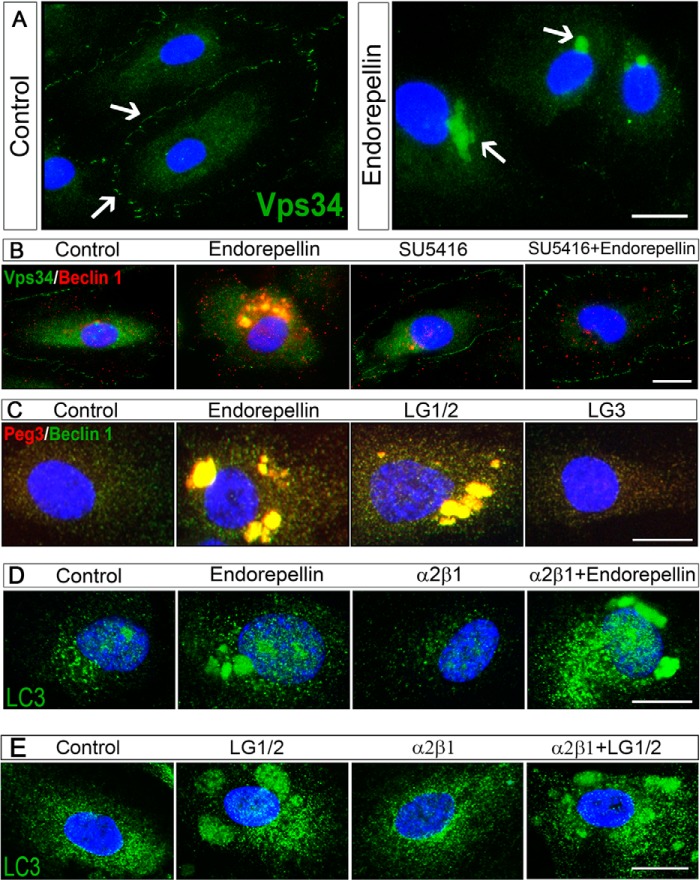
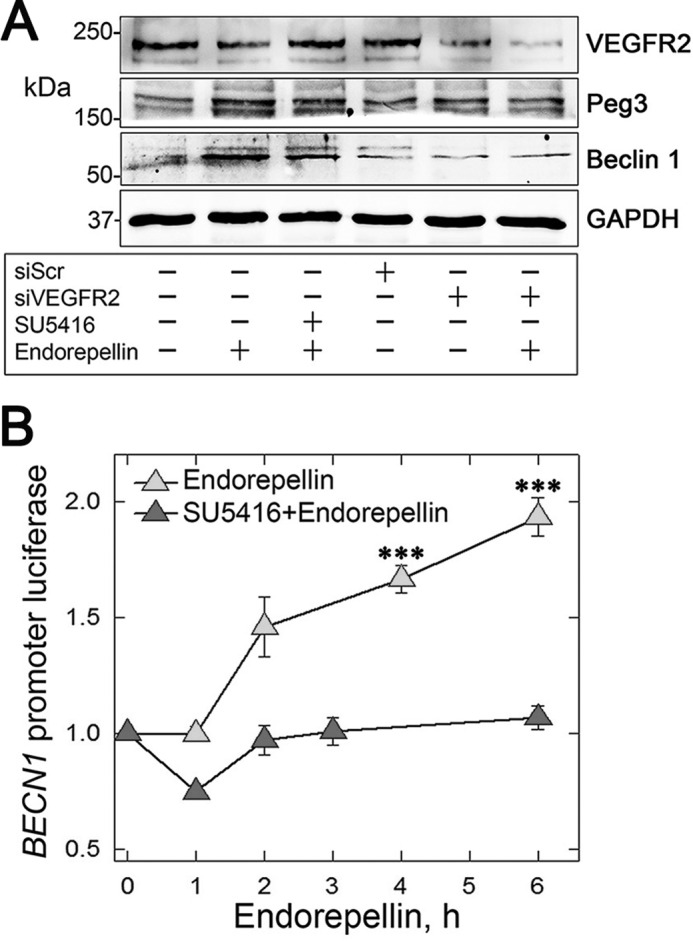
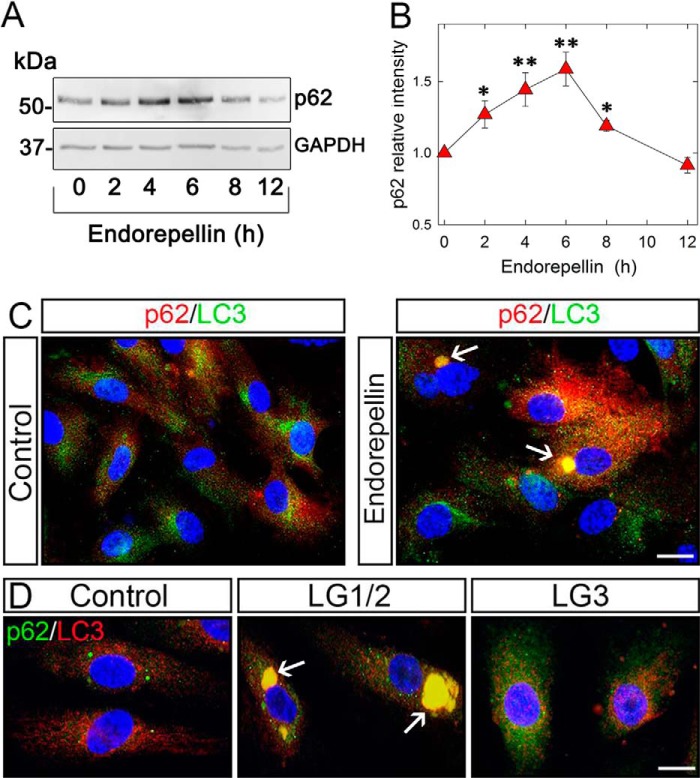
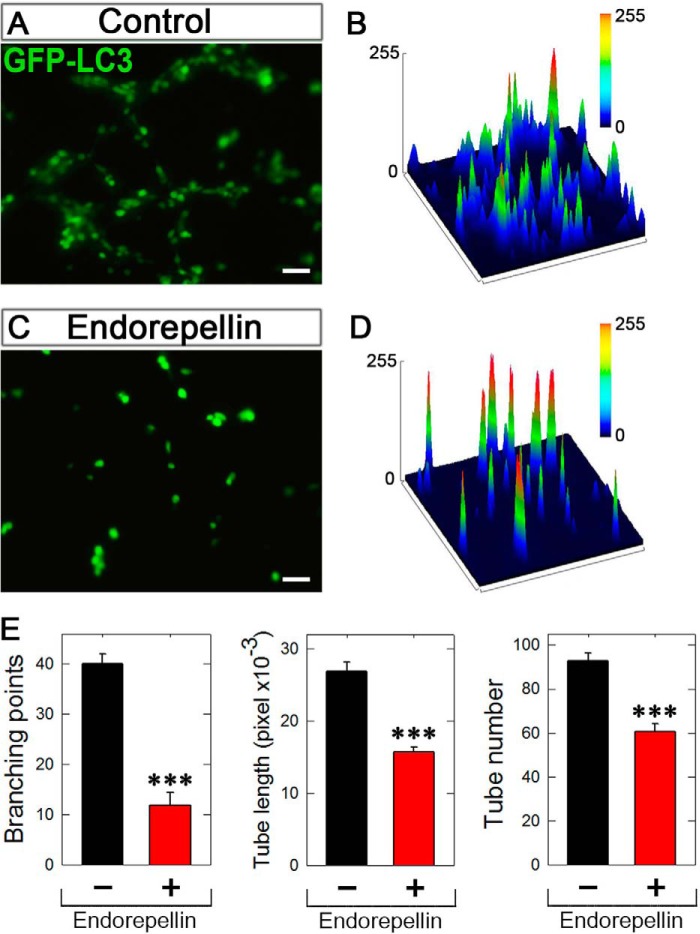
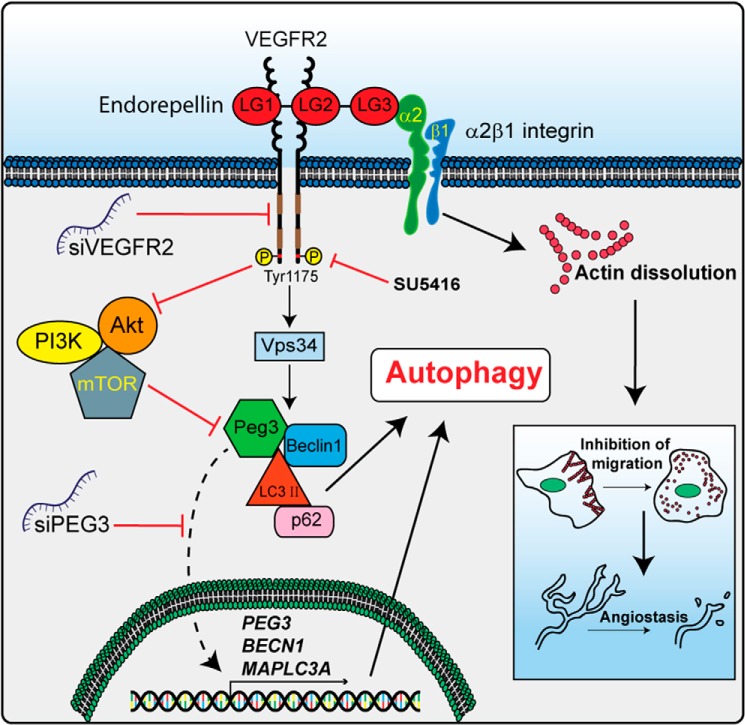
Endorepellin, the C-terminal fragment of the heparan sulfate proteoglycan perlecan, possesses angiostatic activity via dual receptor antagonism, through concurrent binding to the α2β1 integrin and vascular endothelial growth factor receptor 2 (VEGFR2). Here, we discovered that soluble endorepellin induced autophagy in endothelial cells by modulating the expression of Beclin 1, LC3, and p62, three established autophagic markers. Moreover, endorepellin evoked expression of the imprinted tumor suppressor gene Peg3 and its co-localization with Beclin 1 and LC3 in autophagosomes, suggesting a major role for this gene in endothelial cell autophagy. Mechanistically, endorepellin induced autophagy by down-regulating VEGFR2 via the two LG1/2 domains, whereas the C-terminal LG3 domain, the portion responsible for binding the α2β1 integrin, was ineffective. Endorepellin also induced transcriptional activity of the BECN1 promoter in endothelial cells, and the VEGFR2-specific tyrosine kinase inhibitor, SU5416, blocked this effect. Finally, we found a correlation between endorepellin-evoked inhibition of capillary morphogenesis and enhanced autophagy. Thus, we have identified a new role for this endogenous angiostatic fragment in inducing autophagy through a VEGFR2-dependent but α2β1 integrin-independent pathway. This novel mechanism specifically targets endothelial cells and could represent a promising new strategy to potentiate the angiostatic effect of endorepellin and perhaps other angiostatic matrix proteins.

Keywords: Angiogenesis; Autophagy; Endothelial Cell; Extracellular Matrix; Extracellular Matrix Proteins; Proteoglycan.


Figures

FIGURE 1.
FIGURE 1.
Endorepellin causes autophagy in endothelial cells inducing the expression and co-localization of LC3 and Beclin 1. A, DIC/fluorescence images of HUVEC or PAE-VEGFR2 cells as indicated and treated with endorepellin (200 nm), rapamycin (40 nm), or HBSS for 6 h showing formation of autophagosomes in the cytoplasm of the cells. Nuclei (blue) were stained with DAPI. B and C, representative fluorescence micrographs of PAE-VEGFR2 cells stably transfected with GFP-LC3 and treated for 6 h with endorepellin (200 nm) or vehicle as indicated. D and E, confocal images of Beclin 1 and LC3 cellular co-localization in HUVECs ± a 6-h treatment with endorepellin. The line-scanned profiles are next to each confocal image.
FIGURE 2.
FIGURE 2.
Endorepellin induces endothelial cell autophagy in a dose-dependent manner and promotes LC3-II interaction with Beclin 1. A–F, representative DIC immunofluorescence images of HUVEC exposed to the designated concentrations of endorepellin for 6 h. Notice the progressive formation of autophagic vesicles labeled by anti-LC3 antibody (green) and counterstained with DAPI (blue nuclei). Bar, 10 μm. G, quantification of autophagosomes/HUVEC from three independent experiments. Data represent mean ± S.E. from 52–75 cells/experimental condition; *, p < 0.05; **, p < 0.01; ***, p < 0.001. H–K, representative confocal images of HUVEC treated with endorepellin (200 nm), rapamycin (40 nm), or HBSS for 6 h showing increased expression of LC3 (green) and its relocalization to autophagosomes. L, quantification of the number of LC3-containing vacuoles per cell showing a significant increase in the amount of LC3-positive vacuoles upon treatment. Means ± S.E. (n = 3); ***, p < 0.001. M, representative co-immunoprecipitation of HUVEC stimulated with endorepellin (200 nm) for 6 h. The cells were lysed, immunoprecipitated (IP) with an anti-Beclin 1 antibody, and subjected to Western blot (WB) with anti-Beclin 1 and anti-LC3 as indicated. Nonspecific IgG served as negative control. The experiments were repeated three times with comparable results. Hc-IgG, heavy chain IgG.
FIGURE 3.
FIGURE 3.
Peg3 expression is affected by endorepellin promoting its interaction and co-localization with the autophagic markers Beclin 1 and LC3 in HUVEC. A, immunofluorescence images showing increasing expression of Peg3 upon endorepellin treatment (200 nm) in HUVEC. HBSS and rapamycin (40 nm) served as positive controls. B, representative co-immunoprecipitation of HUVEC stimulated with endorepellin (ER) (200 nm) for 6 h. The cells were lysed, immunoprecipitated (IP) with an anti-Peg3 antibody, and subjected to Western blot (WB) with anti-Peg3 anti-Beclin 1 as indicated. Nonspecific IgG served as negative control. The experiments were repeated three times with comparable results. Hc-IgG, heavy chain IgG. C–F, confocal images of Peg3 and Beclin 1 or Peg3 and LC3 co-localization in HUVEC upon a 6-h treatment with or without endorepellin (200 nm). The line-scanned profiles are next to each confocal image. The white arrows in the confocal images represent the distance within which the scans were generated. Bar, 10 μm. G, representative Western blot of various proteins, as indicated on the right margin, in HUVEC following time course treatment with soluble endorepellin (200 nm). H, quantification of three independent experiments as in G. Data represent the mean ± S.E.
FIGURE 4.
FIGURE 4.
Endorepellin regulates an autophagy transcriptional program via PEG3 and VEGFR2. A–C, expression of autophagy genes in HUVEC via qPCR under various experimental conditions involving LG1/2 (150 nm, 6 h), LG3 (150 nm, 6 h), and pre-incubation with the α2β1 blocking mAb (10 μg/ml, 30 min) in the presence of endorepellin (200 nm, 6 h) or via RNAi-mediated silencing of PEG3 (siPEG3, 80 pm) alone or in combination with endorepellin (200 nm, 6 h) or in the absence of VEGFR2 (siVEGFR2, 80 pm) following stimulation with endorepellin (200 nm, 6 h) relative to siScr (20 pm) controls for B, PEG3, C, BECN1, or D, MAPLC3A. Rapamycin (40 nm, 2 h) served as a positive control. D, verification of PEG3 (siPEG3, 80 pm) and VEGFR2 (siVEGFR2, 80 pm) RNAi-mediated knockdown relative to siScramble (siScr, 20 pm) controls in the presence or absence of endorepellin (200 nm, 6 h) via quantitative real time-PCR analysis in HUVEC. N.S., not significant. E, qPCR analysis of PEG3, BECN1, and MAPLC3A following endorepellin alone (200 nm, 6 h) or via pre-incubation (30 min) with the VEGFR2 small tyrosine kinase inhibitor SU5416 (30 μm) followed by treatment with endorepellin (200 nm, 6 h) in HUVEC. F, representative immunoblot of Peg3, Beclin 1, and LC3-II following incubation with either endorepellin (200 nm, 6 h), LG1/2 (150 nm, 6 h), or LG3 (150 nm, 6 h). The blocking mAb anti-α2β1 (10 μg/ml) was pre-incubated for 30 min prior to endorepellin stimulation (200 nm, 6 h). Rapamycin (40 nm, 2 h) served as a positive control. All gene expression changes were first normalized to the endogenous housekeeping gene, ACTB, calculated via the ΔΔCt method and reported as fold changes ±S.E. For immunoblotting, GAPDH served as a loading control. All data are representative of three independent trials run in quadruplicate replicates. **, p < 0.01; ***, p < 0.001.
FIGURE 5.
FIGURE 5.
Endorepellin induces redistribution of Vps34 into Beclin 1-positive autophagosomes in a VEGFR2-dependent but α2β1 integrin-independent manner. A, immunofluorescence images of HUVEC treated with endorepellin (200 nm) for 6 h showing a redistribution of Vps34 from the membrane to the cytoplasm of the cells. Nuclei were stained with DAPI (blue). B, immunofluorescence images of Beclin 1 and Vps34 co-localization in HUVEC upon a 6-h treatment with endorepellin (200 nm). Notice the complete block of VEGFR2 small molecule inhibitor SU5416 (30 μm). C, immunofluorescence images of Beclin 1 and Peg3 cellular co-localization in HUVECs upon a 6-h treatment with endorepellin (200 nm), LG1/2 (150 nm), or LG3 (150 nm). Notice that only LG1/2 was capable of inducing autophagy. D, immunofluorescence images of LC3 (green) in HUVEC upon a 6-h treatment with endorepellin (200 nm), and either the α2β1 integrin blocking mAb (10 μg/ml) or in combination with endorepellin as indicated. E, immunofluorescence images of LC3 (green) in HUVEC upon a 6-h treatment with LG1/2 (150 nm) and either the α2β1 integrin blocking mAb (10 μg/ml) or in combination with LG1/2 as indicated. Bars, 12 μm.
FIGURE 6.
FIGURE 6.
Endorepellin induces autophagy through a VEGFR2-dependent pathway and evokes transcription of BECN1 gene. A, representative immunoblotting following a 6-h treatment with endorepellin (200 nm) of HUVEC treated with scrambled siRNA (siScr), siRNA targeting the VEGFR2 (siVEGFR2), or SU5416 as indicated. The blotting is representative of three independent experiments with similar results. B, representative luciferase reporter assays of PAE-VEGFR2 BECN1-Luc cells treated with soluble endorepellin (200 nm) for the designated times, in the presence or absence of SU5416 (30 μm). Data are mean ± S.E., normalized to total cell protein. The values at 4 and 6 h are statistically significant (***, p < 0.001) as compared with time 0 and the SU5416-treated samples.
FIGURE 7.
FIGURE 7.
p62 expression is affected by endorepellin promoting its relocalization to LC3-positive autophagosomes in HUVEC. A, representative immunoblotting showing a time course induction of p62 upon endorepellin treatment (200 nm), with GAPDH as control. B, quantification of p62 levels evoked by endorepellin (200 nm) treatment for various intervals as indicated. The values represent the mean ± S.E. of six independent experiments; *, p < 0.05; **, p < 0.01. C, immunofluorescence images of HUVEC treated with endorepellin (200 nm) for 6 h showing a relocalization of p62 (red) into LC3-positive autophagosomes. Nuclei are stained with DAPI (blue). Bar, 10 μm. D, immunofluorescence images of p62 (red) and LC3 (green) co-localization in HUVEC upon a 6-h treatment with vehicle (control), LG1/2 (150 nm), or LG3 (150 nm). Nuclei are stained with DAPI. Bar, 10 μm.
FIGURE 8.
FIGURE 8.
Endorepellin inhibits capillary tube formation in tandem with autophagy induction. A and C, representative fluorescence images of 6-h vehicle-treated (control) or endorepellin-treated (200 nm) PAE-VEGFR2 cells stably expressing GFP-LC3. Approximately 104 cells were seeded on Matrigel previously gelled in a four-chamber slide. All images were taken with the same exposure and gain. Bar, 50 μm. B and D, three-dimensional surface plots processed on ImageJ representing the fluorescence intensity of the corresponding images. E, quantification of various angiogenic (capillary morphogenesis) parameters as indicated in the y axis from images similar to those shown in A and C, respectively. The data were acquired using the tube formation analysis tool WimTube offered by Wimasis Image Analysis, GmbH. ***, p < 0.001.
FIGURE 9.
FIGURE 9.
Working model elucidating the mechanism in which endorepellin induces autophagy through the VEGFR2 α2β1 integrin-independent manner. Please, see the text for detailed information.

Similar articles

Cited by

References

    1. Noonan D. M., Fulle A., Valente P., Cai S., Horigan E., Sasaki M., Yamada Y., Hassell J. R. (1991) The complete sequence of perlecan, a basement membrane heparan sulfate proteoglycan, reveals extensive similarity with laminin A chain, low density lipoprotein-receptor, and the neural cell adhesion molecule. J. Biol. Chem. 266, 22939–22947 - PubMed
    1. Murdoch A. D., Dodge G. R., Cohen I., Tuan R. S., Iozzo R. V. (1992) Primary structure of the human heparan sulfate proteoglycan from basement membrane (HSPG2/perlecan). A chimeric molecule with multiple domains homologous to the low density lipoprotein receptor, laminin, neural cell adhesion molecules, and epidermal growth factor. J. Biol. Chem. 267, 8544–8557 - PubMed
    1. Cohen I. R., Grässel S., Murdoch A. D., Iozzo R. V. (1993) Structural characterization of the complete human perlecan gene and its promoter. Proc. Natl. Acad. Sci. U.S.A. 90, 10404–10408 - PMC - PubMed
    1. Iozzo R. V., Pillarisetti J., Sharma B., Murdoch A. D., Danielson K. G., Uitto J., Mauviel A. (1997) Structural and functional characterization of the human perlecan gene promoter. Transcriptional activation by transforming factor-β via a nuclear factor 1-binding element. J. Biol. Chem. 272, 5219–5228 - PubMed
    1. Sharma B., Iozzo R. V. (1998) Transcriptional silencing of perlecan gene expression by interferon-γ. J. Biol. Chem. 273, 4642–4646 - PubMed

Publication types

MeSH terms