. 2014 Oct 15;522(15):3403-22.
doi: 10.1002/cne.23609. Epub 2014 Apr 29.

A general principle governs vision-dependent dendritic patterning of retinal ganglion cells

Affiliations

A general principle governs vision-dependent dendritic patterning of retinal ganglion cells

Hong-Ping Xu et al. J Comp Neurol. .

Abstract

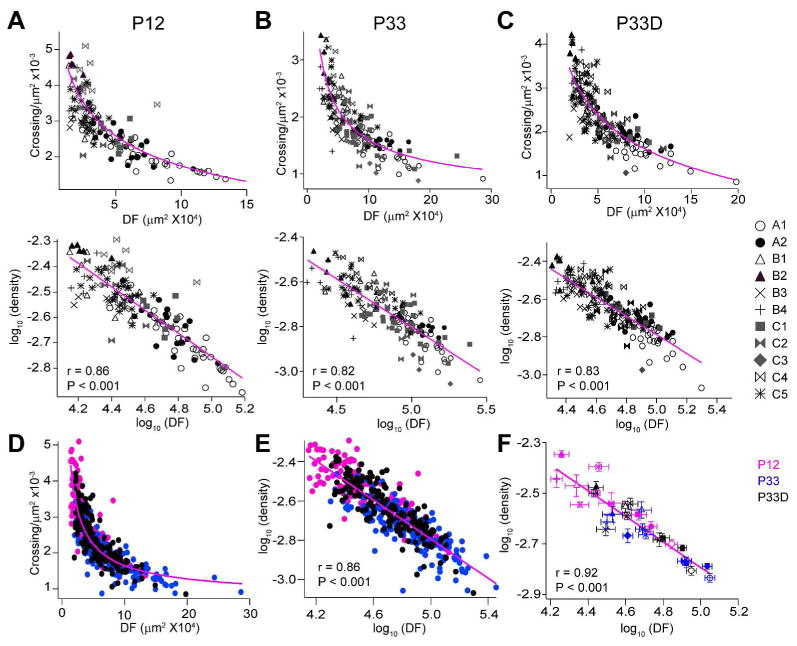
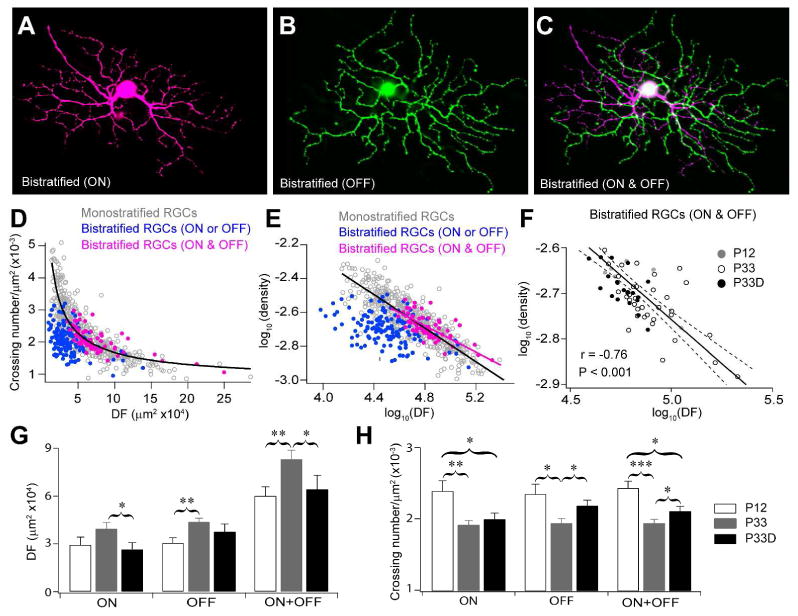
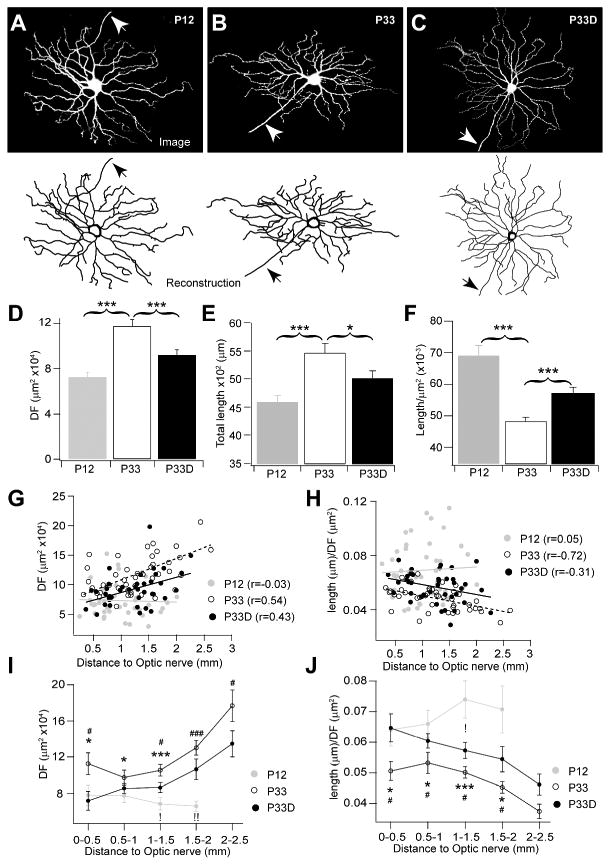
Dendritic arbors of retinal ganglion cells (RGCs) collect information over a certain area of the visual scene. The coverage territory and the arbor density of dendrites determine what fraction of the visual field is sampled by a single cell and at what resolution. However, it is not clear whether visual stimulation is required for the establishment of branching patterns of RGCs, and whether a general principle directs the dendritic patterning of diverse RGCs. By analyzing the geometric structures of RGC dendrites, we found that dendritic arbors of RGCs underwent a substantial spatial rearrangement after eye-opening. Light deprivation blocked both the dendritic growth and the branch patterning, suggesting that visual stimulation is required for the acquisition of specific branching patterns of RGCs. We further showed that vision-dependent dendritic growth and arbor refinement occurred mainly in the middle portion of the dendritic tree. This nonproportional growth and selective refinement suggest that the late-stage dendritic development of RGCs is not a passive stretching with the growth of eyes, but rather an active process of selective growth/elimination of dendritic arbors of RGCs driven by visual activity. Finally, our data showed that there was a power law relationship between the coverage territory and dendritic arbor density of RGCs on a cell-by-cell basis. RGCs were systematically less dense when they cover larger territories regardless of their cell type, retinal location, or developmental stage. These results suggest that a general structural design principle directs the vision-dependent patterning of RGC dendrites.

Keywords: dendritic density and coverage territory; dendritic development; retinal ganglion cell; visual activity.


Conflict of interest statement

Conflict of Interest Statement: There is no conflict of Interests.

Figures

Figure 1
Figure 1. Sholl analysis revealed that RGCs underwent a vision dependent dendritic growth and arbor density reduction after eye-opening
(A) Representative images of diverse RGC subtypes in the retina of P33 mice. (B) Quantitative Sholl analysis of dendritic arbors of RGCs. One RGC was superimposed to 10 concentric circles with increasing radius at a 25 μm step. The outermost dendritic tips were linked to calculate dendritic field (DF) size of the RGC. The number of crossing between dendritic branches and circles was counted. Arrow points to the axon. (C) Cumulative probabilities of DF areas of monostratified RGCs collected from P12, P33 and dark-reared P33 (P33D) mice (P < 0.001 for comparison between P12 and P33; P < 0.001 for comparison between P33 and P33D; and P < 0.001 for comparison between P12 and P33D, K-S test). Inset, histograms of DF sizes of RGCs in the three groups of mice. (D) Cumulative probabilities of total crossing numbers of monostratified RGCs at P12, P33 and P33D mice (P < 0.001 for comparison between P12 and P33; P < 0.001 for comparison between P33 and P33D; and P < 0.001 for comparison between P12 and P33D, K-S test). Inset, histograms of the crossing number between concentric circles and dendritic arbors of RGCs in the retina of P12, P33 and P33D mice. (E) Cumulative probabilities of dendritic densities of RGCs measured as number of crossing per unit DF area. Crossings at P33 mice were less dense than that at the P12 (P < 0.001, K-S test). Light deprivation partially blocked this developmental reduction of the dendritic arbor density (P < 0.001 compared with either the P12 or the P33). Inset, histograms of crossing densities of RGCs in the retina of P12, P33 and P33D mice.
Figure 2
Figure 2. A general structural design principle directs the vision dependent dendritic refinement of RGCs
(A-C top) Plots of coverage areas versus dendritic densities (measured as number of crossings per unit DF area) of different RGCs types in P12 (A top), P33 (B top) and dark-reared P33 (P33D) mice (C top). Solid lines represent decreasing exponential regressions. (A-C bottom) Plots of coverage areas versus arbor densities in logarithmic spaces of diverse RGC types in P12 (A bottom), P33 (B bottom) and P33D mice (C bottom). Solid lines represent linear regressions. (D) Plots of coverage areas versus dendritic densities of RGCs in mice of different ages and rearing conditions. Solid line, decreasing exponential regression. (E) Plots of coverage areas versus dendritic densities of RGCs in mice of different ages and rearing conditions in a logarithmic space. Solid line, linear regression. (F) The coverage areas and the dendritic densities were first averaged based on cell types and then plotted in a logarithmic space. The relationship between these two morphological features follows a scaling law regardless of the cell types, developmental stages and rearing conditions.
Figure 3
Figure 3. Dendrites of bistratified RGCs follow the same scaling law as the monostratified RGCs
(A-C) Representative images of a bistratified RGC. The dendrites of this cell form two layers, the ON (A) and the OFF (B) dendritic layers, arborized in the sublamina b and a of the IPL, respectively. (C) Overlay (ON & OFF) of the two layers of dendritic arbors of the bistratified RGC. (D) Plots of the dendritic densities versus the sizes of DFs of bistratified RGCs in P12, P33 and dark-reared P33 (P33D) mice. Neither the ON nor the OFF dendrites of bistratified RGCs (ON or OFF, blue) follows the scaling law defined by monostratified RGCs. However, dendrites of bistratified RGCs and the monostratified RGCs followed the same scaling law when the ON and the OFF dendrites of bistratified RGCs were examined together (ON & OFF, magenta). (E) Plots of the dendritic densities versus the dendritic field sizes of bistratified RGCs in P12, P33 and P33D mice in a logarithmic space. There was no difference between slopes of linear regressions of monostratified RGCs (slope = -0.49) and bistratified RGCs when the ON and the OFF dendrites were examined together (magenta, slope = -0.44, P > 0.05, ANCOVA). (F) Plot of dendritic densities (ON & OFF) versus the dendritic field sizes (ON & OFF) of bistratified RGCs, with linear regression (solid line) and 95 % confidence interval (dashed lines). (G) The coverage areas (DF) of dendritic arbors in the ON or OFF layer and the area summation of ON and OFF arbors of bistratified RGCs in P12, P33 and P33D mice. (H) The dendritic densities (crossing/μm2 DF area) of dendritic arbors in the ON or the OFF layer and the density summation of ON and OFF arbors of bistratified RGCs in P12, P33 and P33D mice. *, ** and ***, P < 0.05, P < 0.01, P < 0.001, respectively.
Figure 4
Figure 4. Light deprivation substantially blocked the dendritic growth and the arbor refinement of A type RGCs occurred after eye-opening
(A-C) Representative images (top) and their reconstruction counterparts (bottom) of A type RGCs collected from retinas of a P12 (A), a P33 (B) and a dark-reared P33 (P33D, C) mice. Arrows point to axons. (D) The sizes of dendritic fields of A type RGCs were increased from P12 to P33 (P < 0.001, Student t-test). Light deprivation substantially blocked this age dependent expansion of the dendritic field sizes (P < 0.001 for comparison between P33D and P33; P < 0.01 for comparison between P33D and P12, Student t-test). (E) The total arbor lengths of A type RGCs was increased from P12 to P33 (P < 0.001, Student t-test). Vision deprivation partially blocked the dendritic arbor growth occurred after eye-opening (P < 0.05 for comparison between P33 and P33D; P < 0.05 for comparison between P33D and P12; Student t-test). (F) The dendritic density measured as the average arbor length per unit DF area was reduced from P12 to P33 (P < 0.001, Student t-test). Vision deprivation partially blocked the age-dependent arbor density reduction (P < 0.001 for both comparisons between P33 and P33D and between P33D and P12, Student t-test). (G) Plots of DF sizes and eccentricities of RGCs in retinas of P12, P33 and P33D mice. The DFs of A type RGCs increased with the increase of retinal eccentricity at P33 mice reared under either normal conditions (r=0.54, P < 0.001) or constant darkness (r=0.43, P < 0.001). There was no eccentricity related DF change at P12 (r=-0.03, P > 0.05). (H) Plots of dendritic arbor densities and the retinal eccentricities of RGCs in retinas of P12, P33 and P33D mice. The arbor density decreases with the increase of the retinal eccentricity at P33 mice reared under normal conditions (r=0.72, P <0.001). There was no eccentricity related arbor density changes in P12 (r=0.05, P > 0.05) and P33D mice (r=-0.31, P > 0.05). (I) Plots of the DF sizes and the retinal locations of A type RGCs, which were grouped based on their retinal eccentricities. (J) Plots of the arbor densities and the retinal location of A type RGCs grouped based on their retinal eccentricities. *, ** and ***, P < 0.05, P < 0.01, P < 0.001, respectively, for comparison between P12 and P33; #, ## and ###, P < 0.05, P < 0.01, P < 0.001, respectively, for comparison between P33 and P33D; !, and !!, P < 0.05 and P < 0.01, respectively, for comparison between P12 and P33D for (I) and (J).
Figure 5
Figure 5. Dendrites of A type RGCs undergo a significant spatial reorganization after eye-opening
(A) The number of terminal dendrites (ends) in the P33 mice was significantly less than that in the P12 and the dark-reared P33 mice (P < 0.001; P < 0.05 and P > 0.05, for comparison between P12 and P33, comparison between P33 and P33D and comparison between P12 and P33D, respectively, Student t-test), despite the numbers of primary dendrites of A type RGCs were similar in retinas of P12, P33 and P33D mice. (B) Comparison of numbers of branches at different orders of A type RGCs in P12, P33 and P33D mice. (C) Average segment lengths of dendritic arbors at different orders of A type RGCs in the P12, P33 and P33D mice. Average segment tortuosity (D) and dendritic planar angles (E) of A type RGCs at different branch orders in the P12, P33 and P33D mice. *, ** and ***, P < 0.05, P < 0.01, P < 0.001, respectively, for comparison between P12 and P33; #, ## and ###, P < 0.05, P < 0.01, P < 0.001, respectively, for comparison between P33 and P33D.
Figure 6
Figure 6. A scaling law describes the relationship between the coverage territory and the arbor density of A type RGCs
(A) Plots of the coverage areas versus the dendritic lengths of A type RGCs in P12 (top), P33 (middle) and dark-reared P33 (P33D, bottom) mice, with linear regressions (solid lines) and 95 % confidence intervals (dashed lines). (B) Power law relationships between the DF sizes and the arbor densities (measured by dendritic length per unit DF) of A type RGCs in P12 (top), P33 (middle) and P33D (bottom) mice. (C) Plots of coverage areas versus arbor densities in logarithmic spaces of A type RGCs in P12 (top), P33 (middle) and P33D (bottom) mice, with linear regressions (solid lines) and 95 % confidence intervals (dashed lines). (D-F) Plots of dendritic length (D) and dendritic density (E) versus DF size of all A type RGCs collected from three groups (P12, P33 and P33D) of mice. Solid and dashed lines in D represent linear regressions and 95 % confidence intervals, respectively. Solid line in E represents the exponentially decreasing regression. (F) Plots of dendritic densities versus the DF sizes of A type RGCs from all three groups of mice in a logarithmic space, with linear regressions (solid lines) and 95 % confidence intervals (dashed lines). (G) Plots of the branch numbers versus the DF areas of A type RGCs in P12, P33 and P33D mice, with exponentially decreasing regressions (solid line). (H) Plots of branch numbers versus the DF areas of A type RGCs in P12, P33 and P33D mice in a logarithmic space, with linear regression (solid lines) and 95 % confidence interval (dashed lines). (I) Plots of branch numbers and the retinal eccentricities of A type RGCs in the three groups of mice.
Figure 7
Figure 7. Visual activity dependent dendritic growth and patterning of RGCs was not related to their dendritic stratification
(A) A Representative ON A type RGC and its dendritic stratification in the IPL. Left, maximum X-Y projection of an image stack showing the branching pattern of the RGC (green) and TH positive dopaminergic amacine cells (magenta). Middle, Y-Z projection of the same image stack showing dendritic stratification of the RGC. Right, Gaussian fitting of pixel intensity curve of the image stack. The pixel intensity of this RGC peaked (arrow) at 72 % of the IPL. The shadowed area indicates sublamina a. (B) A Representative OFF A type RGC in X-Y (left) and Y-Z (middle) projections. Right, the pixel intensity of this OFF RGC peaked (arrow) at 31 % of the IPL measured by Gaussian fitting of the pixel intensity curve. The DF area (C) and the dendritic density measured by either the Sholl analysis (D, crossing) or dendritic reconstruction (E, nodes) of RGCs in P12 and P33 mice were plotted against the peak dendritic location in the IPL. (F-H) Scatter plots of the DF area (F) and the dendritic density measured by either the Sholl analysis (G) or the dendritic reconstruction (H) as a function of peak dendritic locations of RGCs from mice reared under either normal condition (P33) or constant darkness (P33D). (I) Average DF area of ON and OFF A type RGCs of P12 mice reared under normal condition and P33 mice reared under either normal or dark condition. (J) Average dendritic density of ON and OFF A type RGCs of P12 mice reared under normal condition and P33 mice reared under either normal or dark condition. (K) Average nodes number of ON and OFF A type RGCs of P12 mice reared under normal condition and P33 mice reared under either normal or dark condition. *, ** and ***, P < 0.05, P < 0.01, P < 0.001, respectively; n.s., not statistically different.

Similar articles

Cited by

References

    1. Antibodies: “YFP was localized using a rabbit polyclonal antibody against GFP isolated directly from Aequorea Victoria (Molecular Probes, Cat# A21311, RRID: AB_10058149)” and “Tyrosine hydroxylase was localized using a sheep polyclonal antibody against pheochromocytoma Tyrosine hydroxylase (Chemicon Cat# AB1542, RRID: AB_90755)”

    1. Bansal A, Singer JH, Hwang BJ, Xu W, Beaudet A, Feller MB. Mice lacking specific nicotinic acetylcholine receptor subunits exhibit dramatically altered spontaneous activity patterns and reveal a limited role for retinal waves in forming ON and OFF circuits in the inner retina. J Neurosci. 2000;20:7672–7681. - PMC - PubMed
    1. Bodnarenko SR, Chalupa LM. Stratification of ON and OFF ganglion cell dendrites depends on glutamate-mediated afferent activity in the developing retina. Nature. 1993;364:144–146. - PubMed
    1. Bodnarenko SR, Jeyarasasingam G, Chalupa LM. Development and regulation of dendritic stratification in retinal ganglion cells by glutamate mediated afferent activity. J Neurosci. 1995;15:7037–7045. - PMC - PubMed
    1. Bleckert A, Schwartz GW, Turner MH, Rieke F, Wong ROL. Visual space is represented by nonmatching topographies of distinct mouse retinal ganglion cell types. Current Biology. 2014;24:310–315. - PMC - PubMed

Publication types

MeSH terms

Substances

LinkOut - more resources