Review
. 2014 Apr 2:13:67-76.
doi: 10.4137/CIN.S12419. eCollection 2014.

Nonlinear optical microscopy signal processing strategies in cancer

Affiliations
Review

Nonlinear optical microscopy signal processing strategies in cancer

Javier Adur et al. Cancer Inform. .

Abstract

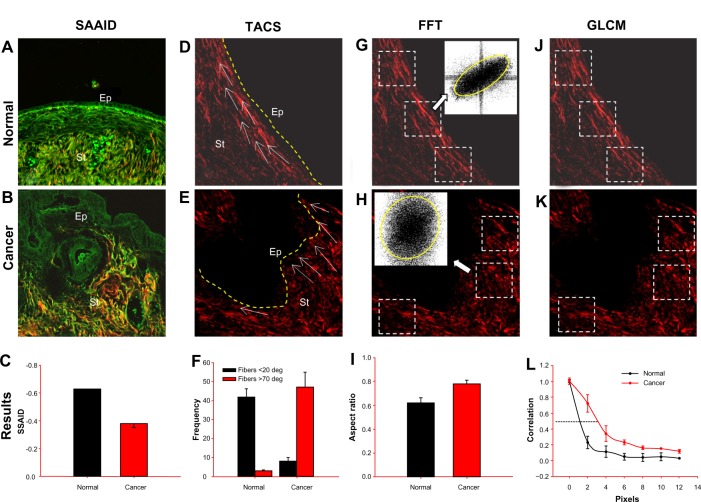
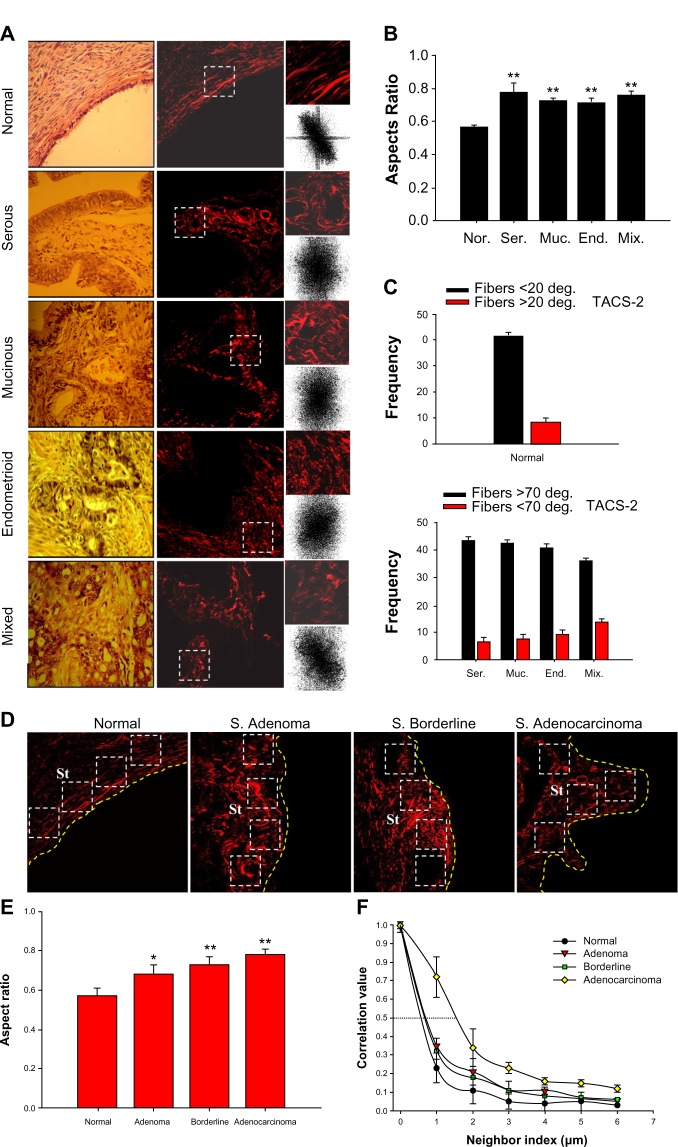
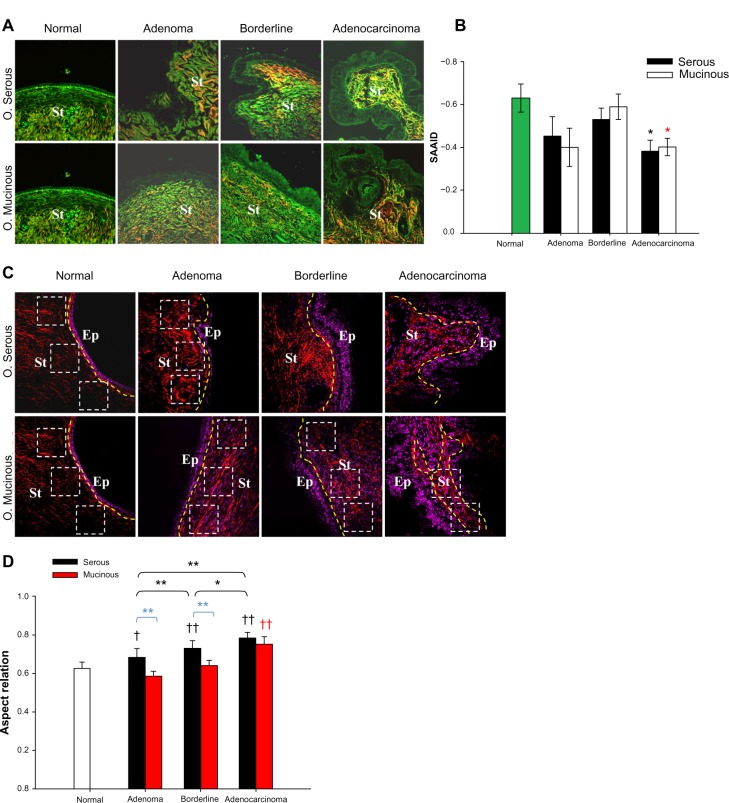
This work reviews the most relevant present-day processing methods used to improve the accuracy of multimodal nonlinear images in the detection of epithelial cancer and the supporting stroma. Special emphasis has been placed on methods of non linear optical (NLO) microscopy image processing such as: second harmonic to autofluorescence ageing index of dermis (SAAID), tumor-associated collagen signatures (TACS), fast Fourier transform (FFT) analysis, and gray level co-occurrence matrix (GLCM)-based methods. These strategies are presented as a set of potential valuable diagnostic tools for early cancer detection. It may be proposed that the combination of NLO microscopy and informatics based image analysis approaches described in this review (all carried out on free software) may represent a powerful tool to investigate collagen organization and remodeling of extracellular matrix in carcinogenesis processes.

Keywords: anisotropy; gray level co-occurrence matrix; nonlinear microscopy; nonlinear signal; tumor-associated collagen signatures.


Figures

Figure 1
Figure 1
Depicting several applications of different methods to analyze NLO signals. The panel shows representative TPEF (green) and SHG (red) images of (A, D, G, J) normal and (B, E, H, K) cancer ovary. From the TPEF + SHG combination (first column), it is possible to calculate (C) the SAAID ratio. From the SGH image (remaining columns) and using regions near the epithelial/stromal interface (yellow line), it is possible to calculate: (F) TACS (measuring the collagen fiber angle relative to the epithelium); (I) FFT transforms (and fit to ellipse to estimate the anisotropy); and (L) GLCM (correlation value). Abbreviations: Ep, epithelium; St, stroma; TPEF, two-photon excited fluorescence; SHG, second harmonic generation; SAAID, second harmonic to autofluorescence ageing index of dermis; TACS, tumor associate collagen signature; FFT, fast Fourier transform; GLCM, gray level co-occurrence matrix; white arrows, collagen fibers; white squares, regions of interest, ROI.
Figure 2
Figure 2
(A) Representative bright field H&E and SHG images of tissues diagnosed as normal ovary, serous, mucinous, endometrioid, and mixed adenocarcinomas. FFT intensity images obtained after 2D-DFT of the only one ROI are shown below the SHG images. (B) Top right, AR results corresponding to ovarian samples averaged on all ROI examined. Each bar represents the mean ± SD of independent 2D-DFT. Asterisks (**) indicate P < 0.01 difference from normal samples. (C) Histograms showing the quantitative analysis of TACS collagen fibers - in normal samples are arranged around 0° (angle < 20°), while in tumors samples, the angles are around 90° (angle >70°). Nor: normal; Ser: serous; Muc: mucinous; End: endometrioid; mix: mixed. (D) Representative SHG images of tissues diagnosed as (left to right) normal ovary, serous adenoma, serous borderline tumor, and serous adenocarcinoma. (E) Histogram exhibiting the AR quantitative outcome of the ovarian samples. They were averaged on all the examined ROI. Four ROI (120 × 120 pixel side squared) in each subtype of serous sample were selected. Each bar represents the mean ± SD of independent 2D-DFT. Significant differences from normal samples were indicated by (*) and (**): P < 0.05 and P < 0.01, respectively. (F) Correlation values in serous ovarian tumors versus distances pixels. The correlation for distances ranging from 1 to 18 pixels (0.35–6.0 μm) in three ROI of 101 × 101 pixels of interest for each biopsy was calculated. Abbreviations: Nor, normal; Ade, adenoma; Bor, borderline; Adenoc, adenocarcinoma; St, stroma; white squares, regions of interest, ROI; yellow line, epithelial/stromal interface.
Figure 3
Figure 3
Collagen/elastin ratio quantification in the ovarian stroma. (A) Representative merges of TPEF (green) and SHG (red) cross-sectional images of ovarian tissues. (B) Histogram showing the outcome of the SAAID index from stroma regions – each bar represents the mean ± SD of independent measurements. Single asterisks indicate a significant increase as compared to the nontumor tissues (P < 0.05, t-test). (C) Representative SHG (red) + THG (magenta) from ovarian images. SHG images allow to obtain anisotropy, the results of the AR (each bar represents the mean ± SD of independent measurements) of ovarian samples averaged on all ROI examined. (D) ANOVA comparisons of pathological against normal tissues. Single dagger (†) or single asterisk (*) indicate significant differences (P < 0.05), whereas double dagger (††) or double asterisk (**) indicate very significant differences (P < 0.01). Abbreviations: Border, borderline; Adenocar, adenocarcinoma; Ep, epithelium; St, stroma; white squares, regions of interest, ROI; yellow line, epithelial/stromal interface.

References

    1. Conklin MW, Eickhoff JC, Riching KM, et al. Aligned collagen is a prognostic signature for survival in human breast carcinoma. Am J Pathol. 2011;178(3):1221–32. - PMC - PubMed
    1. Hu W, Zhao G, Wang C, Zhang J, Fu L. Nonlinear optical microscopy for histology of fresh normal and cancerous pancreatic tissues. PLoS ONE. 2012;7(5):e37962. - PMC - PubMed
    1. Jain M, Robinson BD, Scherr DS, et al. Multiphoton microscopy in the evaluation of human bladder biopsies. Arch Pathol Lab Med. 2012;136(5):517–26. - PMC - PubMed
    1. Mitra R, Chao O, Urasaki Y, Goodman OB, Le TT. Detection of lipid-rich prostate circulating tumour cells with coherent anti-Stokes Raman scattering microscopy. BMC Cancer. 2012;12:540. - PMC - PubMed
    1. Carriles R, Schafer DN, Sheetz KE, et al. Imaging techniques for harmonic and multiphoton absorption fluorescence microscopy. Rev Sci Instrum. 2009;80(8):081101. - PMC - PubMed

LinkOut - more resources