. 2014 Mar 11:2014:746451.
doi: 10.1155/2014/746451. eCollection 2014.

Comparative performance of four single extreme outlier discordancy tests from Monte Carlo simulations

Affiliations

Comparative performance of four single extreme outlier discordancy tests from Monte Carlo simulations

Surendra P Verma et al. ScientificWorldJournal. .

Abstract

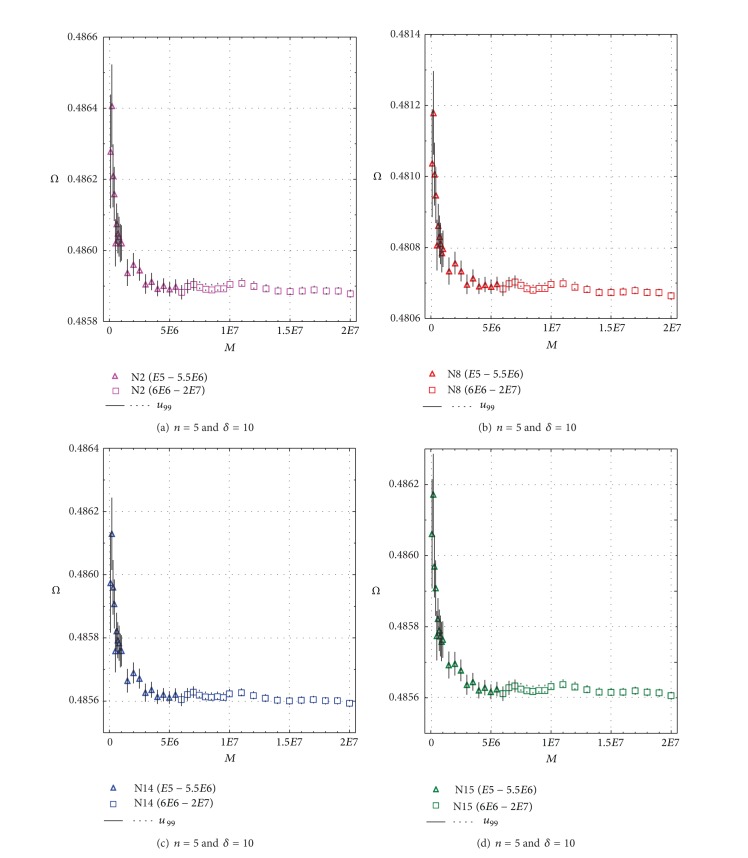
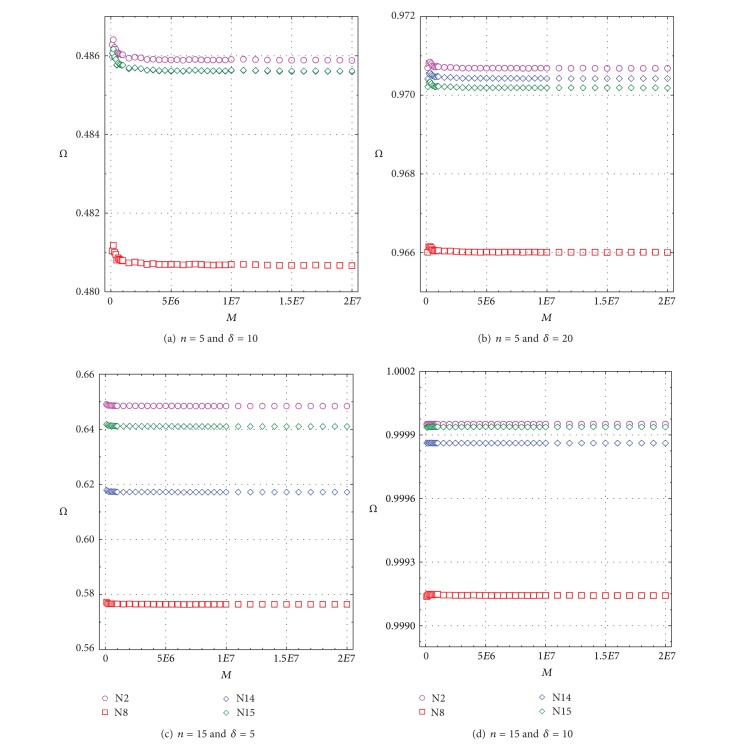
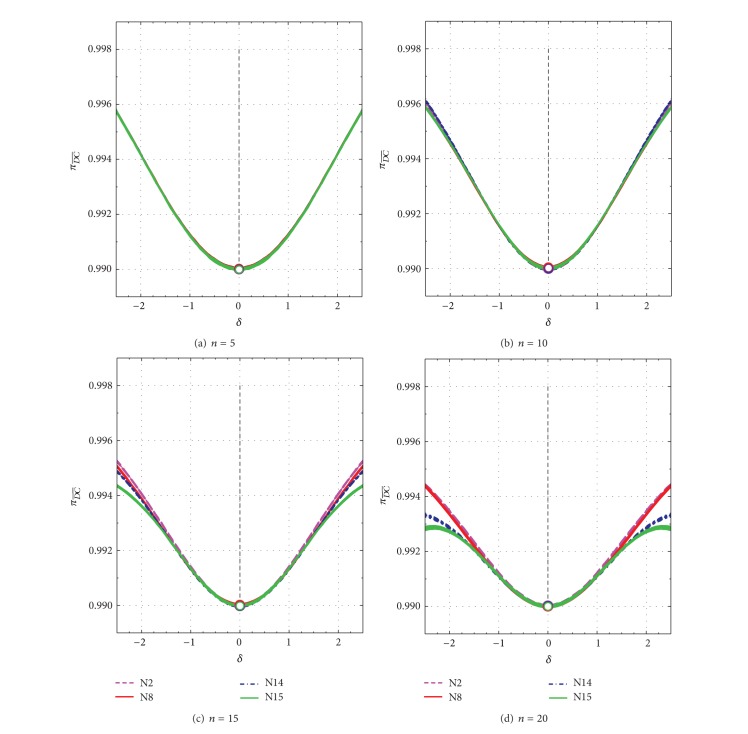
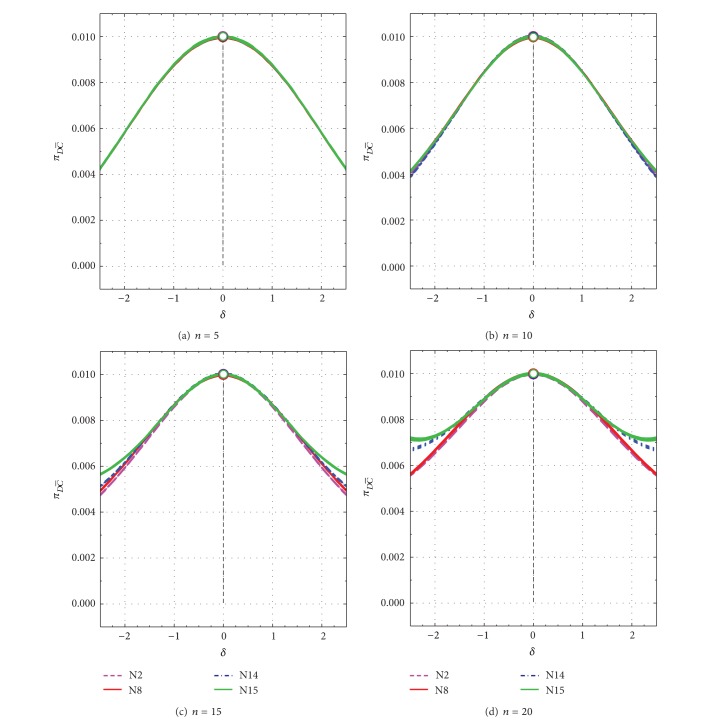
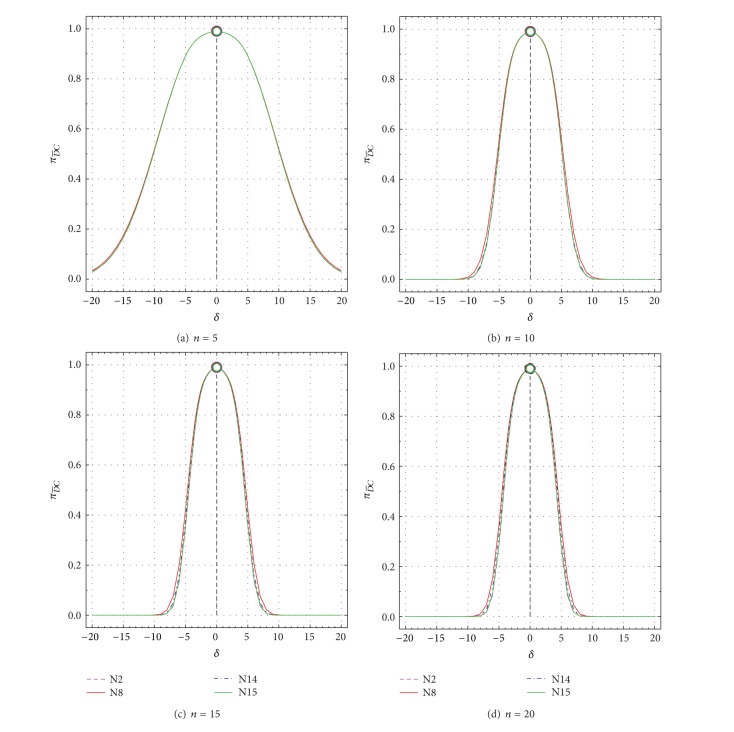
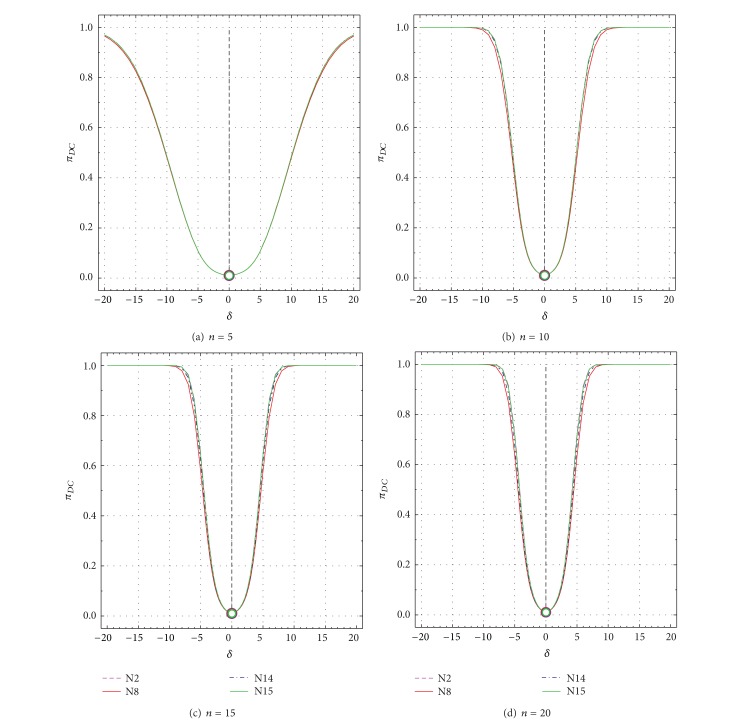
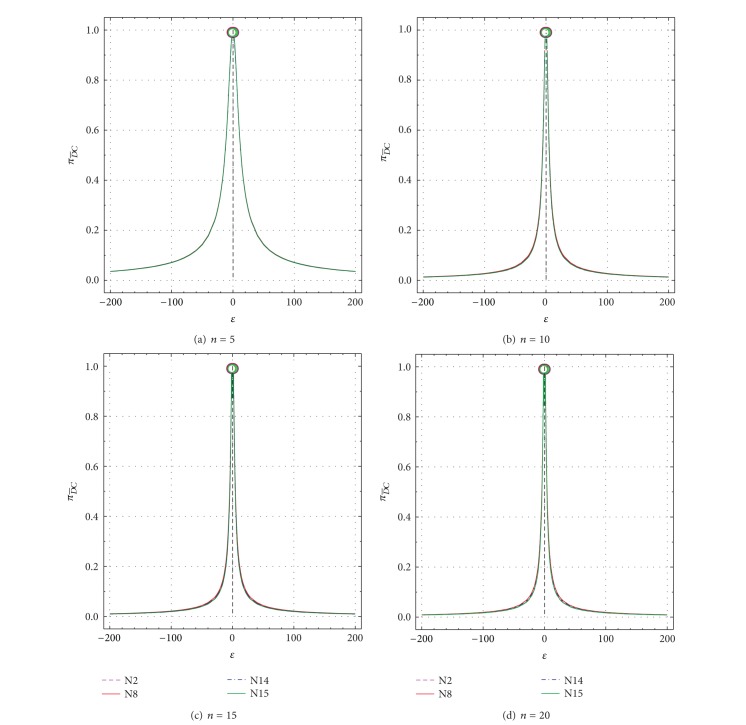
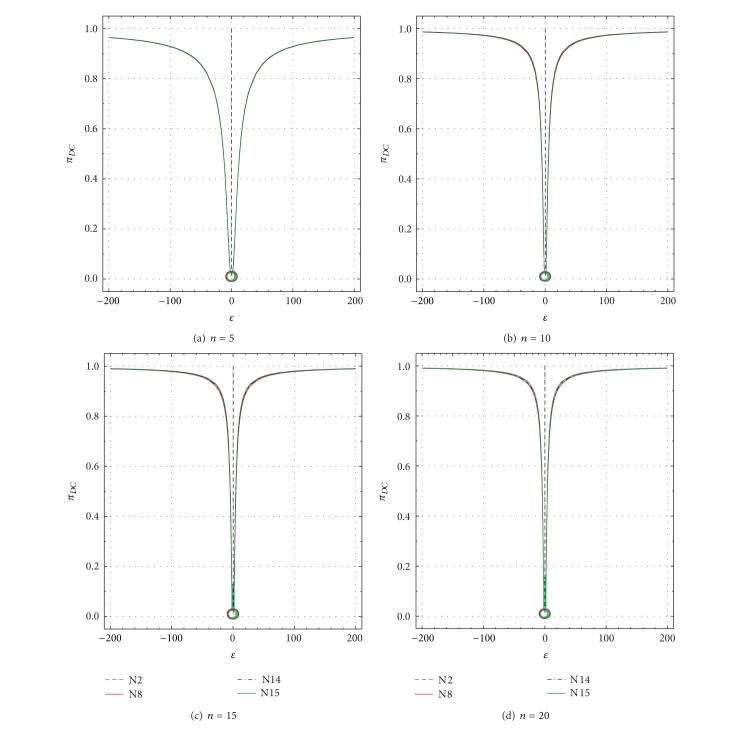
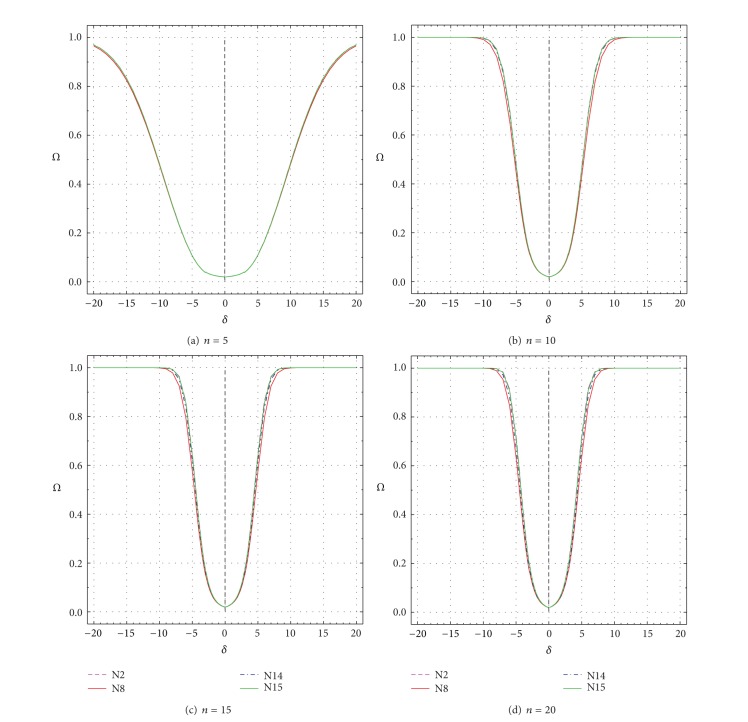
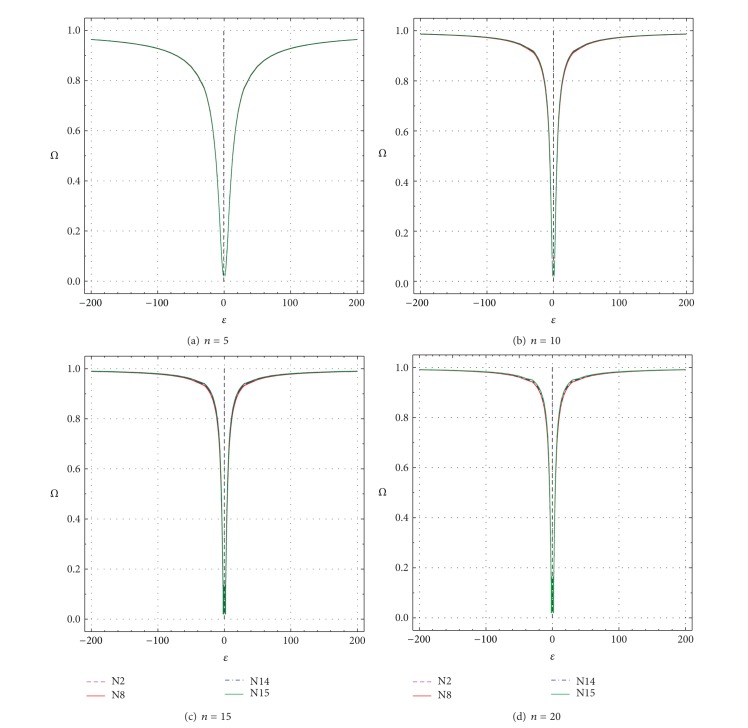
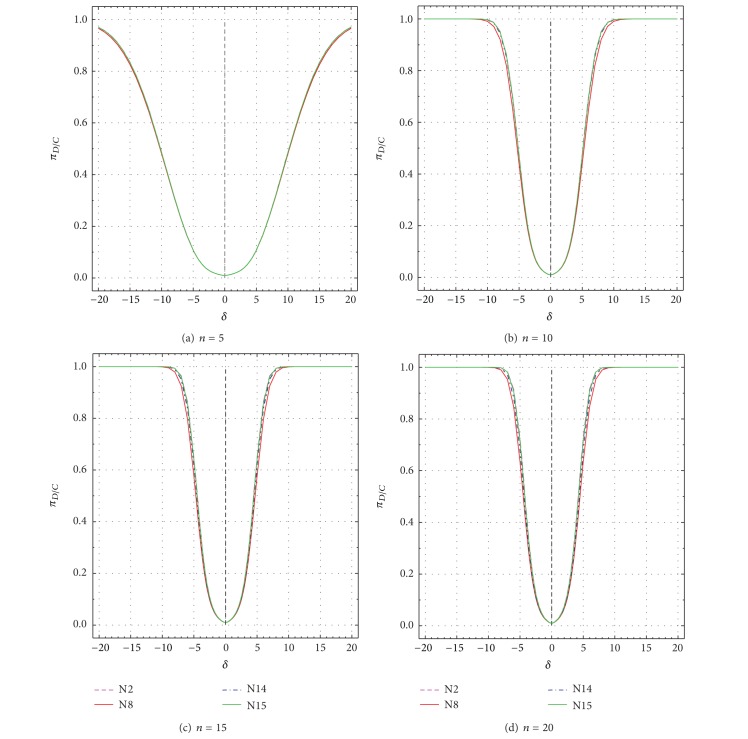
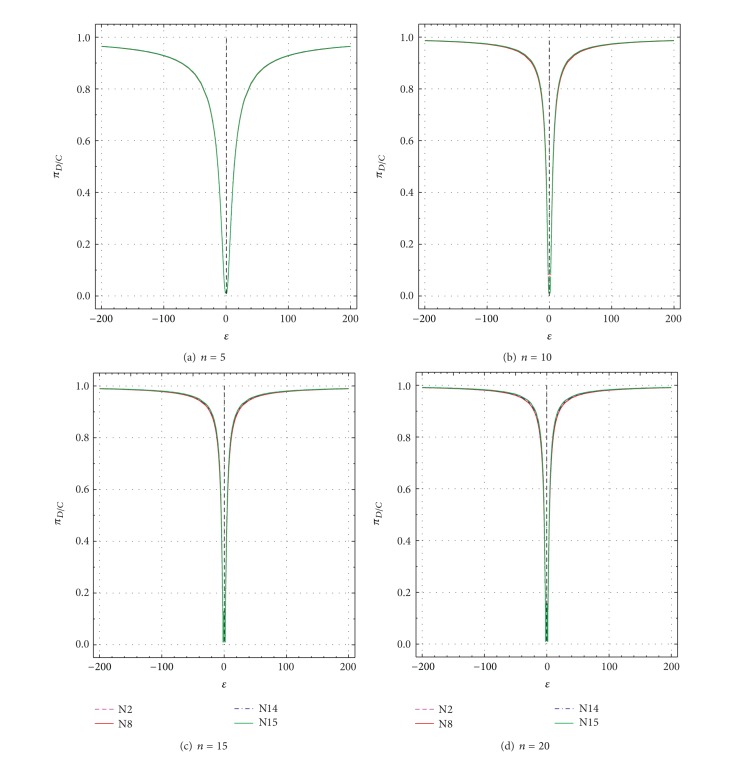
Using highly precise and accurate Monte Carlo simulations of 20,000,000 replications and 102 independent simulation experiments with extremely low simulation errors and total uncertainties, we evaluated the performance of four single outlier discordancy tests (Grubbs test N2, Dixon test N8, skewness test N14, and kurtosis test N15) for normal samples of sizes 5 to 20. Statistical contaminations of a single observation resulting from parameters called δ from ±0.1 up to ±20 for modeling the slippage of central tendency or ε from ±1.1 up to ±200 for slippage of dispersion, as well as no contamination (δ = 0 and ε = ±1), were simulated. Because of the use of precise and accurate random and normally distributed simulated data, very large replications, and a large number of independent experiments, this paper presents a novel approach for precise and accurate estimations of power functions of four popular discordancy tests and, therefore, should not be considered as a simple simulation exercise unrelated to probability and statistics. From both criteria of the Power of Test proposed by Hayes and Kinsella and the Test Performance Criterion of Barnett and Lewis, Dixon test N8 performs less well than the other three tests. The overall performance of these four tests could be summarized as N2≅N15 > N14 > N8.


Figures

Figure 1
Figure 1
Determination of optimum simulation replication (M) for Power of Test (Ω) as a function of replications for sample size n = 5 and contaminant parameter δ = 10; symbols are explained in each figure; the vertical error bars represent uncertainty (u 99) at 99% confidence level from 102 simulations. (a) test N2; (b) test N8; (c) test N14; and (d) test N15.
Figure 2
Figure 2
Determination of optimum simulation replication (M) for Power of Test (Ω) as a function of replications for all tests N2, N8, N14, and N15; symbols are explained in each figure. (a) Sample size n = 5 and contaminant parameter δ = 10; (b) n = 5 and δ = 20; (c) n = 15 and δ = 5; and (d) n = 15 and δ = 10.
Figure 3
Figure 3
Spurious type II error probability (πD¯C¯) as a function of δ from −2.5 to +2.5 for all tests N2, N8, N14, and N15. πD¯C¯ values for uncontaminated samples (δ = 0) are shown by open circles. (a) n = 5; (b) n = 10; (c) n = 15; and (d) n = 20.
Figure 4
Figure 4
Spurious power probability (πDC¯) as a function of δ from −2.5 to +2.5 for all tests N2, N8, N14, and N15. πDC¯ values for uncontaminated samples (δ = 0) are shown by open circles. (a) n = 5; (b) n = 10; (c) n = 15; and (d) n = 20.
Figure 5
Figure 5
Nonspurious type II error probability (πD¯C) as a function of δ from −20 to +20 for all tests N2, N8, N14, and N15. πD¯C values for uncontaminated samples (δ = 0) are shown by open circles. (a) n = 5; (b) n = 10; (c) n = 15; and (d) n = 20.
Figure 6
Figure 6
Nonspurious power probability (π DC) as a function of δ from −20 to +20 for all tests N2, N8, N14, and N15. π DC values for uncontaminated samples (δ = 0) are shown by open circles. (a) n = 5; (b) n = 10; (c) n = 15; and (d) n = 20.
Figure 7
Figure 7
Nonspurious type II error probability (πD¯C) as a function of ε from −1 to −200 and +1 to +200 for all tests N2, N8, N14, and N15. πD¯C values for uncontaminated samples (ε = ±1) are shown by open circles. (a) n = 5; (b) n = 10; (c) n = 15; and (d) n = 20.
Figure 8
Figure 8
Nonspurious power probability (π DC) as a function of ε from −1 to −200 and +1 to +200 for all tests N2, N8, N14, and N15. π DC values for uncontaminated samples (ε = ±1) are shown by open circles. (a) n = 5; (b) n = 10; (c) n = 15; and (d) n = 20.
Figure 9
Figure 9
Power of Test (Ω) as a function of δ from −20 to +20 for all tests N2, N8, N14, and N15. (a) n = 5; (b) n = 10; (c) n = 15; and (d) n = 20.
Figure 10
Figure 10
Power of Test (Ω) as a function of ε from −1 to −200 and +1 to +200 for all tests N2, N8, N14, and N15. (a) n = 5; (b) n = 10; (c) n = 15; and (d) n = 20.
Figure 11
Figure 11
Test Performance Criterion (π DC, or Conditional Power P5) as a function of δ from −20 to +20 for all tests N2, N8, N14, and N15. (a) n = 5; (b) n = 10; (c) n = 15; and (d) n = 20.
Figure 12
Figure 12
Test Performance Criterion (π DC, or Conditional Power P5) as a function of ε from −1 to −200 and +1 to +200 for all tests N2, N8, N14, and N15. (a) n = 5; (b) n = 10; (c) n = 15; and (d) n = 20.

Similar articles

Cited by

References

    1. Barnett V, Lewis T. Outliers in Statistical Data. 3rd edition. Chichester, UK: John Wiley & Sons; 1994.
    1. Dixon WJ. Analysis of extreme values. Annals of Mathematical Statistics. 1950;21(4):488–506.
    1. Ferguson TS. Rules for rejection of outliers. Revue de l'Institut International de Statistique. 1961;29(3):29–43.
    1. Shapiro SS, Wilk MB, Chen HJ. A comparative study of various tests for normality. Journal of American Statistical Association. 1968;63(324):1343–1371.
    1. Hawkins DM. Analysis of three tests for one or two outliers. Statistica Nederlandica. 1978;32(3):137–148.

Publication types

LinkOut - more resources