. 2014:2014:963032.
doi: 10.1155/2014/963032. Epub 2014 Mar 12.

Automatic detection and quantification of acute cerebral infarct by fuzzy clustering and histographic characterization on diffusion weighted MR imaging and apparent diffusion coefficient map

Affiliations

Automatic detection and quantification of acute cerebral infarct by fuzzy clustering and histographic characterization on diffusion weighted MR imaging and apparent diffusion coefficient map

Jang-Zern Tsai et al. Biomed Res Int. 2014.

Abstract

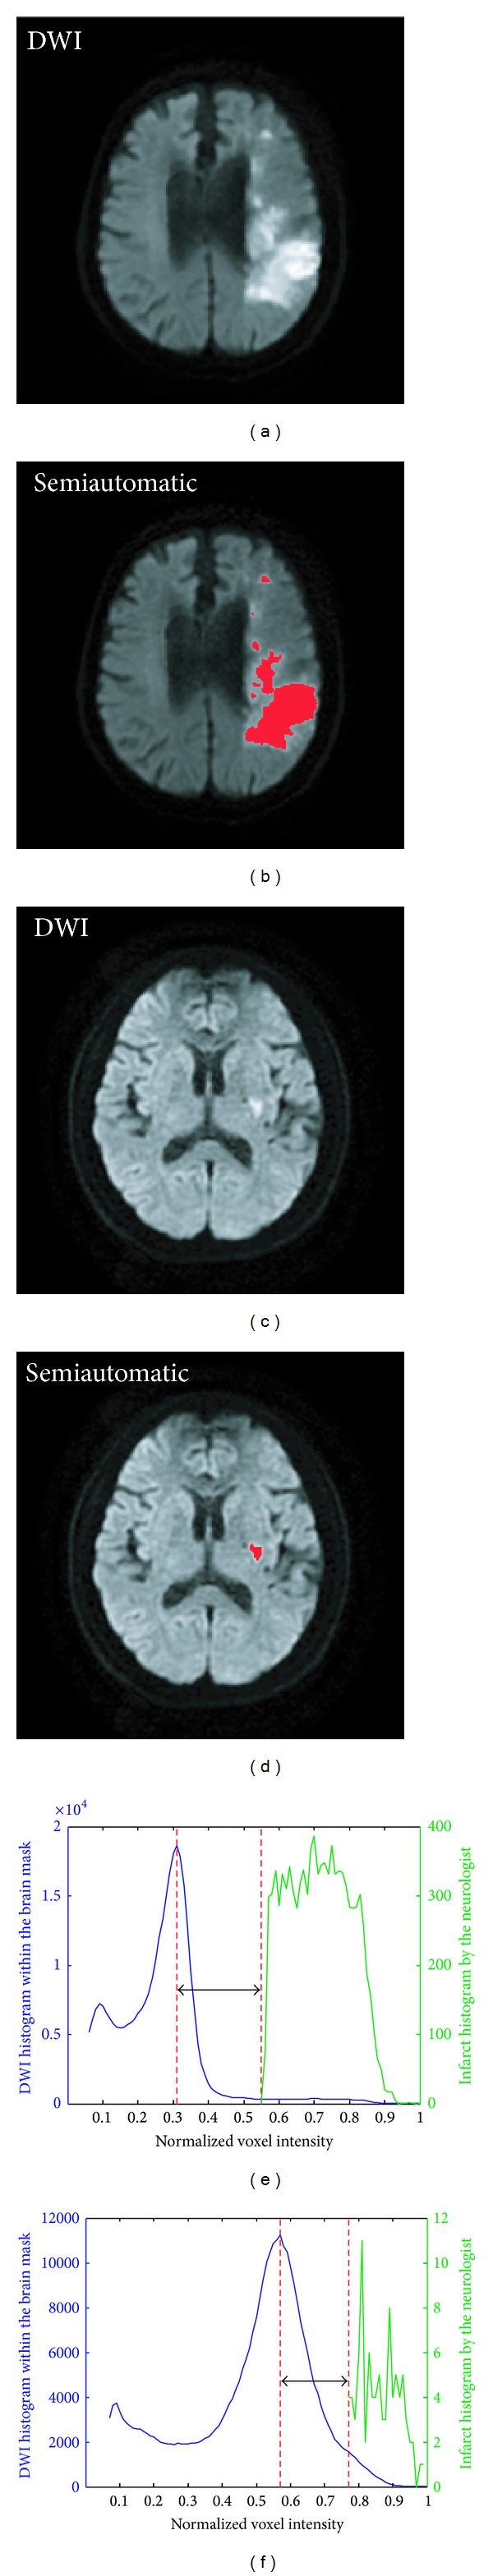
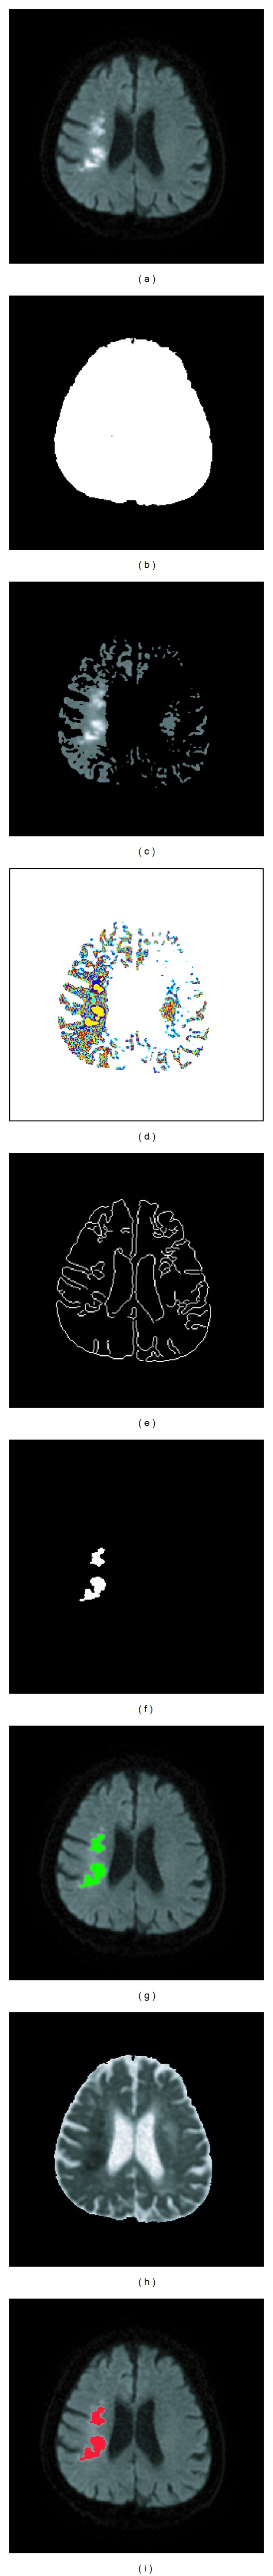
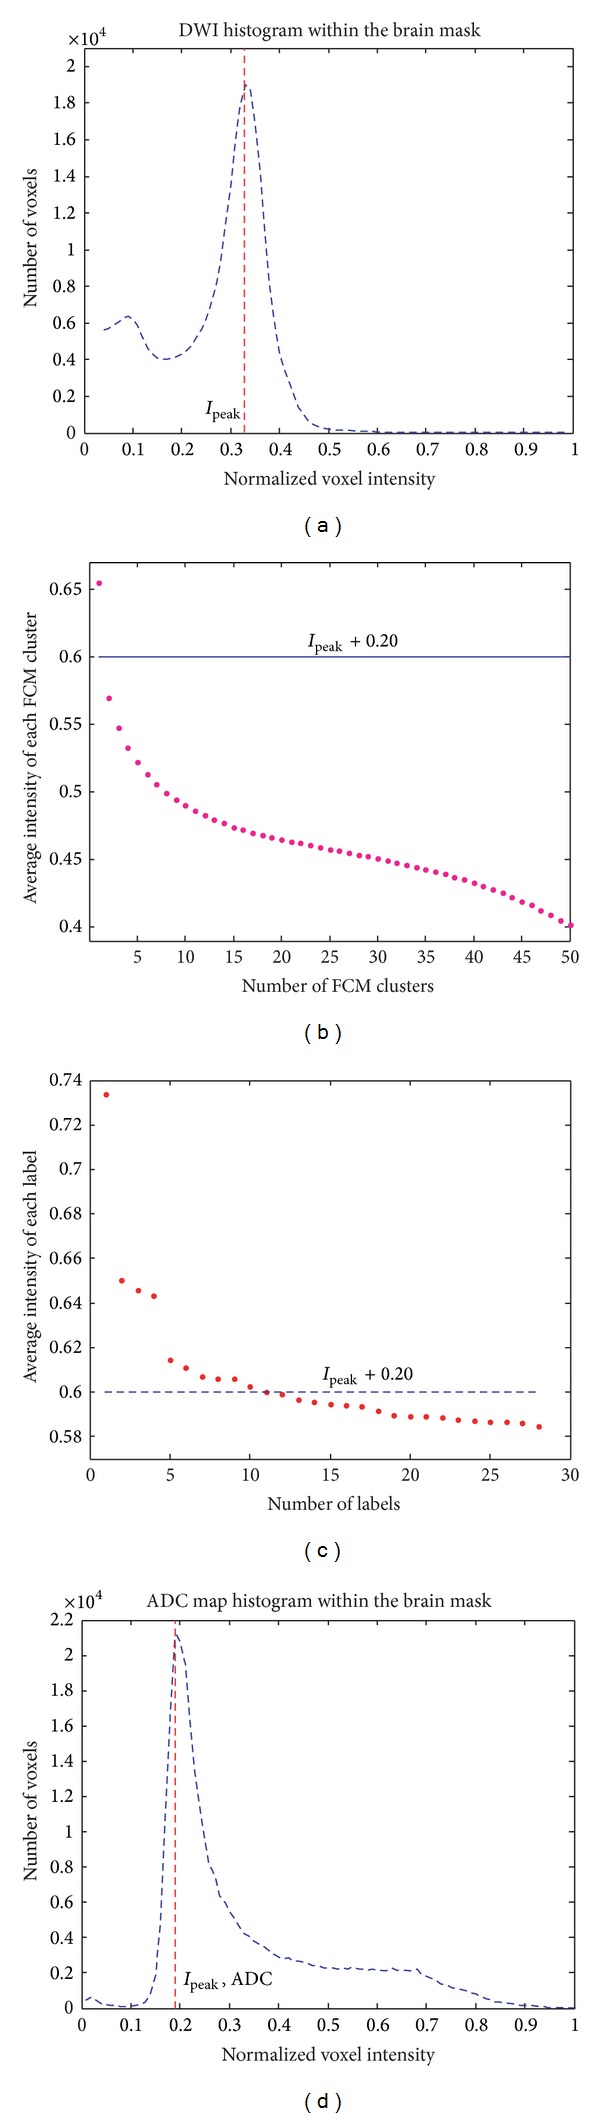
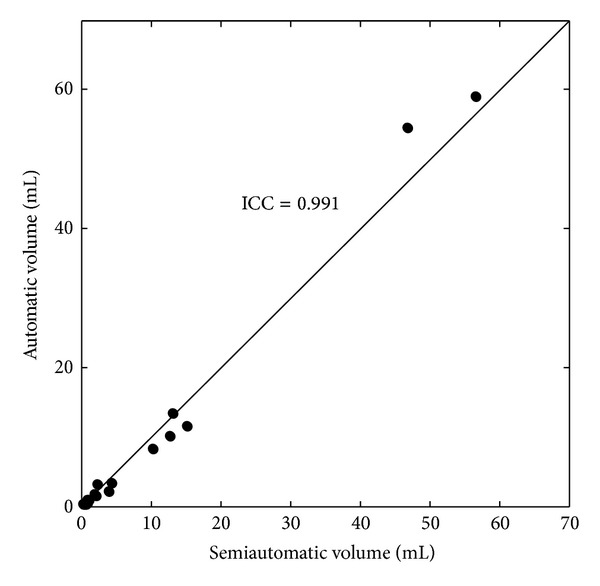
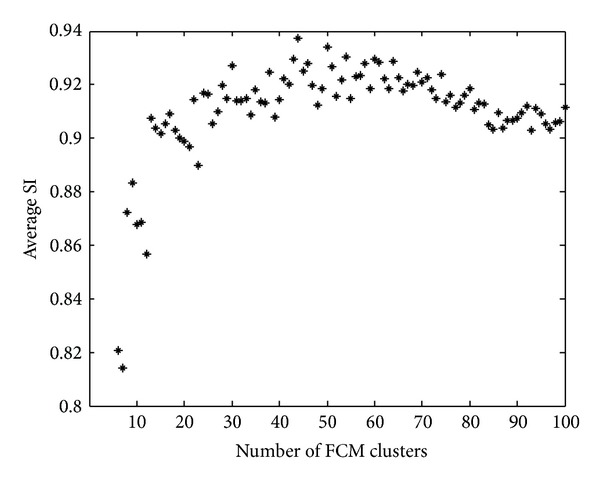
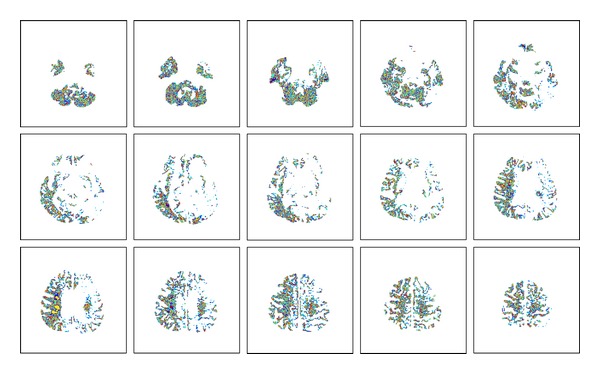
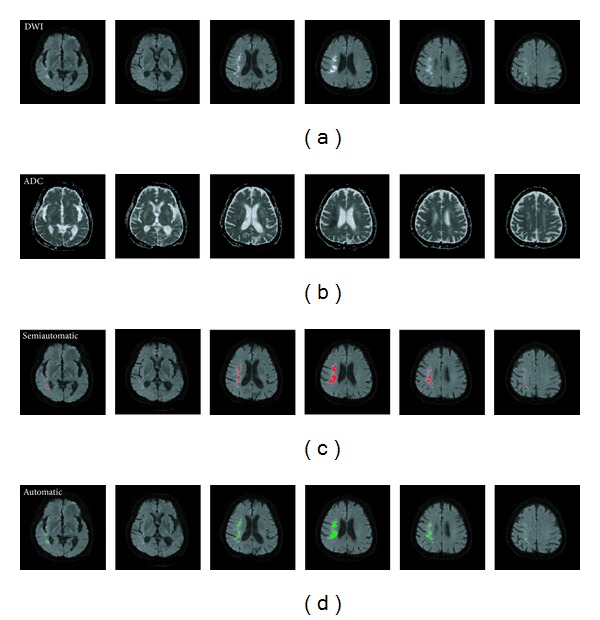
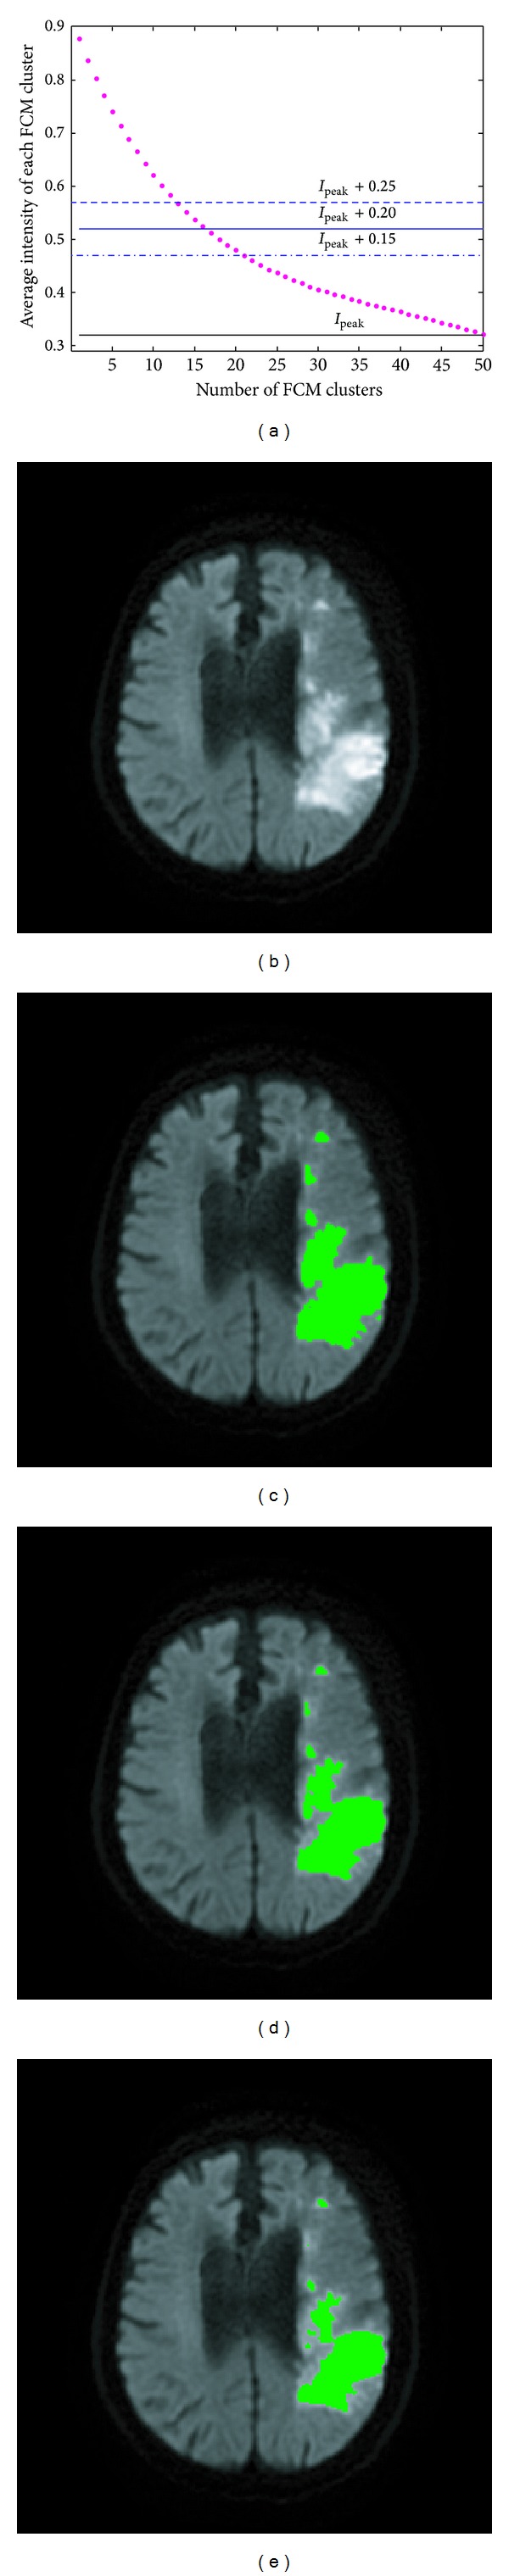
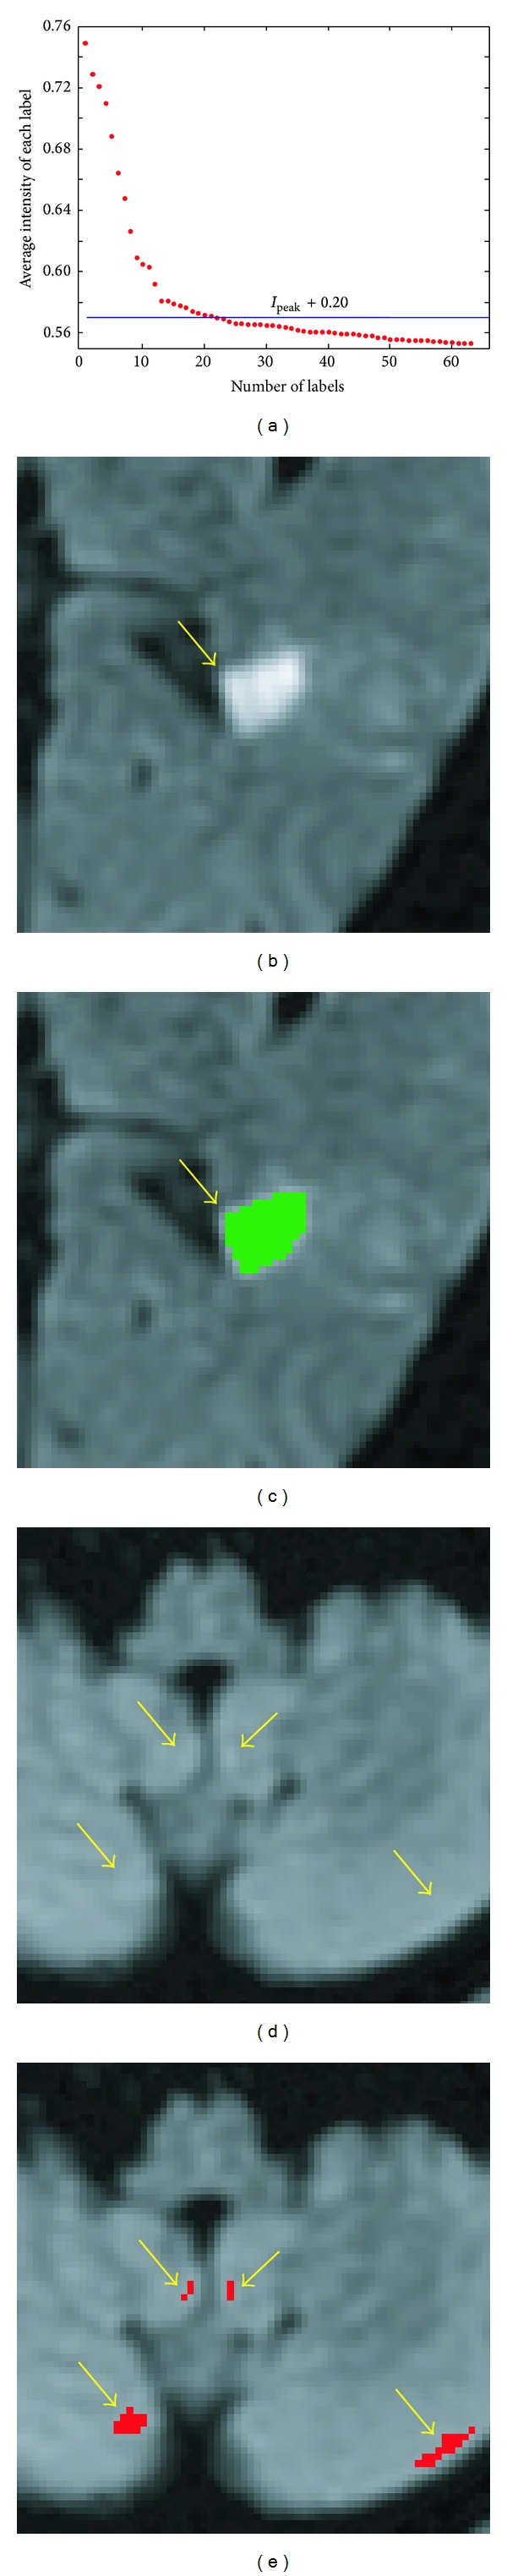
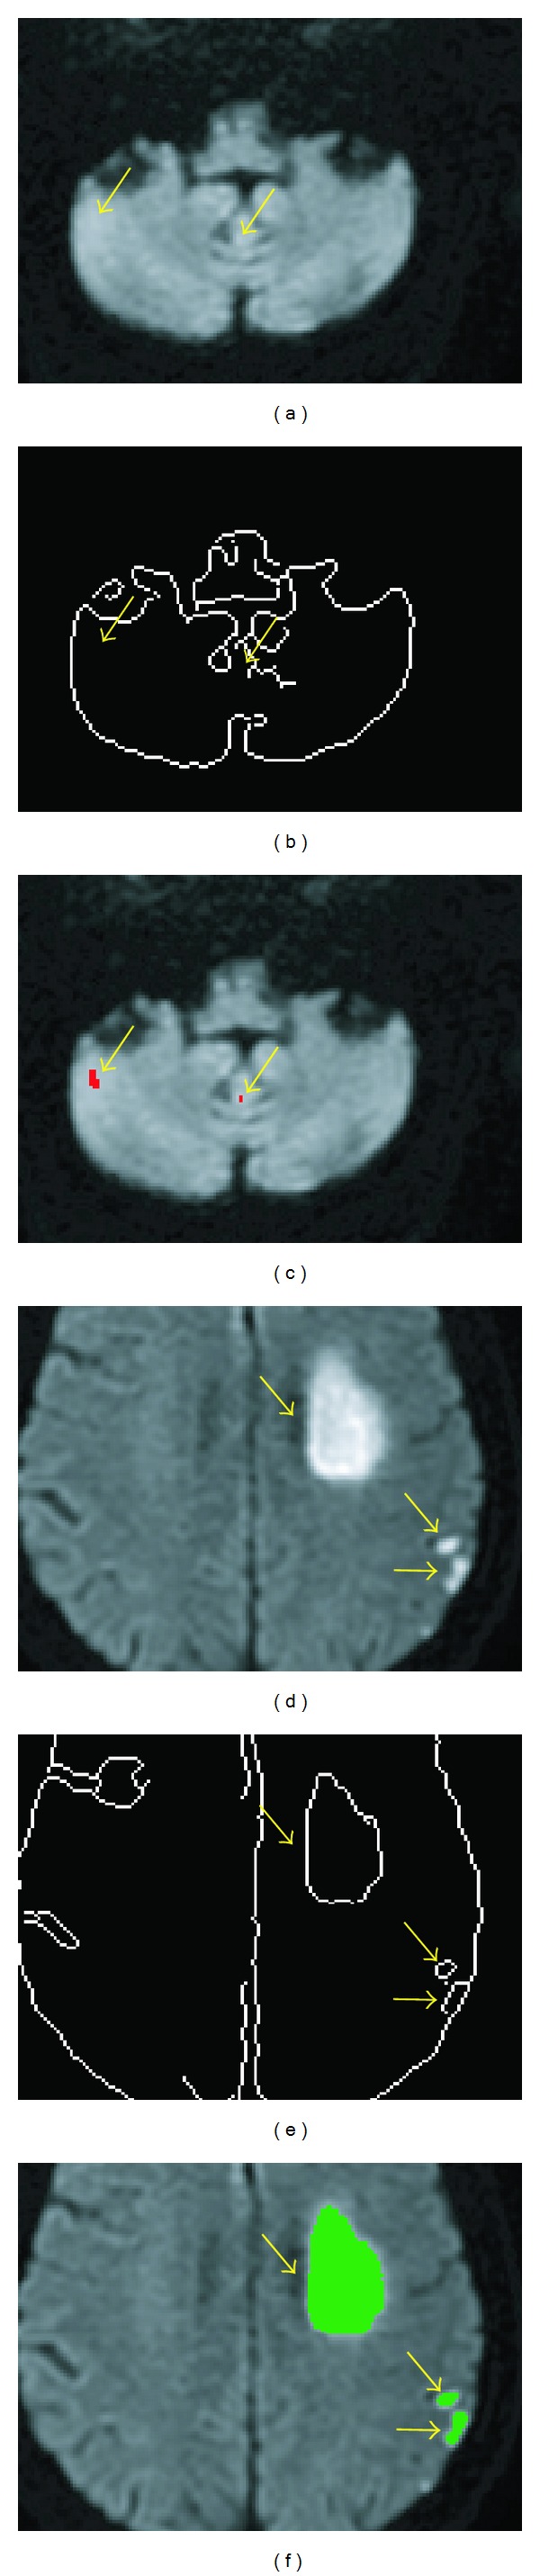
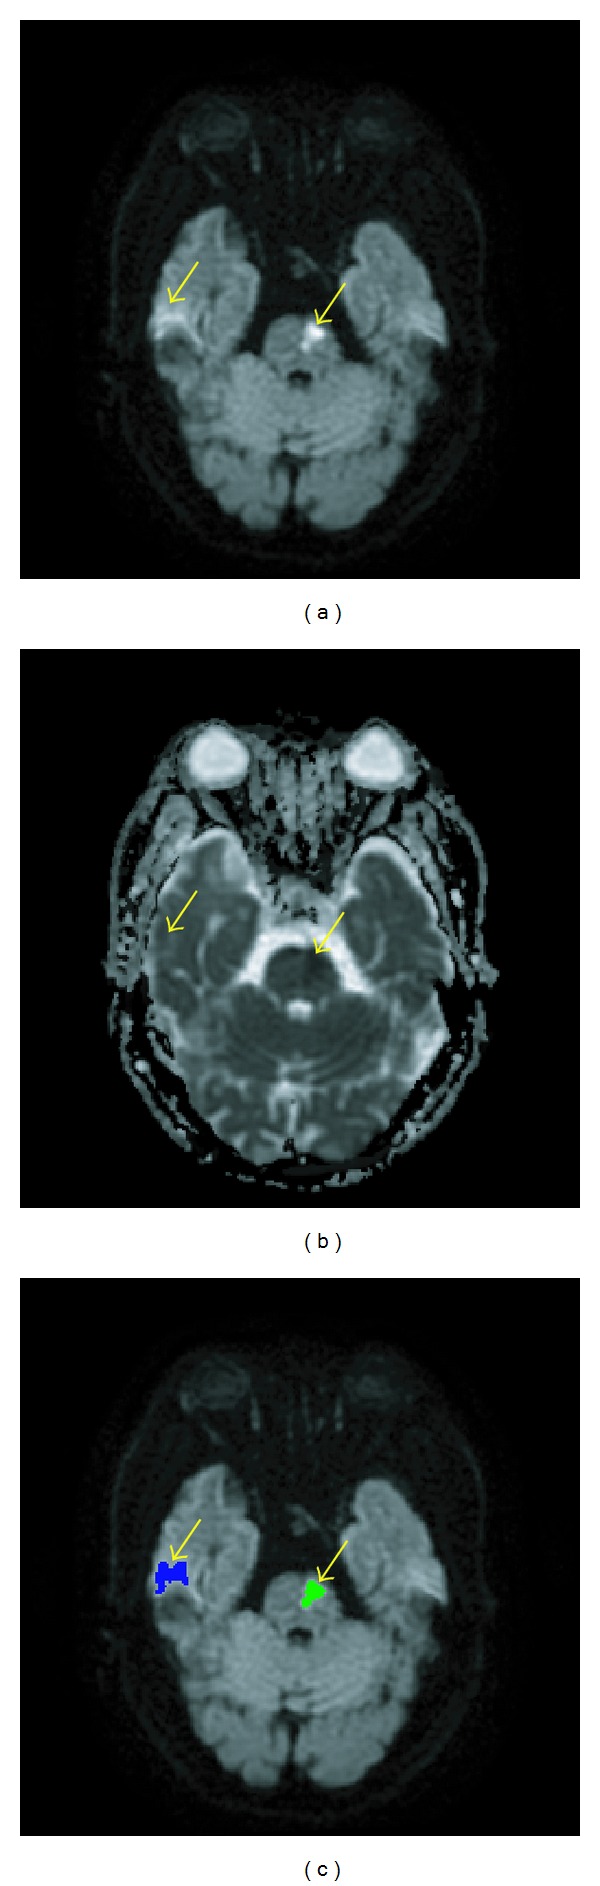
Determination of the volumes of acute cerebral infarct in the magnetic resonance imaging harbors prognostic values. However, semiautomatic method of segmentation is time-consuming and with high interrater variability. Using diffusion weighted imaging and apparent diffusion coefficient map from patients with acute infarction in 10 days, we aimed to develop a fully automatic algorithm to measure infarct volume. It includes an unsupervised classification with fuzzy C-means clustering determination of the histographic distribution, defining self-adjusted intensity thresholds. The proposed method attained high agreement with the semiautomatic method, with similarity index 89.9 ± 6.5%, in detecting cerebral infarct lesions from 22 acute stroke patients. We demonstrated the accuracy of the proposed computer-assisted prompt segmentation method, which appeared promising to replace the laborious, time-consuming, and operator-dependent semiautomatic segmentation.


Figures

Figure 1
Figure 1
The histographic characteristics of the raw DWI and the infarct. (a) The raw DWI of patient number 20. (b) The semiautomatically demarcated infarcts, printed in red, of patient number 20. The infarct volume = 46.828 mL. The lower bound of the infarcts = I peak + 0.24. (c) The raw DWI of patient number 3. (d) The semiautomatically demarcated infarcts, printed in red, of patient number 3. The infarct volume = 0.399 mL. The lower bound of the infarcts = I peak + 0.21. (e) The histogram of the normalized voxel intensity within the brain mask of the whole-brain DWI and the intensity distribution of the semiautomatically demarcated infarcts of patient number 20. (f) The histogram of the normalized voxel intensity within the brain mask of the whole-brain DWI and the intensity distribution of the semiautomatically demarcated infarcts of patient number 3.
Figure 2
Figure 2
Illustrating the procedure of the proposed method with exemplary images. (a) The raw DWI. (b) The brain mask. (c) The region-of-interest map derived after the preclustering elimination in Step 3. (d) The FCM cluster map for the 50 clusters in Step 4. (e) Canny edge detection map. (f) The computer-assisted infarct segmentation result. (g) The detected infarct was mapped to raw DWI. (h) The ADC map. (i) The semiautomatically demarcated infarct regions by the experienced neurologist.
Figure 3
Figure 3
(a) The histogram of the normalized voxel intensity within the brain mask of a whole-brain DWI. (b) The average normalized intensities of the 50 clusters created in Step 4. (c) The average normalized intensities of the labels from the clusters of candidate voxels of infarct in Step 5. (d) The histogram of the normalized voxel intensity within the brain mask of an ADC map.
Figure 4
Figure 4
Automatically segmented versus semiautomatically segmented infarct volumes.
Figure 5
Figure 5
The result of the preliminary experiment to determine the FCM cluster number. Each of the average SI values was the average SI of the semiprocedure of the proposed method conducted on the 22 patients.
Figure 6
Figure 6
Different colors represent the voxels of the 50 different clusters in a whole-brain DWI of patient number 9 in Step 4.
Figure 7
Figure 7
Illustrating the input and output images of the proposed algorithm using patient number 9 as an example. This figure shows 6 of the 23 slices of the whole-brain MRIs of patient 9. (a) Six axial slices of DWI. (b) Six axial slices of ADC map. (c) Infarct regions, painted red, semiautomatically demarcated by the neurologist. (d) Infarct regions, painted green, detected automatically by the proposed algorithm.
Figure 8
Figure 8
The effect of threshold variation of clusters skimming in Step 5. (a) Each red dot represents the average normalized intensity of an individual cluster among the 50 output clusters of the FCM clustering. (b) The raw DWI. (c) The detected infarct lesions with skimming from I peak + 0.15. (d) The detected infarct lesions with skimming from I peak + 0.2. (e) The detected infarct lesions with skimming from I peak + 0.25. The SI values of the three cases were 88.4%, 93.3%, and 99.2%, whereas the sensitivities were 100.0%, 99.9%, and 98.4%, respectively.
Figure 9
Figure 9
In Step 6, labels in the skimmed cluster(s) would be eliminated if their individual average normalized intensities were lower than or equal to the threshold level, namely, I peak + 0.2. (a) The red dots represent the average normalized intensities of the labels in the cluster(s) that had been skimmed in Step 5. The blue line indicates the threshold level in this step. (b) A typical label, pointed to by the arrow, with its average normalized intensity higher than the threshold level would appear white possibly with a faint suburb. (c) Such a label, painted green, was classified as an infarct region. (d) The arrows point to labels with individual average normalized intensities lower than the threshold level. They appeared faint all over. (e) Such labels, painted red, were classified as noninfarct regions.
Figure 10
Figure 10
In Step 7, labels selected in Step 6 would be eliminated if their edges were weak. (a)-(b) The labels pointed to by the arrows were all labels that had been selected in Step 6 for further processing. (c) In the Canny edge detection map, the arrow-pointed-to labels in (a) did not have corresponding edges because their edges were weak. (d) In the Canny edge detection map, the arrow-pointed-to labels in (b) had corresponding edges because their edges were not weak. (e) The arrow-pointed-to labels in (b) were classified as noninfarct regions, painted red. (f) The arrow-pointed-to labels in (b) were classified as infarct regions, painted green.
Figure 11
Figure 11
In Step 8, candidate labels due to magnetic inhomogeneity were eliminated. (a) In this example, the two labels pointed by arrows had intensities higher than I peak + 0.2 and appeared equally bright in the DWI. (b) The two labels had different intensities in the ADC map. (c) The artifact (blue) was differentiated from the infarct (green) in Step 8.

References

    1. Smith SC., Jr. Reducing the global burden of ischemic heart disease and stroke: a challenge for the cardiovascular community and the United Nations. Circulation. 2011;124(3):278–279. - PubMed
    1. Vogt G, Laage R, Shuaib A, Schneider A. Initial lesion volume is an independent predictor of clinical stroke outcome at day 90: an analysis of the Virtual International Stroke Trials Archive (VISTA) database. Stroke. 2012;43(5):1266–1272. - PubMed
    1. Zaidi SF, Aghaebrahim A, Urra X, Jumaa MA, Jankowitz B, Hammer M. Final infarct volume is a stronger predictor of outcome than recanalization in patients with proximal middle cerebral artery occlusion treated with endovascular therapy. Stroke. 2012;43(12):3238–3244. - PubMed
    1. Rangaraju S, Owada K, Noorian AR, Nogueira RG, Nahab F, Glenn BA. Comparison of final infarct volumes in patients who received endovascular therapy or intravenous thrombolysis for acute intracranial large-vessel occlusions. Journal of the American Medical Association. 2013;70(7):831–836. - PubMed
    1. Al-Khaled M, Matthis C, Munte TF, Eggers J. QugSS2-Study. The incidence and clinical predictors of acute infarction in patients with transient ischemic attack using MRI including DWI. Neuroradiology. 2013;55(2):157–163. - PubMed

Publication types