. 2014 Apr 15;106(8):1780-91.
doi: 10.1016/j.bpj.2014.01.048.

A general functional response of cytotoxic T lymphocyte-mediated killing of target cells

Affiliations

A general functional response of cytotoxic T lymphocyte-mediated killing of target cells

Saikrishna Gadhamsetty et al. Biophys J. .

Abstract

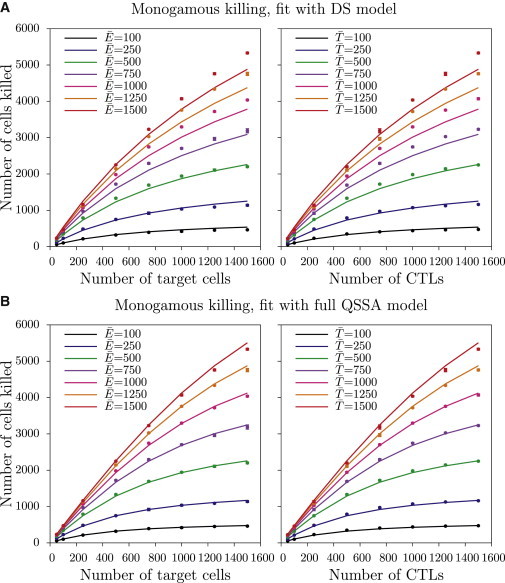
Cytotoxic T lymphocytes (CTLs) kill virus-infected cells and tumor cells, and play a critical role in immune protection. Our knowledge of how the CTL killing efficiency varies with CTL and target cell numbers is limited. Here, we simulate a region of lymphoid tissue using a cellular Potts model to characterize the functional response of CTL killing of target cells, and find that the total killing rate saturates both with the CTL and the target cell densities. The relative saturation in CTL and target cell densities is determined by whether a CTL can kill multiple target cells at the same time, and whether a target cell can be killed by many CTLs together. We find that all the studied regimes can be well described by a double-saturation (DS) function with two different saturation constants. We show that this DS model can be mechanistically derived for the cases where target cells are killed by a single CTL. For the other cases, a biological interpretation of the parameters is still possible. Our results imply that this DS function can be used as a tool to predict the cellular interactions in cytotoxicity data.


Figures

Figure 1
Figure 1
Illustration of the model. (A) Killing regimes. (B) Snapshot of a two-dimensional simulation. (C) Magnified view of a region of the field. (Green) CTLs; (red) target cells; (gray) reticular network. (Blue) Nonspecific target cells and CTLs. Snapshots shown in panels B and C are from simulations in the absence of killing with E¯ = 500 cells and T¯ = 500 cells. To see this figure in color, go online.
Figure 2
Figure 2
The total number of synapses with target cells (A) and the number of cells killed (B) over 5-min intervals during simulations with E¯ = 750 cells and T¯ = 750 cells for the four killing regimes. (Solid lines) Average from six independent simulations; (shaded regions) standard deviations over these six observations. The dynamics of conjugates and cells killed during the initialization period are not shown (i.e., time t = 0 denotes the time point after this initialization. The dynamics of conjugates and cells killed does not exhibit any correlation with time (Spearman’s correlation |ρS| < 0.09, P > 0.23). To see this figure in color, go online.
Figure 3
Figure 3
Number of target cells killed for monogamous killing. The total number of cells killed over 75 min of simulation as a function of target cell (left panels) and CTL (right panels) densities for the monogamous killing regime. (Markers) Mean of the total number of cells killed over six independent runs. (Error bars) Standard deviation. (Solid lines) Predictions obtained by fitting the DS model (A) and the full QSSA (B) with the best-fit parameters. Parameter estimates: k = 1.808 × 10−4 cells−1 min−1 and h = 571 cells for the DS model, and k = 8.113 × 10−2 cells−1 min−1 and h = 391 cells for the full QSSA model. To see this figure in color, go online.
Figure 4
Figure 4
The total number of cells killed over 75 min of simulation as a function of target cell (left panels) and CTL (right panels) densities for (A) joint and (B) simultaneous killing. (Markers) Mean of the total number of cells killed over six independent runs. (Error bars) Standard deviation. (Solid lines) Predictions of the DS model from Eq. 23 with best-fit parameters (see Table 3). To see this figure in color, go online.
Figure 5
Figure 5
The total number of cells killed over 75 min of simulation as a function of target cell (left panel) and CTL (right panel) densities for mixed killing. (Markers) Mean of the total number of cells killed over six independent runs. (Error bars) Standard deviation. (Solid lines) Predictions of the DS model from Eq. 23 with best-fit parameters (see Table 3). To see this figure in color, go online.

References

    1. Boissonnas A., Fetler L., Amigorena S. In vivo imaging of cytotoxic T cell infiltration and elimination of a solid tumor. J. Exp. Med. 2007;204:345–356. - PMC - PubMed
    1. Dougan M., Dranoff G. Immune therapy for cancer. Annu. Rev. Immunol. 2009;27:83–117. - PubMed
    1. Morgan R.A., Dudley M.E., Rosenberg S.A. Cancer regression in patients after transfer of genetically engineered lymphocytes. Science. 2006;314:126–129. - PMC - PubMed
    1. Rosenberg S.A., Packard B.S., White D.E. Use of tumor-infiltrating lymphocytes and interleukin-2 in the immunotherapy of patients with metastatic melanoma. A preliminary report. N. Engl. J. Med. 1988;319:1676–1680. - PubMed
    1. Budhu S., Loike J.D., Silverstein S.C. CD8+ T cell concentration determines their efficiency in killing cognate antigen-expressing syngeneic mammalian cells in vitro and in mouse tissues. J. Exp. Med. 2010;207:223–235. - PMC - PubMed

Publication types