. 2014 Apr 17:14:99.
doi: 10.1186/1471-2229-14-99.

A deep survey of alternative splicing in grape reveals changes in the splicing machinery related to tissue, stress condition and genotype

Affiliations

A deep survey of alternative splicing in grape reveals changes in the splicing machinery related to tissue, stress condition and genotype

Nicola Vitulo et al. BMC Plant Biol. .

Abstract

Background: Alternative splicing (AS) significantly enhances transcriptome complexity. It is differentially regulated in a wide variety of cell types and plays a role in several cellular processes. Here we describe a detailed survey of alternative splicing in grape based on 124 SOLiD RNAseq analyses from different tissues, stress conditions and genotypes.

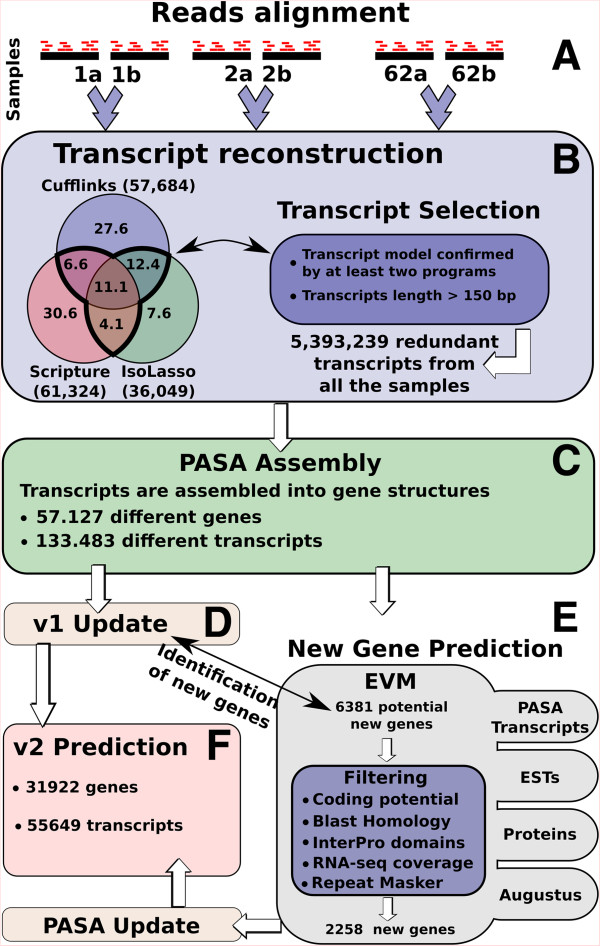
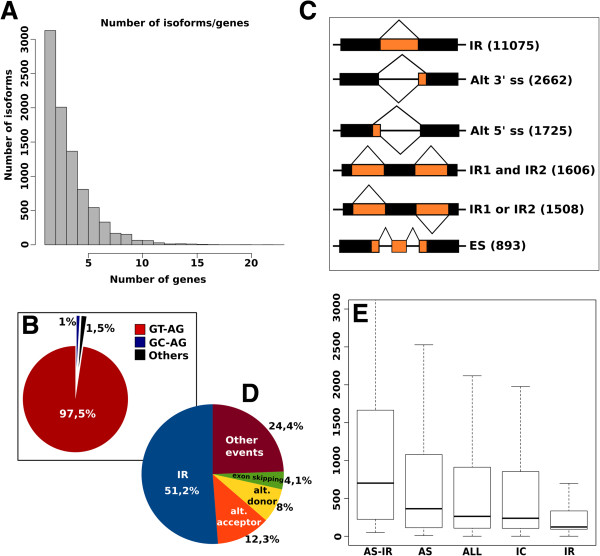
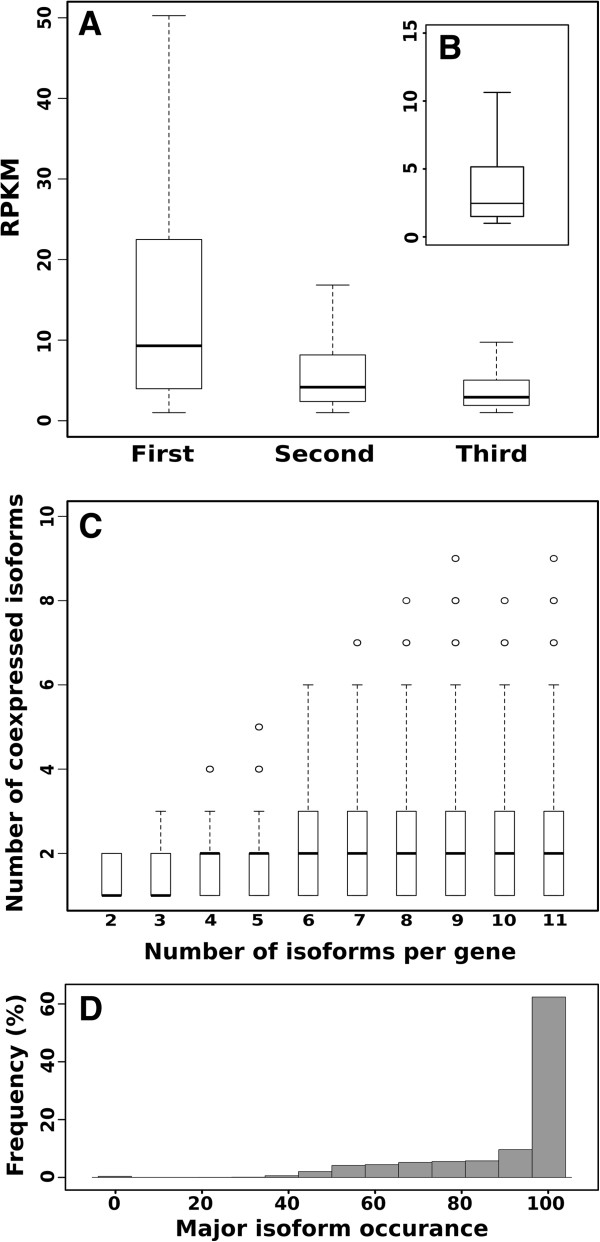
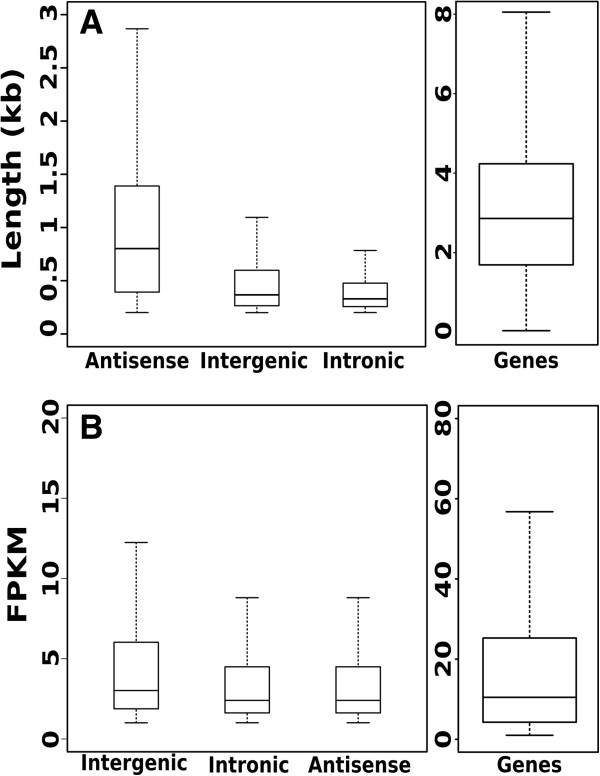
Results: We used the RNAseq data to update the existing grape gene prediction with 2,258 new coding genes and 3,336 putative long non-coding RNAs. Several gene structures have been improved and alternative splicing was described for about 30% of the genes. A link between AS and miRNAs was shown in 139 genes where we found that AS affects the miRNA target site. A quantitative analysis of the isoforms indicated that most of the spliced genes have one major isoform and tend to simultaneously co-express a low number of isoforms, typically two, with intron retention being the most frequent alternative splicing event.

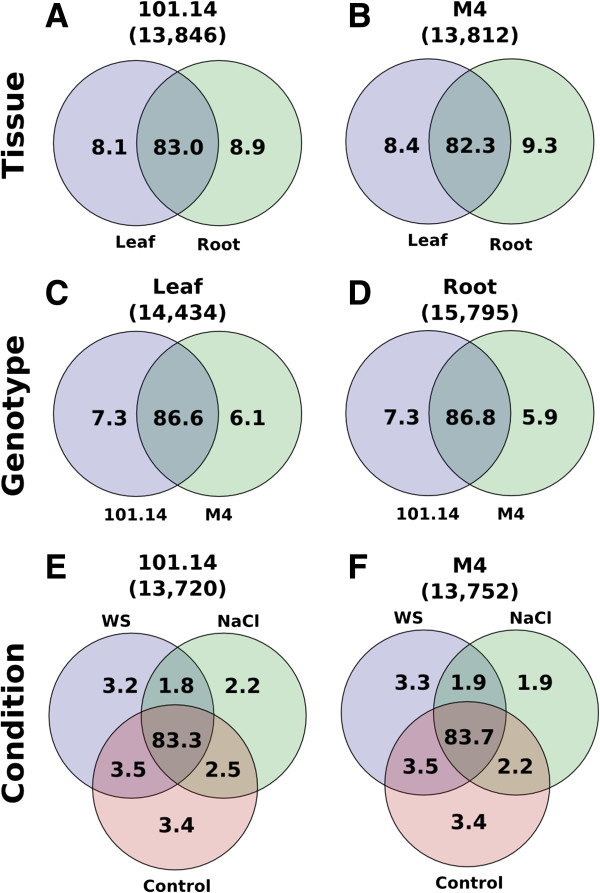
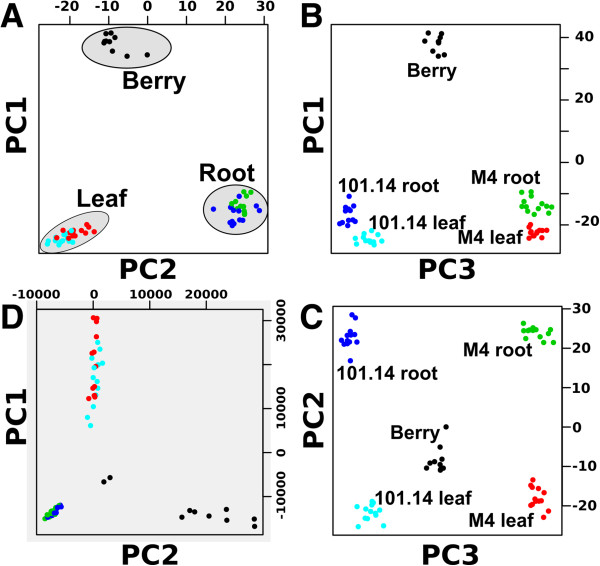
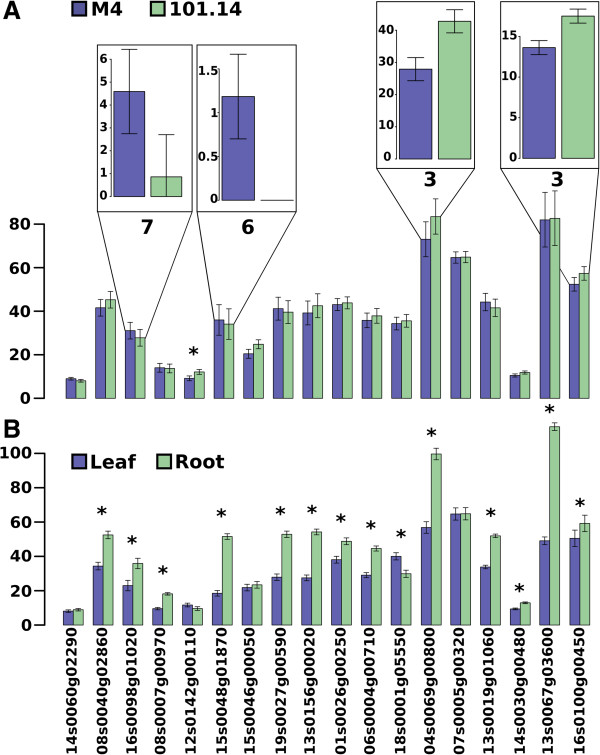
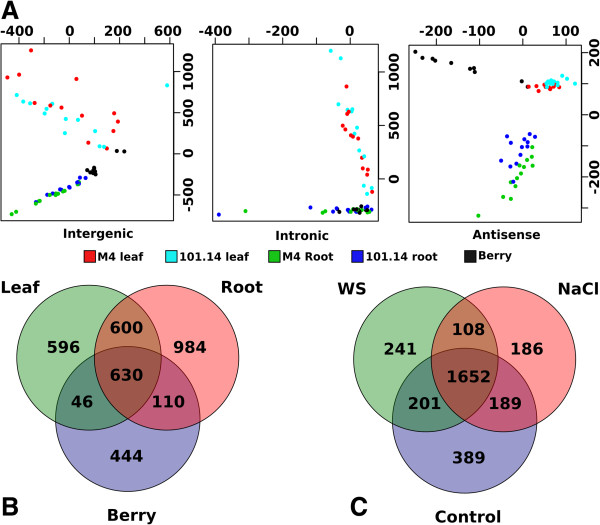
Conclusions: As described in Arabidopsis, also grape displays a marked AS tissue-specificity, while stress conditions produce splicing changes to a minor extent. Surprisingly, some distinctive splicing features were also observed between genotypes. This was further supported by the observation that the panel of Serine/Arginine-rich splicing factors show a few, but very marked differences between genotypes. The finding that a part the splicing machinery can change in closely related organisms can lead to some interesting hypotheses for evolutionary adaptation, that could be particularly relevant in the response to sudden and strong selective pressures.


Figures

Figure 1
Figure 1
Gene prediction workflow. (A) RNAseq samples are aligned on the reference genome. (B) Biological replicate alignments are merged together into 64 different datasets. Transcript reconstruction was performed independently on each dataset using three different programs: Cufflinks, Scripture and Isolasso. The Venn diagram shows the percentage of reconstructed transcripts in common among the three software while the numbers between brackets indicates the average number of reconstructed transcripts per sample. We selected only those transcript models predicted by at least two programs and with a length higher than 150 bases. (C) The selected transcripts were assembled using PASA software. (D) PASA assemblies were used to update v1 gene predictions. (E) A new gene prediction was performed integrating with EvidenceModeler (EVM) software different sources of evidence such as PASA transcripts, ESTs and proteins alignments and Augustus prediction trained with PASA assemblies. The produced gene set was compared to v1 gene prediction and only the new gene loci were selected for further analysis. After applying different filtering criteria, we obtained a final dataset of 2,258 new genes. (F) The final v2 gene prediction integrates genes generated by the steps described in D (v1 update) and E (new gene prediction).
Figure 2
Figure 2
Alternative splicing analysis. (A) Number of isoforms per gene distribution. (B) Donor and acceptor splicing site distributions. (C) Schematic representation of the most frequent splicing event identified in the v2 prediction: intron retention (IR), alternative 3' splicing site (Alt 3' ss), alternative 5' splicing site (Alt 5'), exon skipping (ES). The number of events is reported between brackets. (D) Pie chart showing the percentage distribution of alternative splicing events. (E) Intron size box plot distribution: all introns (ALL), constitutive introns (IC), alternatively spliced introns (ASI), introns that underwent intron retention events (IR), alternatively spliced introns without IR (AS-IR).
Figure 3
Figure 3
Isoforms shared between different tissues, genotypes and conditions. Venn diagrams showing the percentage of different isoforms that are shared comparing different tissues (A and B), genotypes (C and D) and environmental conditions (E and F).
Figure 4
Figure 4
Isoforms expression analysis. (A) FPKM value distribution of the first, second and third most abundant isoform within each sample. (B) Distribution of the ratio between expression values of the first and second most abundant isoforms. (C) Number of co-expressed isoforms compared to the number of isoforms per gene. (D) Frequency of the major isoform across the samples.
Figure 5
Figure 5
Isoforms expression principal component analysis. (A,B,C) Scatter plot of the first three principal component analysis of the expression values ratio between the first two highly expressed isoforms. (D) Scatter plot of the first two components of the expression values of the whole gene set. Each dot represents a sample: 101.14 leaf (cyan), 101.14 root (blue), M4 leaf (red), M4 root (green) and Berry (black).
Figure 6
Figure 6
Differential expression of splicing factor genes in different tissues and genotypes. Splicing factor average expression value (FPKM) grouping the samples according to genotype (A) or tissue (B). Boxes on panel A shows the expression levels of the variants that were significantly expressed between genotype. The number above each box represents the number of the isoform. Stars over the bar plots indicate the comparisons that resulted significantly different (t-test with a p-value < 0.05 after FDR correction).
Figure 7
Figure 7
Long non coding expression and size distribution. (A) Box-plot of the long non coding size distribution compared to the coding sequence length. (B) Box-plot of the long non-coding expression value distribution compared to the coding sequence expression.
Figure 8
Figure 8
Long non coding expression analysis. (A) Principal component analysis of the expression values of the three different categories of lnRNAs. (B) Venn diagrams showing the distribution of lnRNA among tissues (B) and stressed conditions (C).

References

    1. Jaillon O, Aury J-M, Noel B, Policriti A, Clepet C, Casagrande A, Choisne N, Aubourg S, Vitulo N, Jubin C, Vezzi A, Legeai F, Hugueney P, Dasilva C, Horner D, Mica E, Jublot D, Poulain J, Bruyère C, Billault A, Segurens B, Gouyvenoux M, Ugarte E, Cattonaro F, Anthouard V, Vico V, Del Fabbro C, Alaux M, Di Gaspero G, Dumas V. et al.The grapevine genome sequence suggests ancestral hexaploidization in major angiosperm phyla. Nature. 2007;449:463–467. doi: 10.1038/nature06148. - DOI - PubMed
    1. Velasco R, Zharkikh A, Troggio M, Cartwright DA, Cestaro A, Pruss D, Pindo M, Fitzgerald LM, Vezzulli S, Reid J, Malacarne G, Iliev D, Coppola G, Wardell B, Micheletti D, Macalma T, Facci M, Mitchell JT, Perazzolli M, Eldredge G, Gatto P, Oyzerski R, Moretto M, Gutin N, Stefanini M, Chen Y, Segala C, Davenport C, Demattè L, Mraz A. et al.A high quality draft consensus sequence of the genome of a heterozygous grapevine variety. PLoS One. 2007;2:e1326. doi: 10.1371/journal.pone.0001326. - DOI - PMC - PubMed
    1. Fasoli M, Dal Santo S, Zenoni S, Tornielli GB, Farina L, Zamboni A, Porceddu A, Venturini L, Bicego M, Murino V, Ferrarini A, Delledonne M, Pezzotti M. The grapevine expression atlas reveals a deep transcriptome shift driving the entire plant into a maturation program. Plant Cell. 2012;24:3489–3505. doi: 10.1105/tpc.112.100230. - DOI - PMC - PubMed
    1. Venturini L, Ferrarini A, Zenoni S, Tornielli GB, Fasoli M, Santo SD, Minio A, Buson G, Tononi P, Zago ED, Zamperin G, Bellin D, Pezzotti M, Delledonne M. De novo transcriptome characterization of Vitis vinifera cv. Corvina unveils varietal diversity. BMC Genomics. 2013;14:41. doi: 10.1186/1471-2164-14-41. - DOI - PMC - PubMed
    1. Zenoni S, Ferrarini A, Giacomelli E, Xumerle L, Fasoli M, Malerba G, Bellin D, Pezzotti M, Delledonne M. Characterization of transcriptional complexity during berry development in Vitis vinifera using RNA-seq. Plant Physiol. 2010;152:1787–1795. doi: 10.1104/pp.109.149716. - DOI - PMC - PubMed

Publication types

MeSH terms