. 2014 Jun 5;510(7503):167-71.
doi: 10.1038/nature13277. Epub 2014 Apr 13.

Oncogene-like induction of cellular invasion from centrosome amplification

Affiliations

Oncogene-like induction of cellular invasion from centrosome amplification

Susana A Godinho et al. Nature. .

Abstract

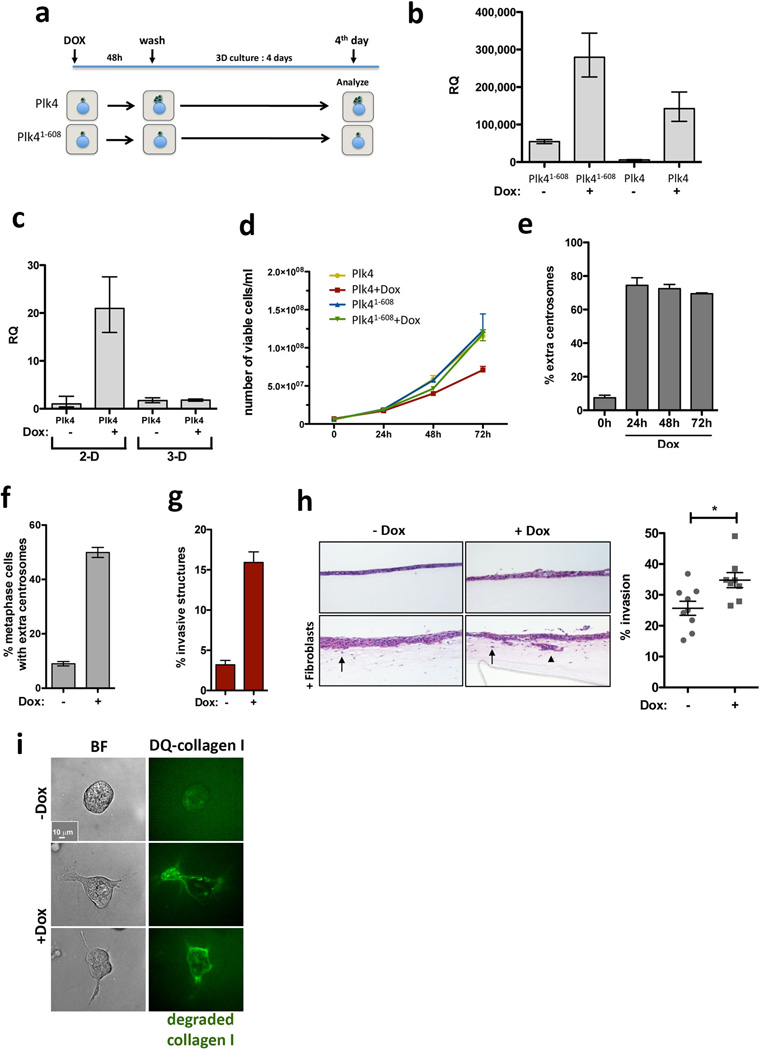
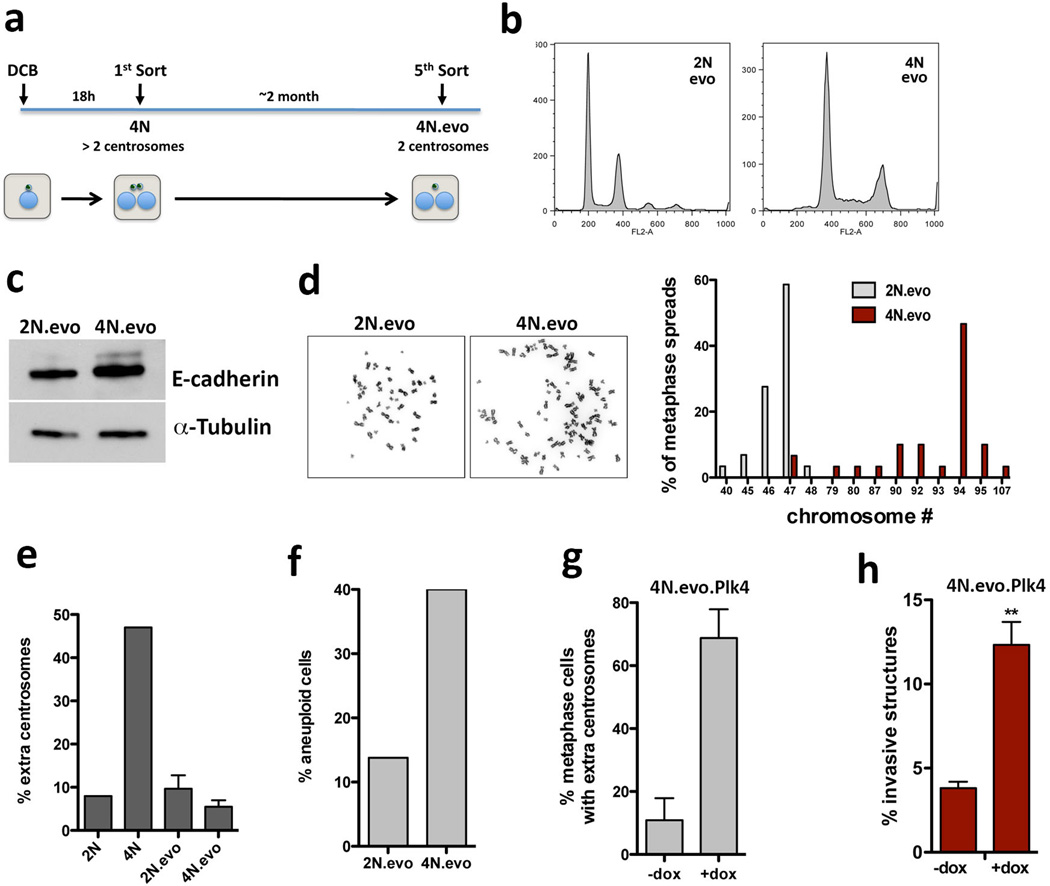
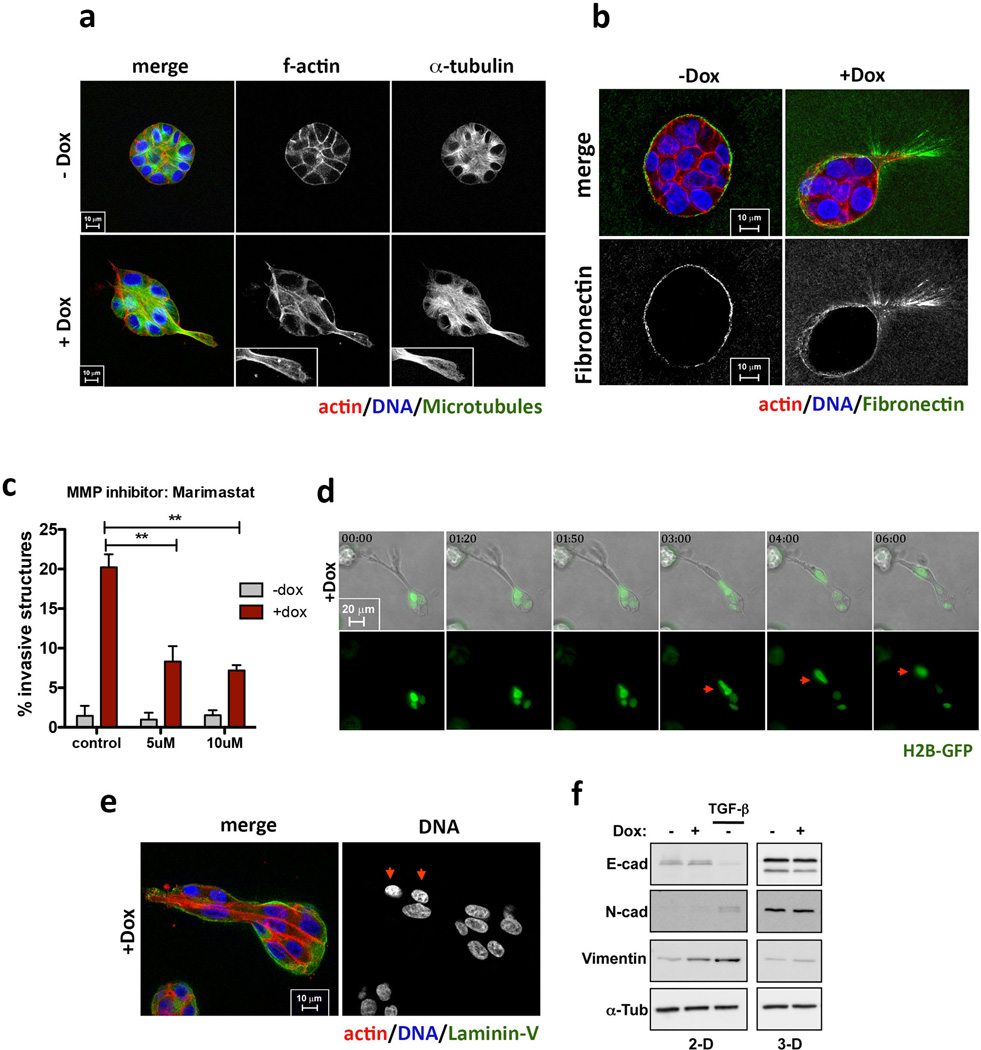
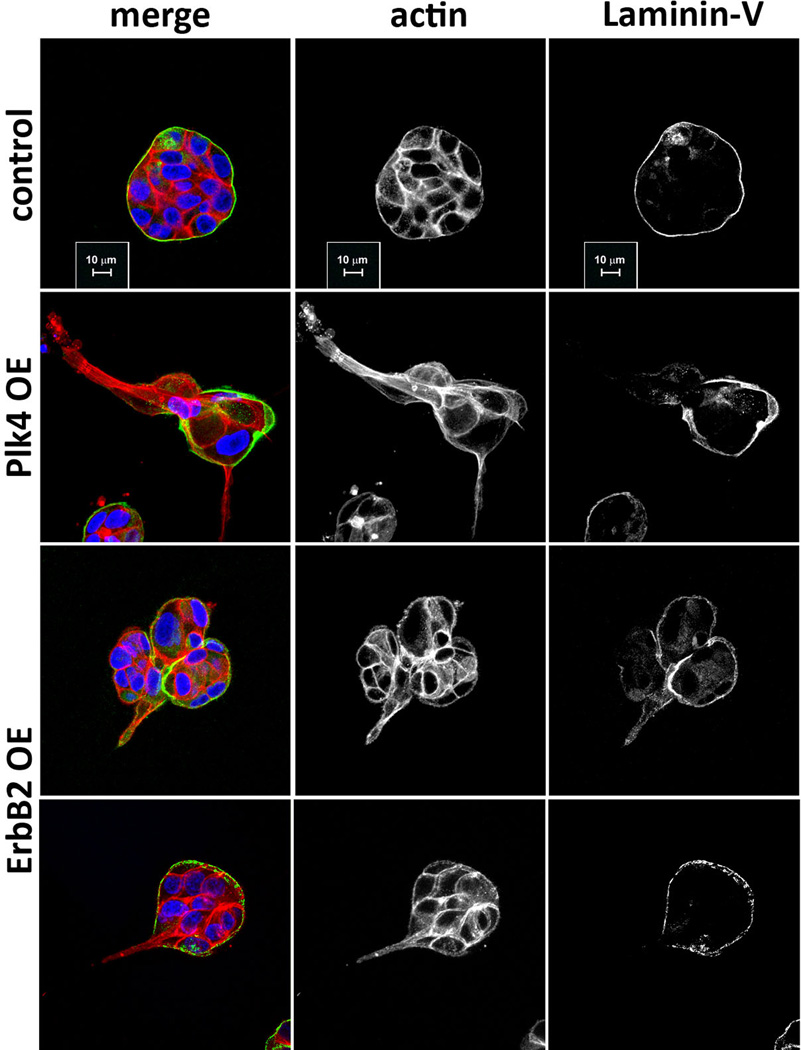
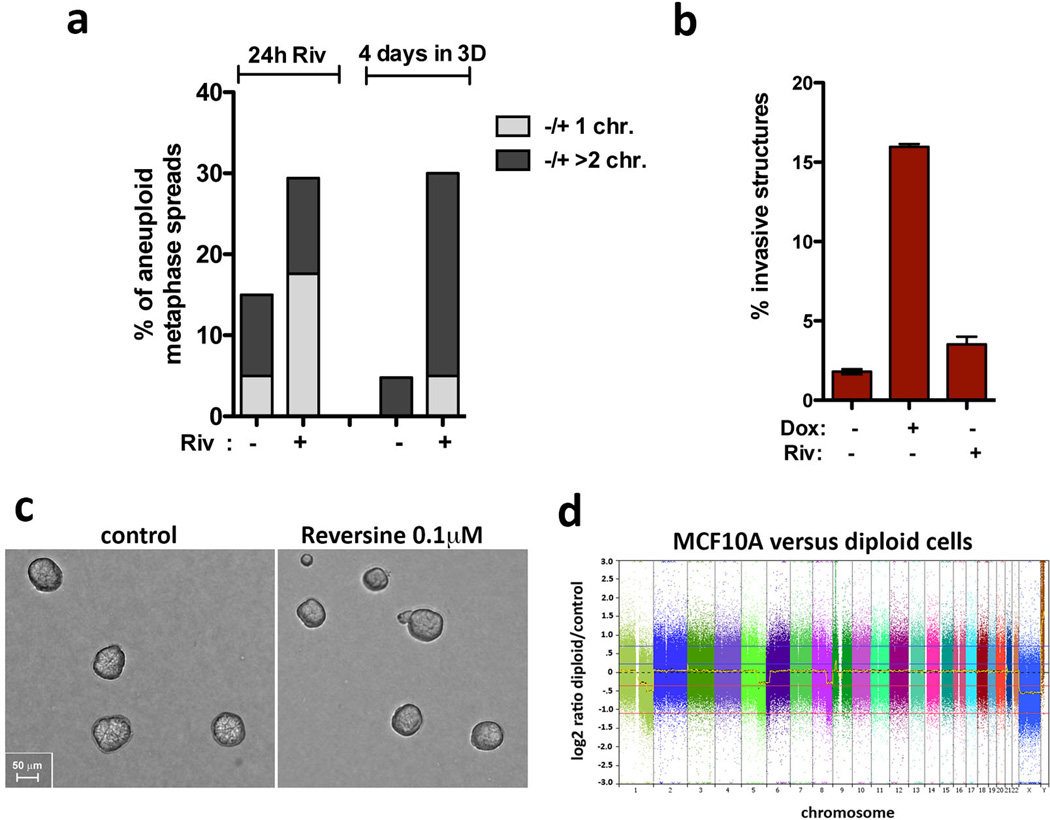
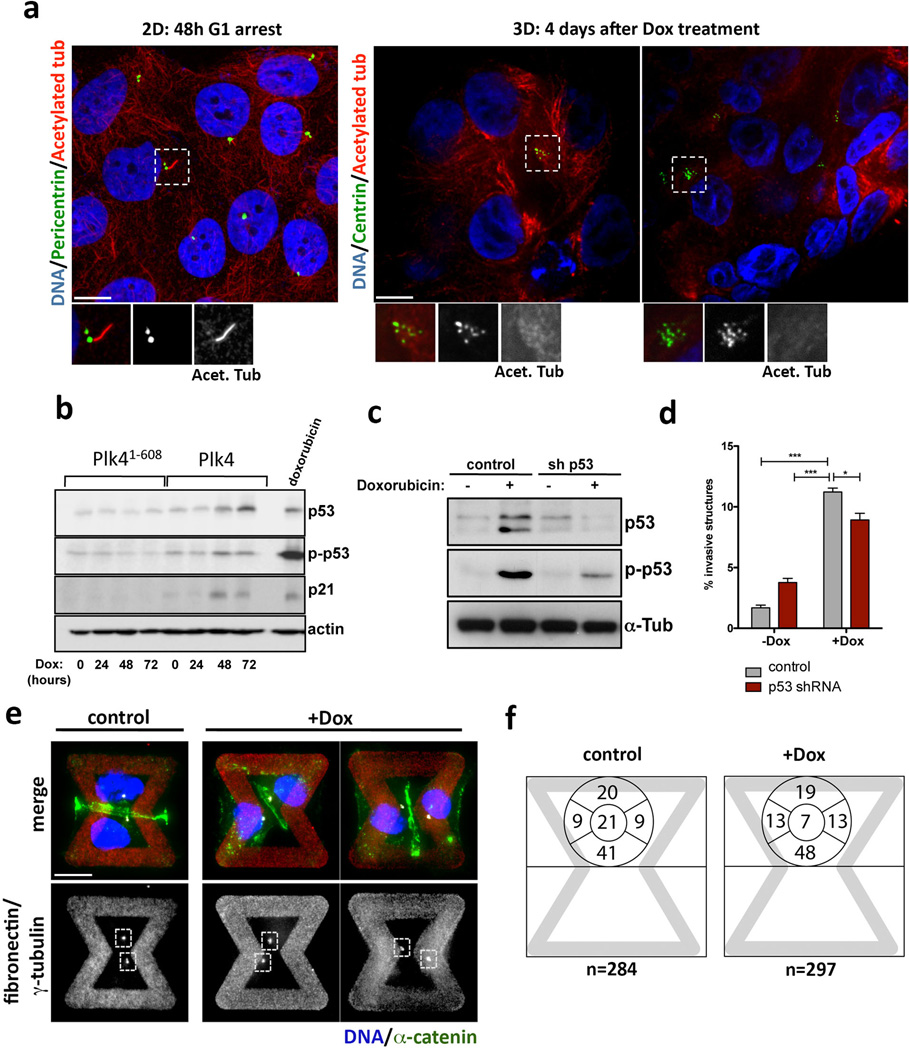
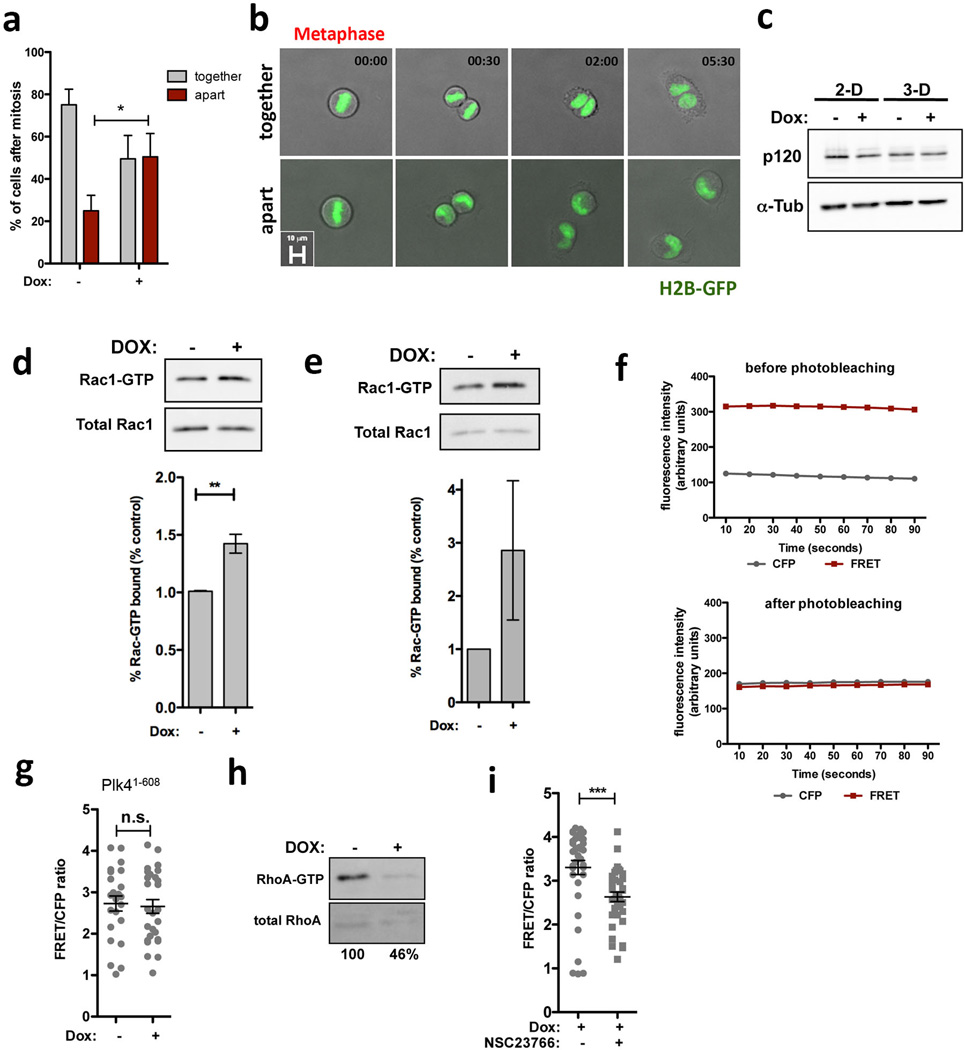
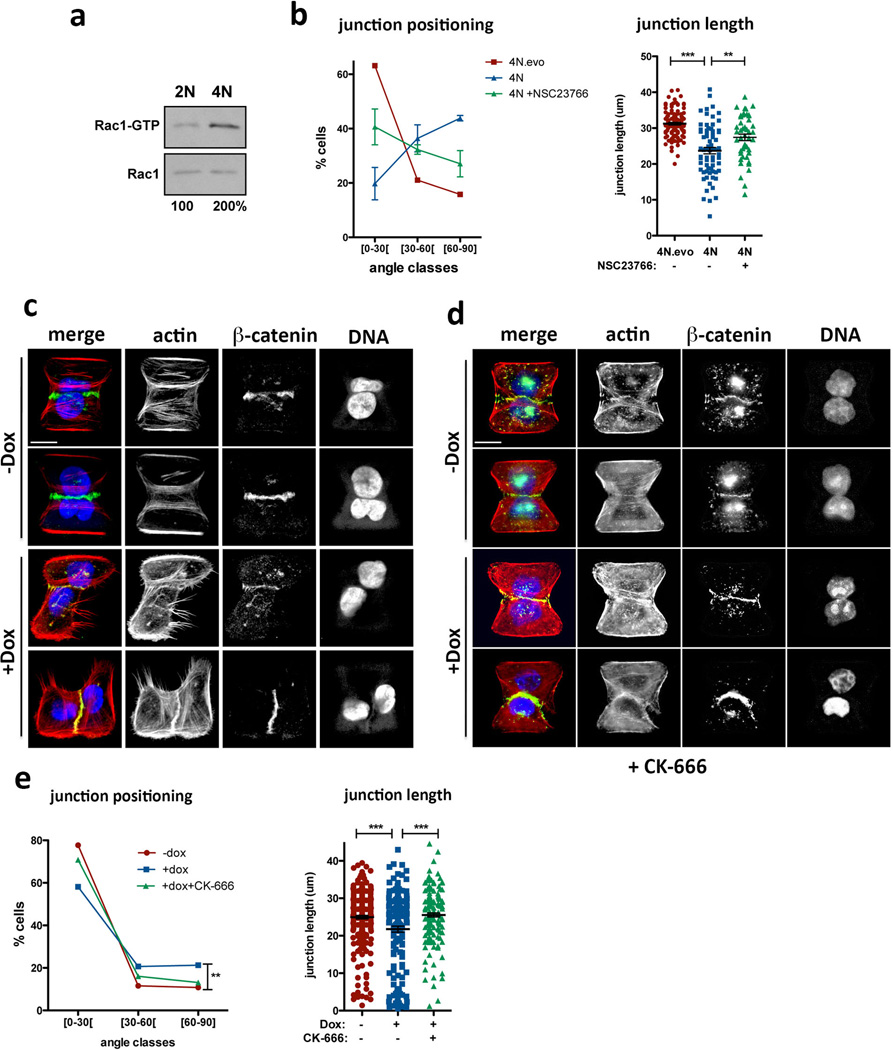
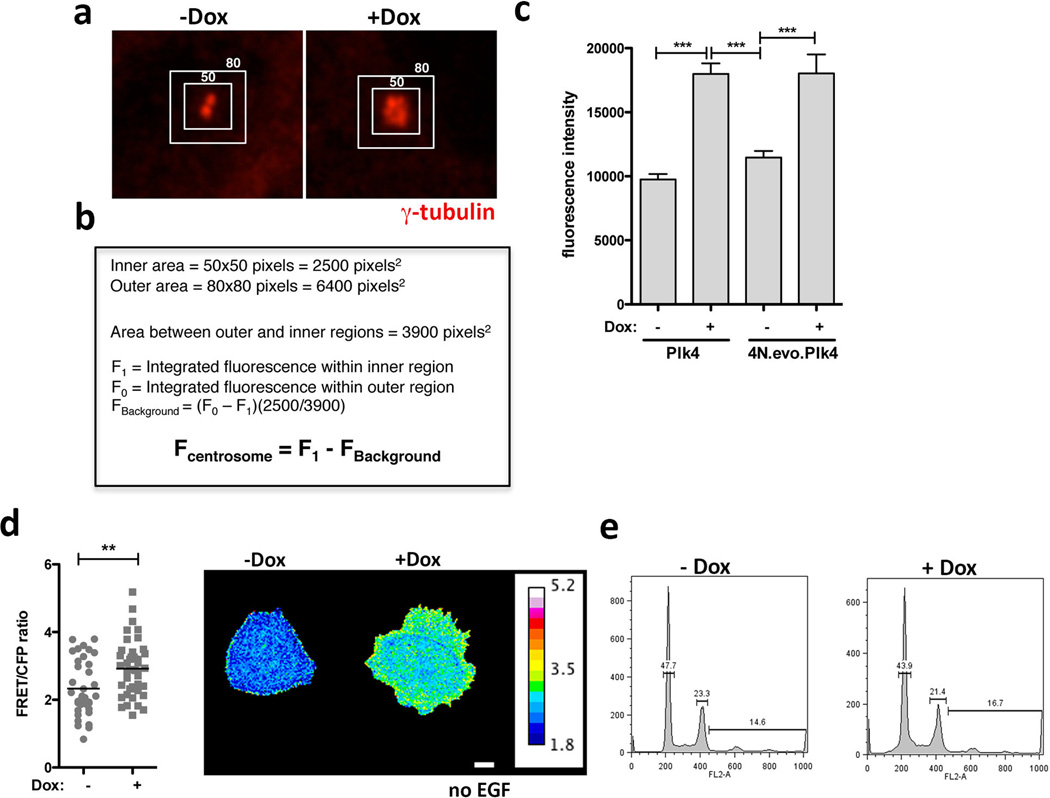
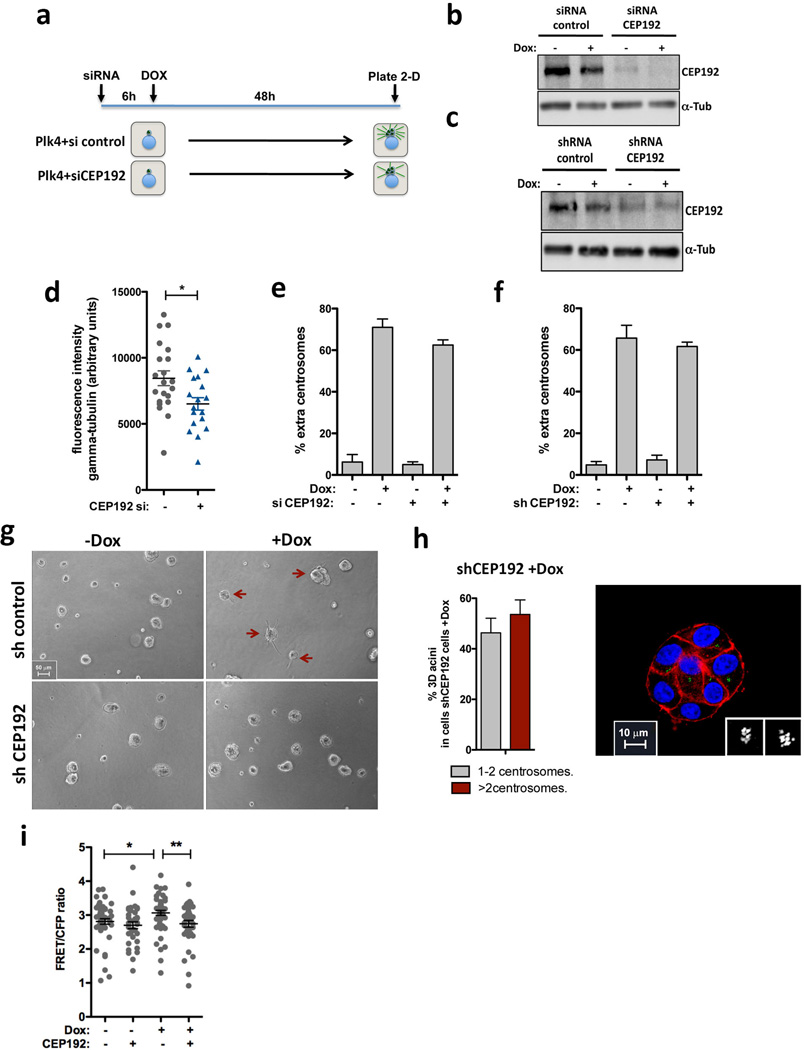
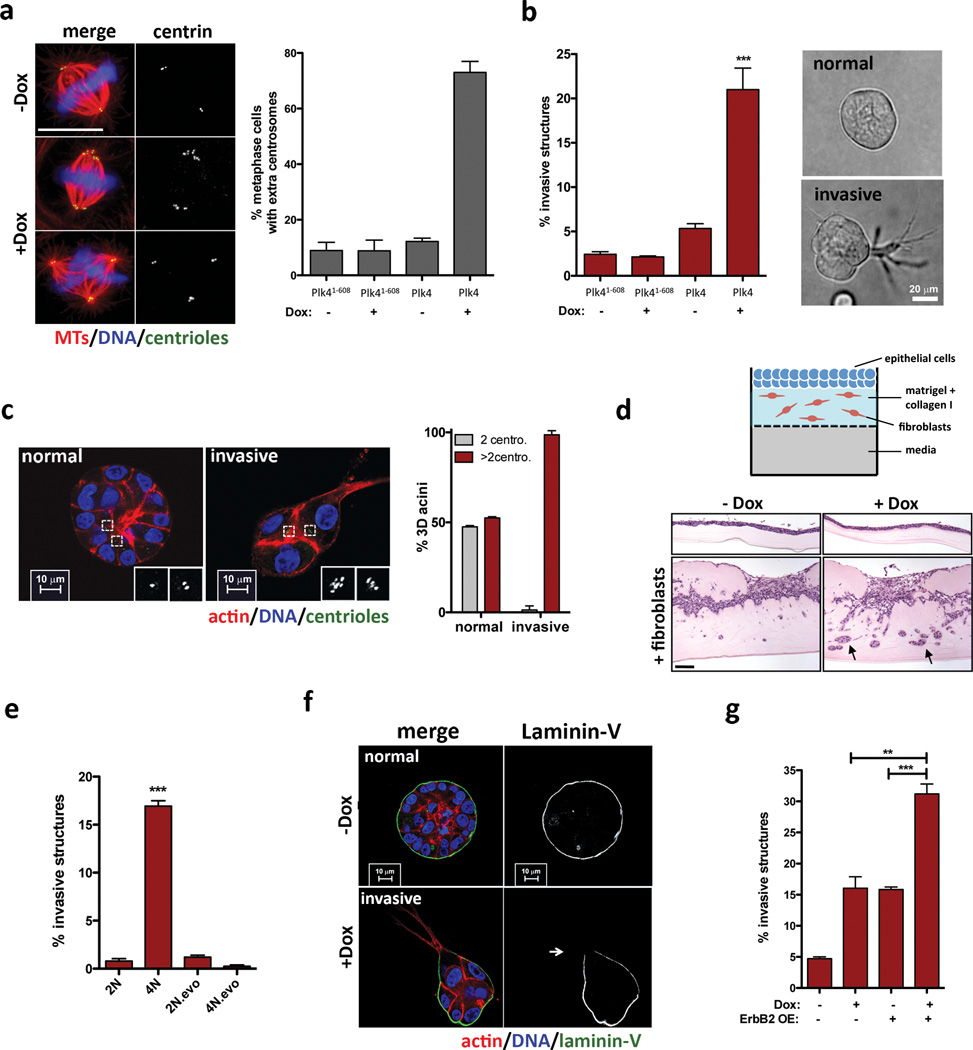
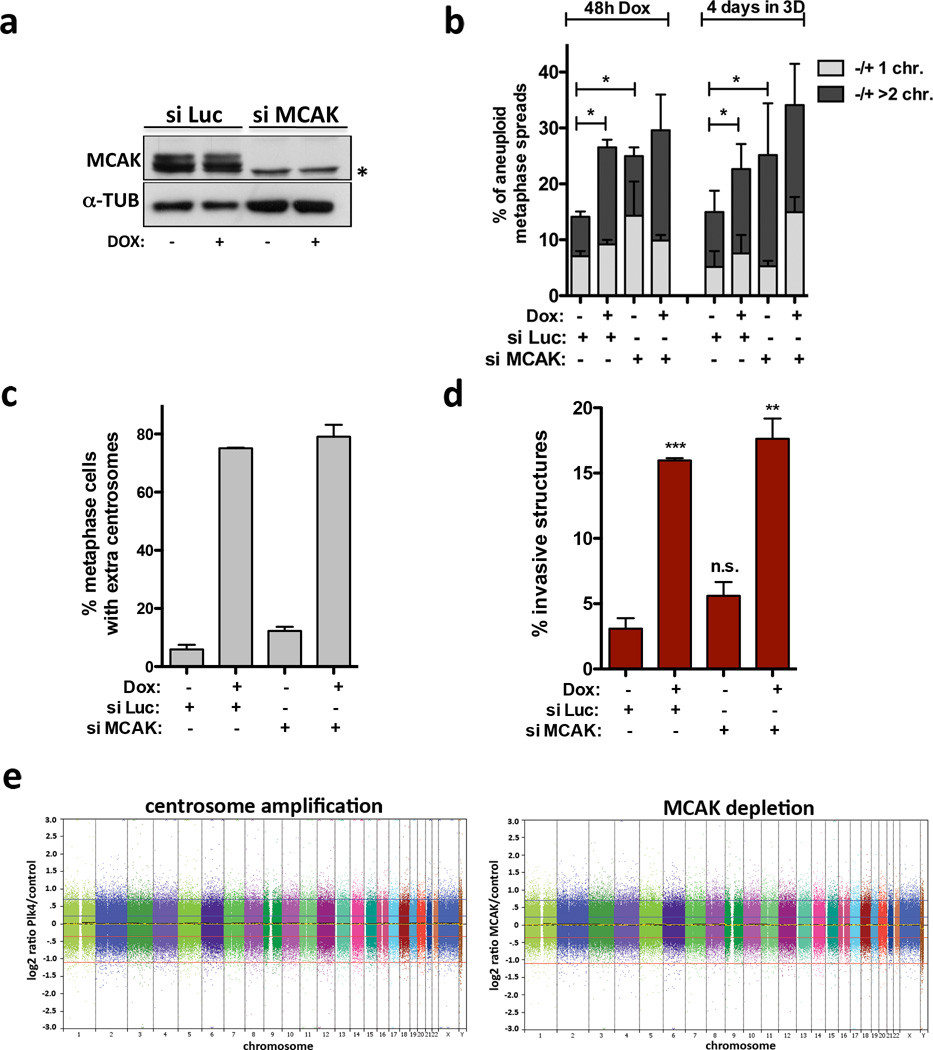
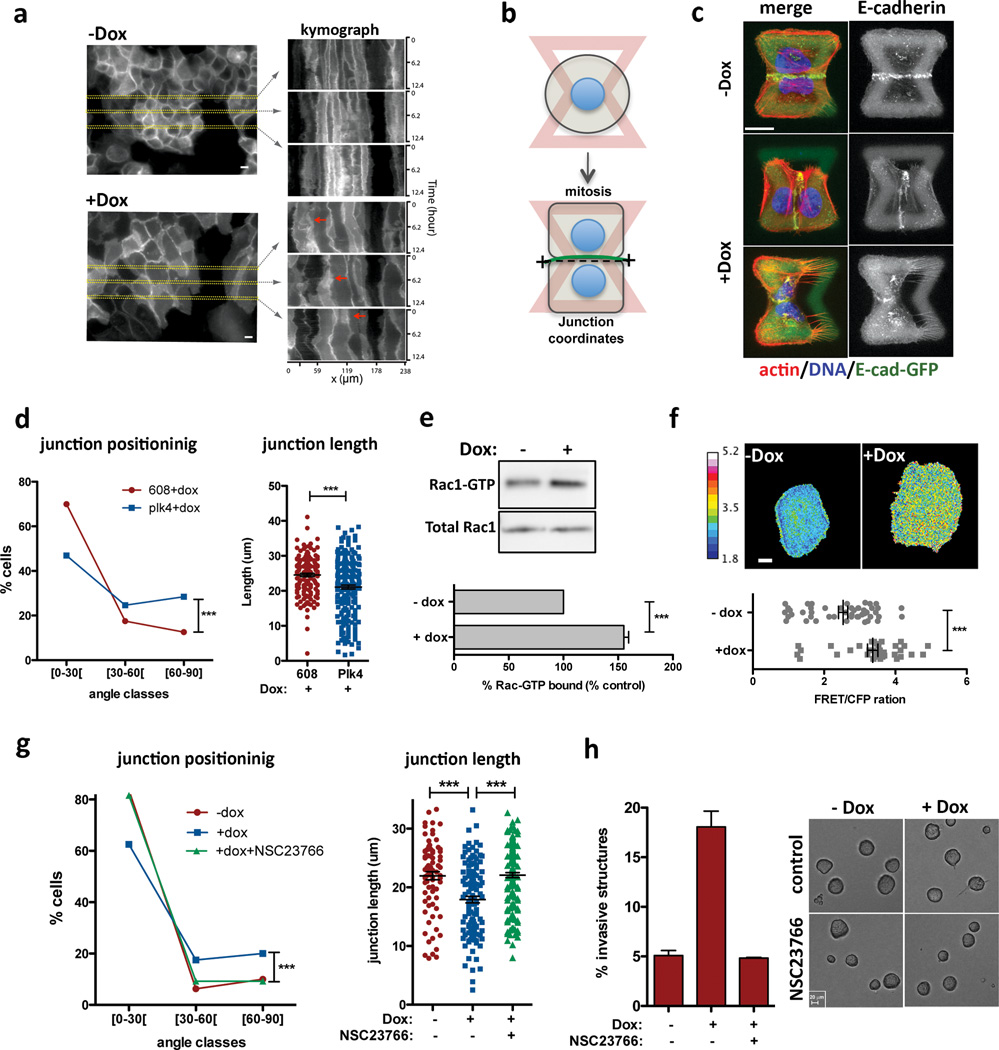
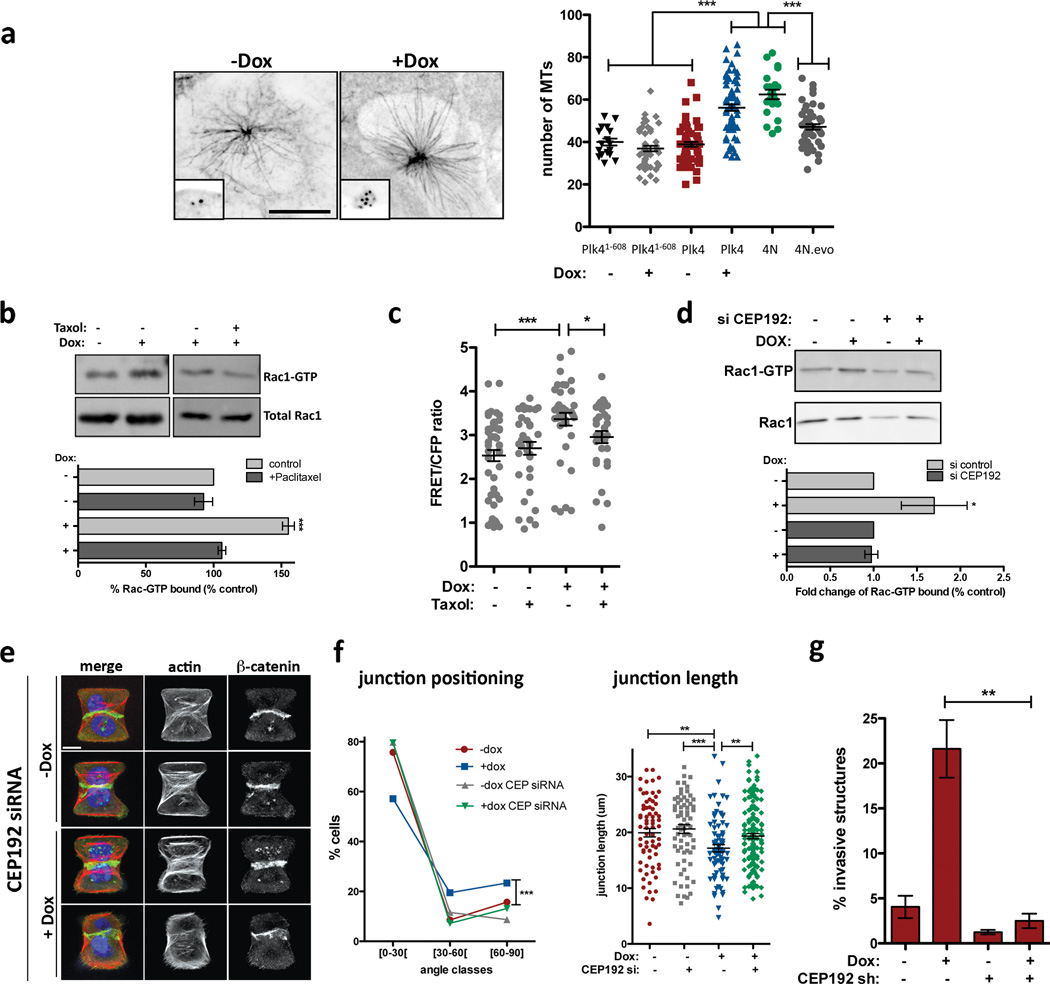
Centrosome amplification has long been recognized as a feature of human tumours; however, its role in tumorigenesis remains unclear. Centrosome amplification is poorly tolerated by non-transformed cells and, in the absence of selection, extra centrosomes are spontaneously lost. Thus, the high frequency of centrosome amplification, particularly in more aggressive tumours, raises the possibility that extra centrosomes could, in some contexts, confer advantageous characteristics that promote tumour progression. Using a three-dimensional model system and other approaches to culture human mammary epithelial cells, we find that centrosome amplification triggers cell invasion. This invasive behaviour is similar to that induced by overexpression of the breast cancer oncogene ERBB2 (ref. 4) and indeed enhances invasiveness triggered by ERBB2. Our data indicate that, through increased centrosomal microtubule nucleation, centrosome amplification increases Rac1 activity, which disrupts normal cell-cell adhesion and promotes invasion. These findings demonstrate that centrosome amplification, a structural alteration of the cytoskeleton, can promote features of malignant transformation.


Figures

Extended Data Figure 1
Extended Data Figure 1. Characterization of cells after transient overexpression of Plk4 or Plk41–608
a, Scheme of the experimental design to induce centrosome amplification. Transient overexpression of Plk4 and Plk41–608 is achieved by addition of Dox for 48hrs (2-D culture) followed by removal of Dox and growth in 3-D culture for 4 days in the absence of Dox. b, qRT-PCR showing the levels of induction of the Plk41–608 and WT Plk4 transgenes in cells after 48hrs of Dox. Error bars represent mean ± SE from 3 independent experiments. c, qRT-PCR showing the expression of Plk4 after 48hrs of Dox (2-D) and after 4 days in 3-D cultures (3-D). Note that Plk4 OE after 4 days in 3-D cultures is shut-off. Error bars represent mean ± SE from 3 independent experiments. d, Proliferation curve of cells after induction of Plk4 and Plk41–608 over 72hrs. Centrosome amplification decreases cell proliferation. Error bars represent mean ± SE from 3 independent experiments. e, The fraction of cells with centrosome amplification at the indicated time points after Plk4 induction. Note that, since centrosome number is quantified in mitotic cells, this result demonstrates that cells with extra centrosomes can enter mitosis even after 72hrs of Dox treatment. Error bars represent mean ± SE from 3 independent experiments. f, Fraction of cells with centrosome amplification in a independently generated MCF10A.Plk4 cell line. Error bars represent mean ± SE from 3 independent experiments. g, Corresponding fraction of invasive acini in 3-D cultures. Error bars represent mean ± SE from 3 independent experiments. h, Centrosome amplification (Plk4 OE, +Dox) in non-transformed keratinocytes (HaCaTs) promotes invasion in the organotypic culture model. Left: Images show H&E staining of sections of HaCats cells. Black arrows indicate cells invading the matrix. Note that the invasion of groups of cells was only detected in the +Dox condition (Black arrowhead). Scale bar: 100µm. Right: Quantification of the percentage of cells that invade. Each dot in the graphic represents the percentage of invasion in each individual well/experiment analyzed. p-value was derived from unpaired two-tailed t-test *, p<0.05). i, Collagen-I degradation induced by centrosome amplification (green). Scale bar: 10µm. Please see Methods.
Extended Data Figure 2
Extended Data Figure 2. Characterization of evolved diploid and tetraploid cells
a, Scheme of the experimental design to obtain fresh MCF10A tetraploid cells with extra centrosomes (4N) and ‘evolved’ tetraploid cells that lost the extra centrosomes (4N.evo), as previously described. b, FACS profiles of ‘evolved’ diploid (2N.evo) and tetraploid cells (4N.evo). c, Western blotting to detect E-cadherin in the ‘evolved’ cells indicates that 4N.evo maintain epithelial characteristics. d, Left: representative images of metaphase chromosome spreads of 2N.evo and 4N.evo. Right: quantification of chromosome number by karyotyping (~30 chromosome spreads were quantified in each condition). 4N.evo cells have a near-tetraploid karyotype. e, Centrosome amplification in diploid cells (2N or 2N.evo) newly generated tetraploid cells (4N) and evolve d tetraploid cells (4N.evo). f, Quantification of the percentage of aneuploid cells in the ‘evolved’ cells. The 4N.evo cells are aneuploidy despite their near-tetraploid genomes (~30 chromosome spreads were quantified in each condition). g, Quantification of centrosome amplification of 4N.evo cells overexpressing Plk4. Error bars represent mean ± SE from 3 independent experiments. h, Quantification of the invasive acini in 4N.evo cells after Plk4 OE. This experiment serves as a control to demonstrate that the 4N.evo cells retain their ability to amplify centrosomes and, after centrosome amplification, retain the capacity to form invasive acini. Error bars represent mean ± SE from 3 independent experiments. p-value derived from unpaired two-tailed t-test (**, p<0.005)
Extended Data Figure 3
Extended Data Figure 3. Characterization of invasive structures in cells with extra centrosomes
a, F-actin and microtubules in invasive protrusions: F-actin (red), microtubules (α-tubulin, green) and DNA (blue). Insets: higher magnification images of the invasive protrusions. Scale bar: 10µm. b, Fibronectin at invasive protrusions: cells were stained for F-actin (red), fibronectin (green) and DNA (blue). Scale bar: 10µm. c, Fraction of invasive acini in 3-D cultures after treatment with the broad spectrum MMP inhibitor, Marimastat (BB-2516). Error bars represent mean ± SE from 3 independent experiments. p-value derived from unpaired two-tailed t-test (**, p<0.005). d, Images from videos of Plk4 OE cells (Supplementary video 3), showing nuclei (labeled with H2B-GFP) migrating into an invasive protrusion (red arrows). Time scale - hrs:minutes. Scale bar: 20µm. e, Multiple cells can migrate into invasive protrusions: cells were stained for F-actin (red), laminin-V (green) and DNA (blue). Red arrows mark cells that migrated into the invasive protrusion. Scale bar: 10µm. f, Western blot showing levels of E-cadherin, N-cadherin and vimentin in cells with (+Dox) and without (−Dox) extra centrosomes before and after 4 days in 3-D culture. The western blots show that, unlike cells treated with TGF-β, cells with extra centrosomes do not acquire a canonical EMT phenotype. We do note a small increase in the levels of vimentin in cells with extra centrosomes before plating in 3-D cultures. Dox treatment was performed for 48hrs prior to 3-D cultures in all experiments.
Extended Data Figure 4
Extended Data Figure 4. Similarity between cells with centrosome amplification and cells with oncogene-induced invasion
Cells were stained for F-actin (red), laminin-V (green) and DNA (blue). Similarity between the invasive protrusions of cells with extra centrosomes and the ones generated by cells overexpressing ErbB2, as previously reported,. In both conditions, invasive protrusions are characterized by the formation of actin-rich protrusions that are accompanied by degradation of the basement membrane. Scale bar: 10µm.
Extended Data Figure 5
Extended Data Figure 5. Riversine treatment induces aneuploidy but not invasive acini in MCF10A cells
a, Quantification of the chromosome number in cells after treatment with with 0.1 µM of Reversine (Riv) for 24hrs before and after 4 days in 3-D cultures (~20 chromosome spreads were quantified in each condition). The concentration of Reversine used does not induce cytokinesis failure and therefore would not induce centrosome amplification by inducing tetraploidy. b, Fraction of invasive acini after MCF10A cells are treated with Riversine. Increased aneuploidy from Riversine treatment does not induce invasion. Error bars represent mean ± SE from 3 independent experiments. c, Images of 3-D cultures after treatment with Riversine showing normal appearing acini. Scale bar: 50µm. d, SNP analysis of MCF10A cells (without centrosome amplification) compared with Human Reference Genomic DNA 103 from Affymetrix. Previously reported genomic alterations in MCF10A cells can be detected in our analysis, namely: +5q, +6p and +8q.
Extended Data Figure 6
Extended Data Figure 6. Invasive protrusions from 3-D cultures of MCF10A cells with extra centrosomes are not an indirect consequence of altered cilia signaling, increased p53 expression or defects in centrosome polarization
a, Left: Cells in 2-D were stained for pericentrin (green, inset), acetylated tubulin (red, inset) and DNA (blue). Cells were arrested for 48hrs in G1 to induce primary cilium formation. Note that even in this case most of the cells do not form cilia. This is expected because MCF10A cells have limited proficiency for cilia formation, with only ~7% of the cells assembling cilia even after 7 days of serum starvation. Right: Cells in 3-D were stained for centrin (GFP, green inset), acetylated tubulin (red, inset) and DNA (blue). Cells do not form cilia after 4 days in 3-D cultures. This is expected because, unlike MDCK cells, MCF10A cells do not have a discernable apical polarity and lumen after 4 days in 3-D cultures and thus unlikely to form primary cilium at this time. b, As expected, centrosome amplification in MCF10A cells induces modest p53 activation. Note that this degree of p53 activation has a minor impact on the proliferation of MCF10A cells (Fig. S1D). Expression of Plk4 and Plk41–608 was induced by Dox for the indicated times: 0, 24, 48 and 72hrs. c, Western blotting showing the levels of induction of p53 after doxorubicin treatment (200 ng/ml for 4hrs) in control and p53-depleted cells, demonstrating that the p53 shRNA efficiently prevents p53 activation. d, Fraction of acini with invasive protrusions from cells with (+Dox) or without (−Dox) centrosome amplification after depletion of p53. The ability of cells to form invasive acini is not significantly impacted by their p53 status. Error bars represent mean ± SE from 3 independent experiments. p-value derived from unpaired two-tailed t-test (***, p<0.0005; *, p<0.05). e, Cells were stained for α-catenin (green), γ-tubulin (red), DNA (blue) the fibronectin micro-pattern visualized in red. Dashed boxes outline the centrosomes. Note that after Plk4 OE, extra centrosomes (clustered in interphase) are correctly positioned towards the cell-cell junction (similar to the control) even when the junction is defective, suggesting that centrosome amplification is not impairing the polarity axis of these cells. f, Centrosome positioning is not altered in cells with (+Dox) and without (control) extra centrosomes. Left: representative images of cells showing centrosomes (γ-tubulin) in relation to adherens junctions (α-catenin). Right: Scheme with quantification of the fraction of centrosomes at the indicated positions on the micropatterns. (see Fig. 3A). Note that the position of centrosomes in cells with centrosome amplification does not differ from that in control cells. Cells were plated on the patterns 48hrs after induction of centrosome amplification with Plk4.
Extended Data Figure 7
Extended Data Figure 7. Centrosome amplification induces cell scattering and Rac activation
a, Quantification of number of cells with (+Dox) or without (−Dox) extra centrosomes that remain as pairs within 10hrs time after mitosis (n−Dox=180; n+Dox=98). Cell scattering occurred in most of the cases within the first 2hrs after mitosis. Cells were imaged on 2-D substratum. Similar results were obtained with fixed cells. Error bars represent mean ± SE from 3 independent experiments. b, Still images from videos showing examples of cells that stay together (−Dox) or move apart (+Dox). Time scale - hrs:minutes. c, Western blot showing levels of p120 catenin in cells with (+Dox) and without (−Dox) extra centrosomes in 2-D and 3D cultures. d, Top: Western blot from a pull-down experiment to detect GTP-bound Rac1 in HaCaTs cells. Bottom: quantification of active Rac1 from pull-down experiments. Error bars represent mean ± SE from 3 independent experiments. e, Top: Western blot from a pull-down experiment to detect GTP-bound Rac1 in 16HBE cells. Bottom: quantification of active Rac1 from pull-down experiments. Error bars represent mean ± SE from 2 independent experiments. f, FRET control demonstrating increased CFP emission after photobleaching of the YFP fluorophore at an excitation wavelength of 510 nm for 10 min in MFC-10A cells expressing Raichu-Rac. g, Levels of active Rac1 measured by FRET in cells overexpression Plk41–608. n−Dox=25; n+Dox=22. Error bars represent mean ± SE. h, Western blot from a pull-down experiment to detect GTP-bound RhoA in MCF10A cells showing decrease RhoA activity in cells with extra centrosomes. i, Levels of active Rac1 measured by FRET in cells with extra centrosomes treated with the Rac1 inhibitor NSC23766, demonstrating that NSC23766 inhibits Rac1 activation in cells with extra centrosomes. n−NSC23766=37; n+NSC23766=36. Error bars represent mean ± SE. All the p-values were derived from unpaired two-tailed t-test (***, p<0.0005; **, p<0.005; *, p<0.05). Scale bar: 10µm.
Extended Data Figure 8
Extended Data Figure 8. Cell-cell adhesion defects caused by centrosome amplification can be observed in tetraploid cells and can be suppressed by Arp2/3 complex inhibition
a, Western blot from a pull-down experiment to detect GTP-bound Rac1 in tetraploid MCF10A cells. b, Distribution of the cell-cell junction angles (left) and size (right) in the indicated tetraploid cells, with or without treatment with the Rac1 inhibitor, NSC23766. Note that tetraploid cells with extra centrosomes (4N) have a dramatic defect in junction positioning by comparison with tetraploid cells with normal centrosome number (4N.evo). This severe phenotype is only partially rescued by Rac1 inhibition. n4N.evo=106; n4N=70; nNCS23766=47. Error bars represent mean ± SE. c, Examples of cell doublets with (+Dox) or without (−Dox) centrosome amplification on the fibronectin micro-patterns. Cells were stained for F-actin (red), β-catenin (green), DNA (blue). d, Examples of cell doublets with (+Dox) or without (−Dox) centrosome amplification on the fibronectin micro-patterns treated with the Arp2/3 inhibitor (CK-666). Cells were stained for F-actin (red), β-catenin (green), DNA (blue). e, Distribution of the junction angle and quantification of the junction size in cells with extra centrosomes treated with 50 µM of Arp2/3 inhibitor (CK-666) for 6hrs. Cells were analyzed 48hrs after Dox treatment. n−Dox=251; n+Dox=160; nCK666=168. Error bars represent mean ± SE. All the p-values were derived from unpaired two-tailed t-test (***, p<0.0005; **, p=0.005). Scale bar: 10µm.
Extended Data Figure 9
a, Images of centrosomes from interphase MCF10A cells stained for γ-tubulin. Boxes represent the region for measurement of centrosomal γ-tubulin signal (inside) and background (area between inside-outside boxes). b, Method used to determine the integrated fluorescent intensity of centrosomal γ-tubulin, as previously described. c, Measurement of γ-tubulin intensity at the centrosomes showing that in interphase, increased centriole number is sufficient to increase γ-tubulin levels at the centrosomes whereas increased ploidy per se does not (4Nevo). nPlk4−Dox=60; nPlk4+Dox=49; n4N.evo.Plk4−Dox=34 n4N.evo.Plk4+Dox=35. Error bars represent mean ± SE. d, Increased Rac1 activity in cells with extra centrosomes can be detected in arrested cells deprived of EGF. Left: Quantification of Rac1 activity by FRET in single cells with (+Dox) and without (−Dox) extra centrosomes in the absence of EGF. Right: FRET images of cells in the absence of EGF. nPlk4−Dox=36; nPlk4+Dox=47. Error bars represent mean ± SE. Scale bar: 10µm. c, FACS profiles of control (−Dox) and cells with extra centrosomes (+dox) after 48hrs of Dox treatment showing that there is not major difference in the cell cycle profiles of these cells. Note that at this time point centrosome amplification does not produce a striking defect in cell proliferation (Extended Data Figure 1d). All the p-values were derived from unpaired two-tailed t-test (**, p<0.005; ***, p<0.0005).
Extended Data Figure 10
Extended Data Figure 10. Depletion of Cep192 suppresses the invasive properties of cells with centrosome amplification
a, Scheme of the experimental design to induce centrosome amplification in cells depleted of Cep192 by siRNA. Transient overexpression of Plk4 is induced 6hrs after siRNA to allow efficient centrosome overduplication. As expected, after depletion of Cep192 for 48hrs, cells are partially compromised in their ability to overduplicate centrosomes after Plk4 OE. b, Western blot showing efficient depletion of Cep192 after 48hrs treatment of cells with Cep192 siRNA. c, Western blot showing partial depletion of Cep192 by shRNA. d, Quantification of centrosomal γ-tubulin after depletion of CEP192 by siRNA for 48hrs. Similar results were observed with Cep192 esiRNA (not shown). Of note, at least for a three-day period, cells remain viable after Cep192 knockdown. nctr.siRNA=22; nCEP.siRNA=20. Error bars represent mean ± SE. Quantification of centrosome amplification after depletion of Cep192 by siRNA (e) or shRNA (f). Error bars represent mean ± SE from 3 independent experiments. g, Bright field images of acini after 4 days in 3-D culture, demonstrating that partial Cep192 depletion by shRNA does not significantly impair cell growth or the formation of acini. Red arrows indicate the invasive acini. h, Right: Quantification of Plk4-mediated centrosome amplification in cells depleted of Cep192 after 4 days in 3-D cultures showing that these cells still carry extra centrosomes. Error bars represent mean ± SE from 3 independent experiments. Left: Normal acini displaying centrosome amplification after partial knockdown of CEP192. Cells were stained for F-actin (red), centrioles (centrin1-GFP, green) and DNA (blue). Scale bar: 10µm. i, Levels of active Rac1 measured by FRET after CEP192 depletion. nctr.siRNA−Doc=51; nctr.siRNA+Doc=35 nCEP.siRNA−Dox=53; nCEP.siRNA+Dox=37. Error bars represent mean ± SE. All the p-values were derived from unpaired two-tailed t-test (*, p<0.05; **, p<0.005).
Figure 1
Figure 1. Invasive behavior of epithelial cells triggered by centrosome amplification
a, Left: cells stained for microtubules (α-tubulin; red), centrioles (centrin2, green) and DNA (blue). Scale bar: 10µm. Right: fraction of cells with centrosome amplification. Error bars represent mean ± SE from 3 independent experiments. b, Left: fraction of invasive acini in 3-D cultures. Right: representative images of normal acinus and acinus with invasive protrusions. Scale bar: 10µm. Error bars represent mean ± SE from 4 independent experiments c, Left: cells stained for F-actin (red), centrioles (centrin1-GFP, green, inset white), and DNA (blue). Scale bar: 10µm. Right: Fraction of acini with centrosome amplification after Plk4 OE. Error bars represent mean ± SE from 3 independent experiments. d, Top: Scheme of the organotypic culture model used to assess invasion. Bottom: H&E staining if sections of MCF10A cells plated on the organotypic model, with and without fibroblasts (black arrows show highly invasive areas). Percentage of invasion: −Dox= 11.7±0.83; +Dox= 26.1±6.5. Scale bar: 100µm. e, Fraction of invasive acini in tetraploids. Error bars represent mean ± SE from 3 independent experiments. f, Acini stained for laminin-V (green), F-actin (red) and DNA (blue). White arrow indicates laminin-V degradation. Scale bar: 10µm. g, Fraction of invasive acini in cells that overexpress ErbB2, with or without centrosome amplification. Error bars represent mean ± SE from 3 independent experiments. All p-values were derived from unpaired two-tailed t-test (***, p<0.0005).
Figure 2
Figure 2. The induction of aneuploidy does not generate invasive acini
a, Western blot showing depletion of MCAK by siRNA (48hrs). *Marks a non-specific band. b, Quantification of chromosome number, shown as the percentage deviation from the mode, in cells before adding to 3-D cultures (48hrs) and after 3-D cultures (~100 spreads were scored per condition). Significance was determined by Chi-squared testing to compare the frequencies of nominal variables (*, p<0.05). c, Fraction of cells with centrosome amplification. Error bars represent mean ± SE from 3 independent experiments. d, Fraction of invasive acini. Error bars represent mean ± SE from 3 independent experiments. p-value derived from unpaired two-tailed t-test (***, p<0.0005; **, p<0.005; n.s. not significant). e, SNP analysis of cells with extra centrosomes and depleted of MCAK. Shown are log2 copy number ratios of the indicated samples relative to their controls.
Figure 3
Figure 3. Centrosome amplification disrupts normal cell-cell adhesion because of Rac1 activation
a, Kymograph analysis of cell-cell adhesion in live cells visualized with a plasma membrane marker (Rac-Raichu, CFP fluorescence). Red arrows mark areas of overlap. b, Scheme of the micro-pattern used. c, Images of cells (after mitosis) on micro-patterns labeled for E-cadherin (GFP; green), F-actin (red), DNA (blue), and fibronectin micro-pattern (green). Top: normal sized junction with a normal position (narrow angle); middle: abnormal junction position; bottom: smaller junction size. Scale bar: 10µm. d, Distribution of the cell-cell junctions angles (left) and size (right). n−Dox=143; n+Dox=216 Error bars represent mean ± SE. e, Top: Western blot from a pull-down experiment to detect GTP-bound Rac1. Bottom: quantification from 3 independent pull-down experiments. Error bars represent mean ± SE. f, Top: examples of FRET ratiometric images; color coded scale represents the level of Rac1 activation. Scale bar: 10µm. Bottom: levels of active Rac1 measured by FRET. n−Dox=50; n+Dox=38. Error bars represent mean ± SE. g, Inhibition of Rac1 with NSC23766 in cells plated on patterns. n−Dox=80; n+Dox=119; n+NSC23766=162. h, Left: fraction of invasive acini after treatment with NSC23766. Right: Images of control and NSC23766 treated acini. Scale bar: 20µm. Error bars represent mean ± SE from 3 independent experiments. All p-values p-values were derived from unpaired two-tailed t-test (***, p<0.0005).
Figure 4
Figure 4. Effects of centrosome amplification are mediated by increased nucleation of centrosomal microtubules
a, Left: images of microtubules (α-tubulin; insets: centrioles) in cells after microtubule re-growth. Right: Microtubule numbers from the indicated cells. nPlk4(1–608) −Dox=18; nPlk4(1–608)+Dox=51; nPlk4−Dox=66; nPlk4+Dox=71; n4N=22; n4N.evo=49. Error bars represent mean ± SE. b, Top: Pull-down assay to measure GTP-bound Rac1 after Paclitaxel treatment. Bottom: quantification of the levels of Rac1-GTP. Error bars represent mean ± SE from 3 independent experiments. c, FRET ratios for measuring active Rac1 in cells after the indicated treatments. n−Dox=50; n−Dox+Taxol=38; n+Dox=38; n+Dox+Taxol=32. Error bars represent mean ± SE. d, Top: Pull-down assay to measure GTP-bound Rac1 after CEP192 depletion by siRNA. Bottom: quantification of the levels of Rac1-GTP. Error bars represent mean ± SE from 4 independent experiments. p value derived from Wilcoxon test (*, p<0.05). e, Images of cells depleted of CEP192 on micro-patterns labeled for β-catenin (green), F-actin (red), DNA (blue), and fibronectin micro-pattern (green). Scale bar: 10µm. f, Angles and sizes of cell-cell junctions after depletion of Cep192 by siRNA. nctr.siRNA−Doc=71; nctr.siRNA+Doc=78; nCEP.siRNA−Dox=69; nCEP.siRNA+Dox=150. Error bars represent mean ± SE. g, Fraction of invasive acini seen after depletion of Cep192 by shRNA. Error bars represent mean ± SE from 3 independent experiments. For panels a, b, c, f and g, p-values were derived from unpaired two-tailed t-test (***, p<0.0005; **, p<0.005; *, p<0.05).

References

    1. Zyss D, Gergely F. Centrosome function in cancer: guilty or innocent? Trends Cell Biol. 2009;19:334–346. - PubMed
    1. Ganem NJ, Godinho SA, Pellman D. A mechanism linking extra centrosomes to chromosomal instability. Nature. 2009;460:278–282. - PMC - PubMed
    1. Chan JY. A clinical overview of centrosome amplification in human cancers. Int J Biol Sci. 2011;7:1122–1144. - PMC - PubMed
    1. Levental KR, et al. Matrix crosslinking forces tumor progression by enhancing integrin signaling. Cell. 2009;139:891–906. - PMC - PubMed
    1. Bettencourt-Dias M, Glover DM. Centrosome biogenesis and function: centrosomics brings new understanding. Nat Rev Mol Cell Biol. 2007;8:451–463. - PubMed

Supplementary References

    1. Debnath J, et al. The role of apoptosis in creating and maintaining luminal space within normal and oncogene-expressing mammary acini. Cell. 2002;111:29–40. - PubMed
    1. Schafer ZT, et al. Antioxidant and oncogene rescue of metabolic defects caused by loss of matrix attachment. Nature. 2009;461:109–113. - PMC - PubMed
    1. Gunawardane RN, et al. Novel role for PDEF in epithelial cell migration and invasion. Cancer Res. 2005;65:11572–11580. - PMC - PubMed
    1. Xiang B, Muthuswamy SK. Using three-dimensional acinar structures for molecular and cell biological assays. Methods Enzymol. 2006;406:692–701. - PubMed
    1. Paszek MJ, Weaver VM. The tension mounts: mechanics meets morphogenesis and malignancy. J Mammary Gland Biol Neoplasia. 2004;9:325–342. - PubMed

Publication types

MeSH terms

Associated data