. 2014 May 29;509(7502):627-32.
doi: 10.1038/nature13169. Epub 2014 Apr 16.

Scalable control of mounting and attack by Esr1+ neurons in the ventromedial hypothalamus

Affiliations

Scalable control of mounting and attack by Esr1+ neurons in the ventromedial hypothalamus

Hyosang Lee et al. Nature. .

Abstract

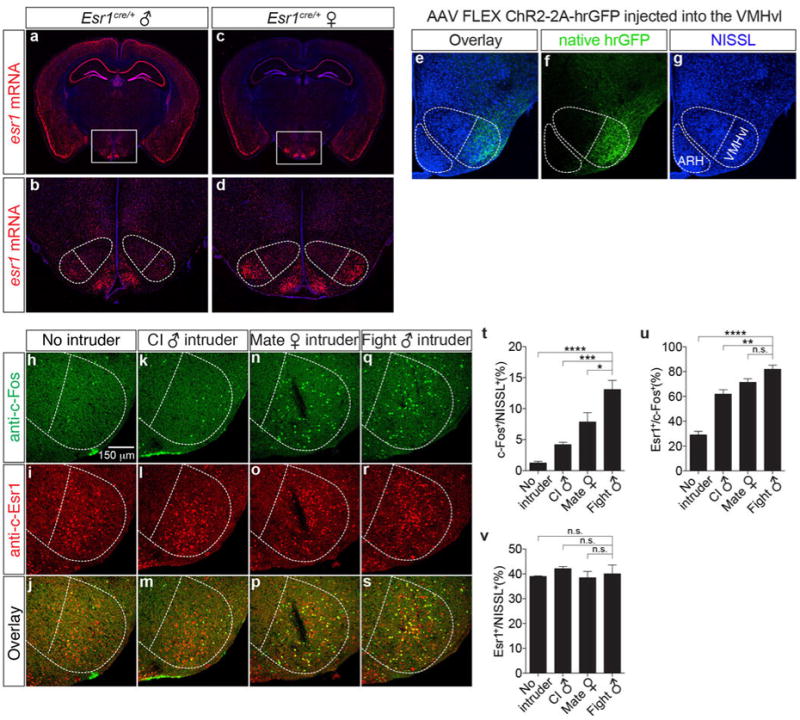
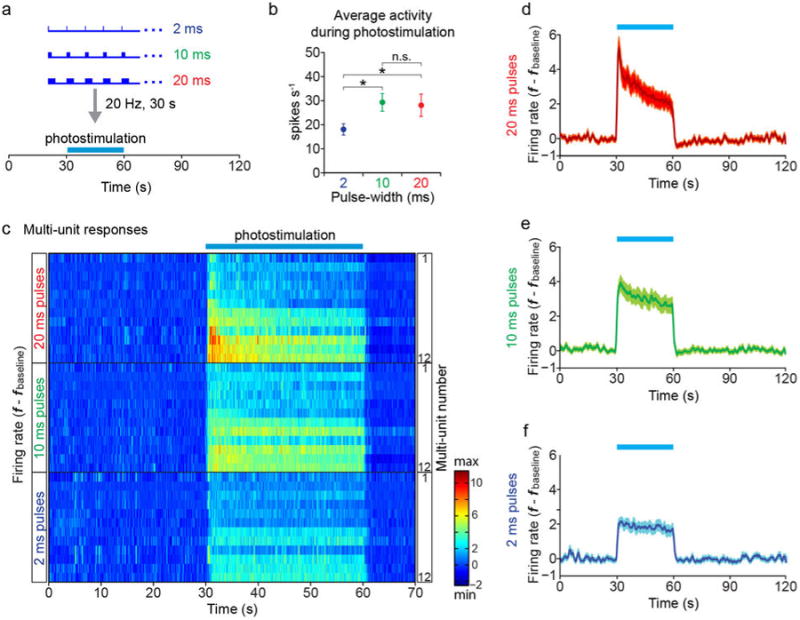
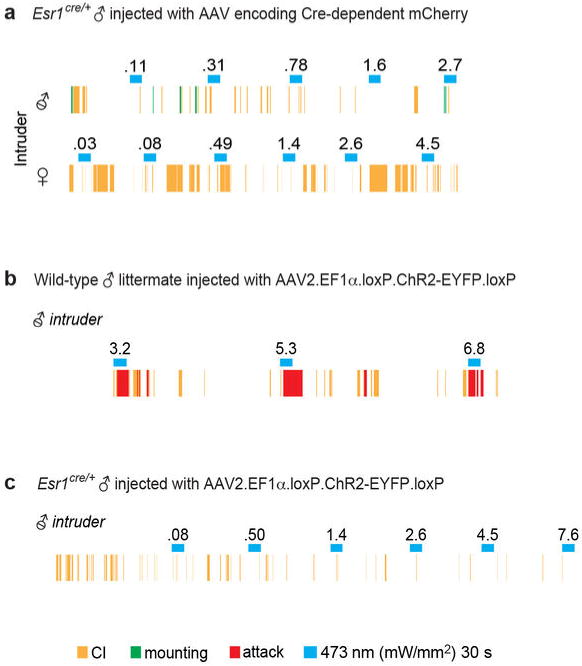
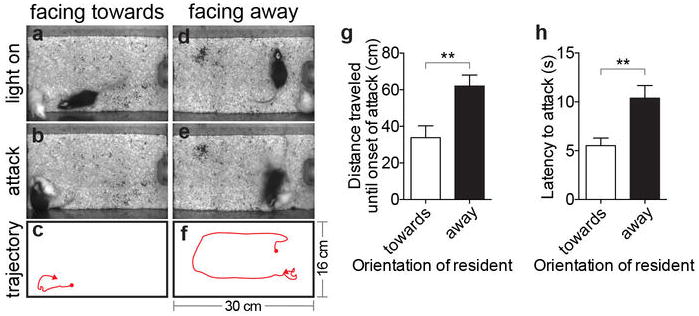
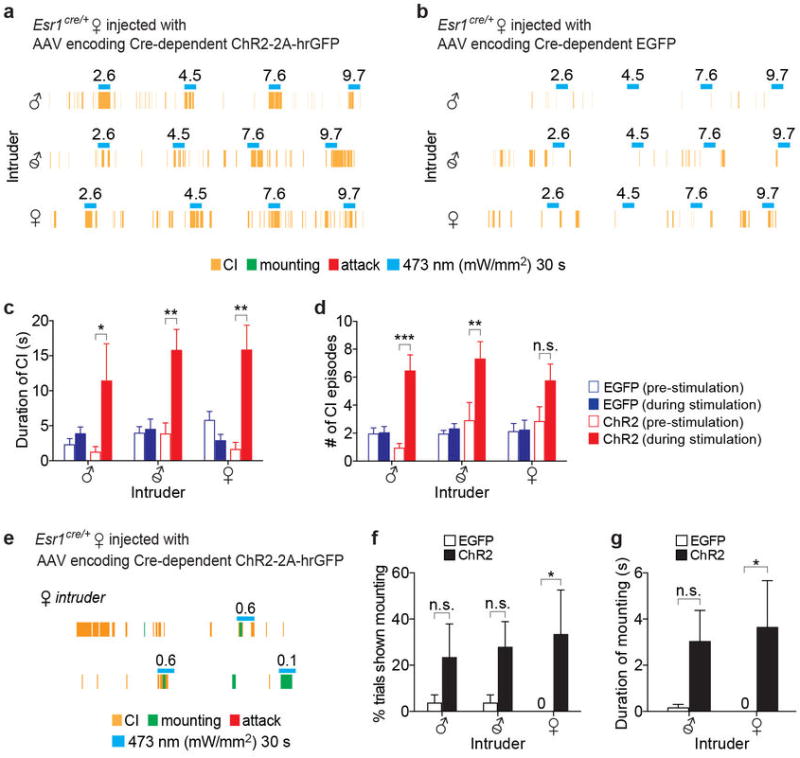
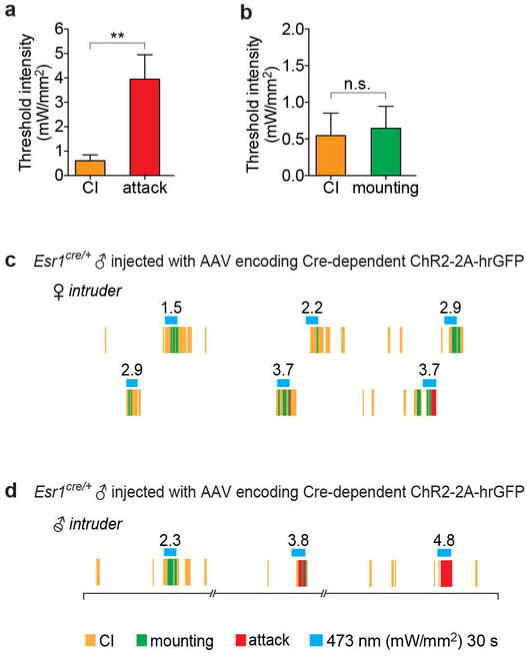
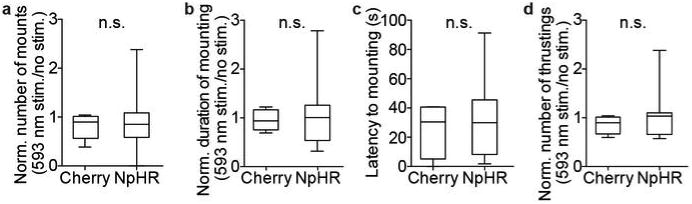
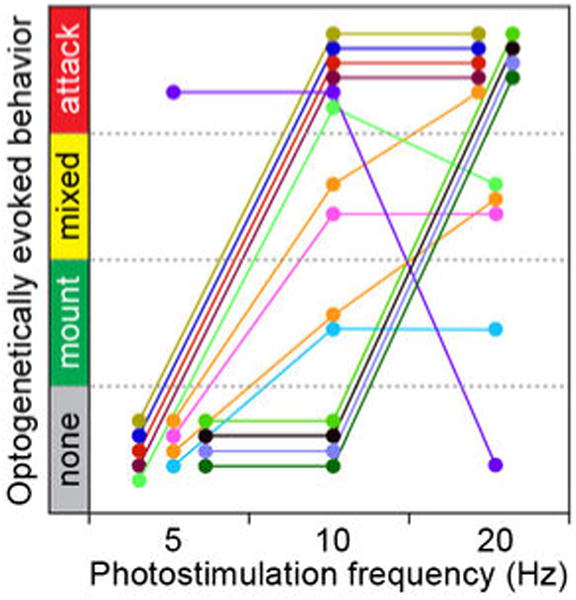
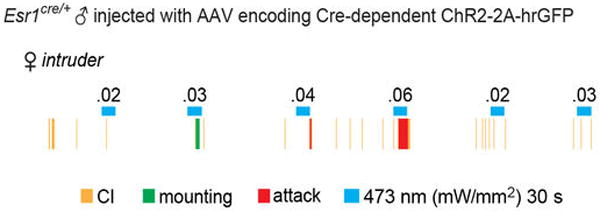
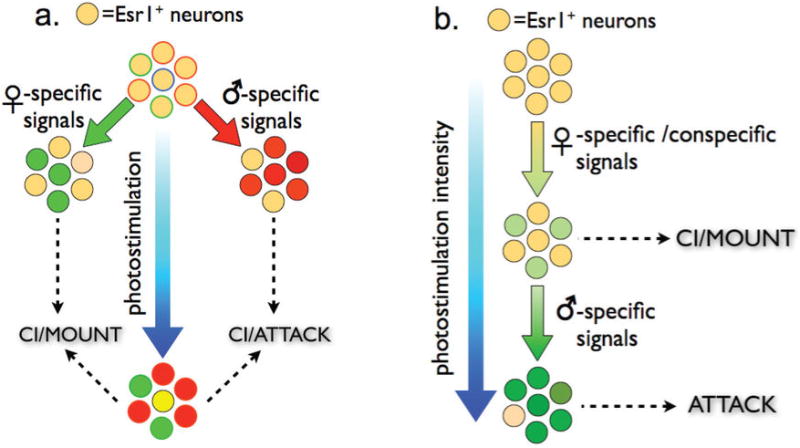
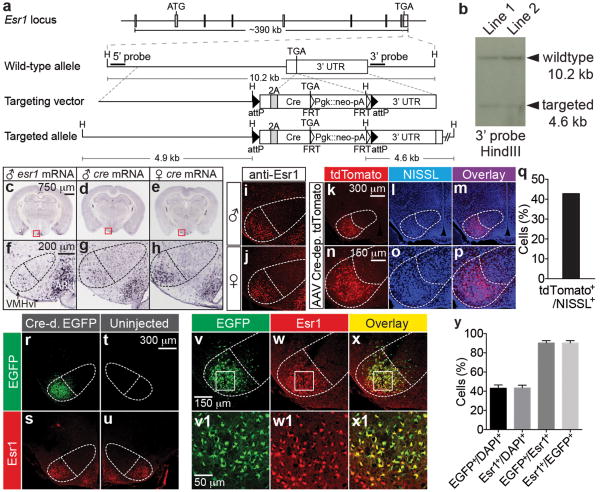
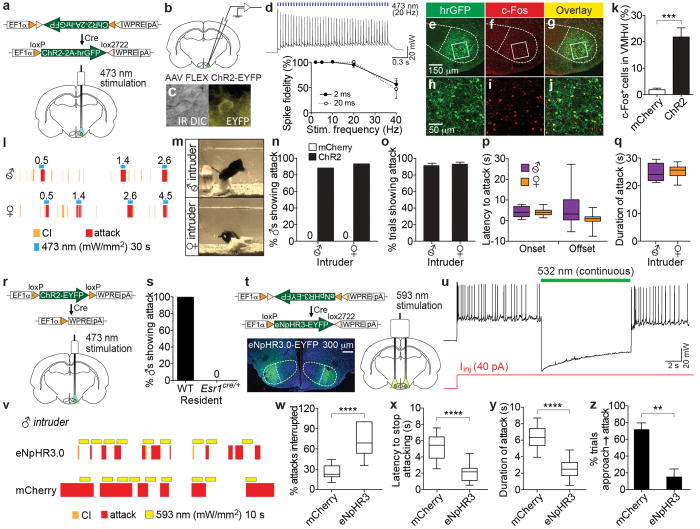
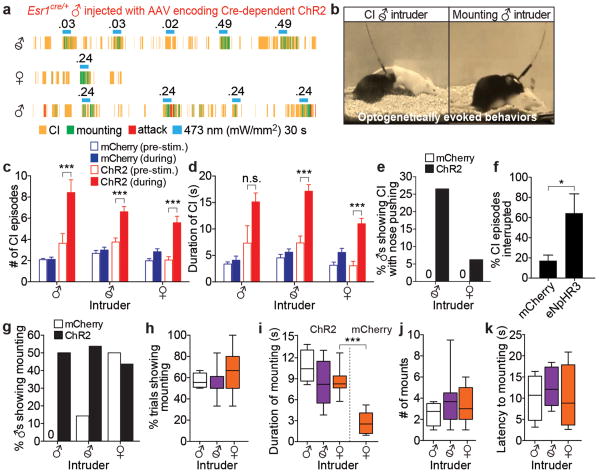
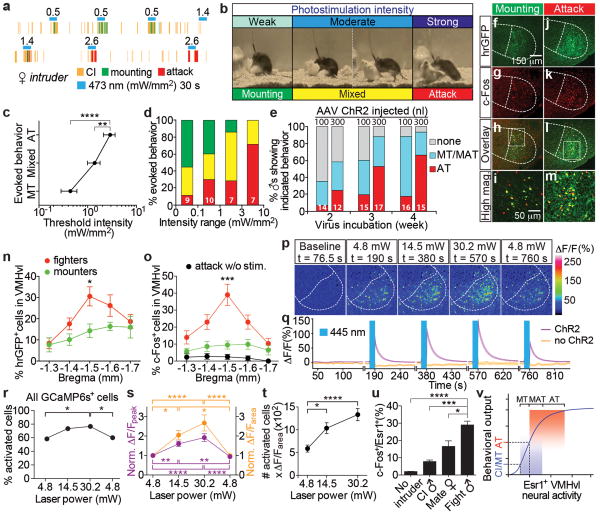
Social behaviours, such as aggression or mating, proceed through a series of appetitive and consummatory phases that are associated with increasing levels of arousal. How such escalation is encoded in the brain, and linked to behavioural action selection, remains an unsolved problem in neuroscience. The ventrolateral subdivision of the murine ventromedial hypothalamus (VMHvl) contains neurons whose activity increases during male-male and male-female social encounters. Non-cell-type-specific optogenetic activation of this region elicited attack behaviour, but not mounting. We have identified a subset of VMHvl neurons marked by the oestrogen receptor 1 (Esr1), and investigated their role in male social behaviour. Optogenetic manipulations indicated that Esr1(+) (but not Esr1(-)) neurons are sufficient to initiate attack, and that their activity is continuously required during ongoing agonistic behaviour. Surprisingly, weaker optogenetic activation of these neurons promoted mounting behaviour, rather than attack, towards both males and females, as well as sniffing and close investigation. Increasing photostimulation intensity could promote a transition from close investigation and mounting to attack, within a single social encounter. Importantly, time-resolved optogenetic inhibition experiments revealed requirements for Esr1(+) neurons in both the appetitive (investigative) and the consummatory phases of social interactions. Combined optogenetic activation and calcium imaging experiments in vitro, as well as c-Fos analysis in vivo, indicated that increasing photostimulation intensity increases both the number of active neurons and the average level of activity per neuron. These data suggest that Esr1(+) neurons in VMHvl control the progression of a social encounter from its appetitive through its consummatory phases, in a scalable manner that reflects the number or type of active neurons in the population.


Figures

Extended Data Figure 1
Extended Data Figure 1. Esr1 mRNA expression in Esr1cre/+ male and female mice
In situ hybridization for Esr1mRNA in Esr1cre/+ male (a, b, red) and female (c, d, red) mice (Bregma ∼-1.65 mm). b-d are the boxed areas in a-c. Note that the expression of esr1 mRNA in VMHvl (dotted outline) is higher in females than in males. e-g. Immunofluorescence showing that expression of a Cre-dependent hrGFP reporter expressed from a stereotaxically injected rAAV (f, green) is restricted to VMHvl, without detectable spillover expression in the nearby arcuate hypothalamic nucleus (ARH). h-s. Double labeling for behaviorally-induced c-Fos (h, k, n, q, anti-c-Fos, green) and Esr1 (i, l, o, r, anti-Esr1, red) in wild-type male residents following a 30-min resident-intruder test with no (h-j, n=3), male (k-m, close investigation without attack, n=4; q-s, attack, n=5) or female (n-p, mating, n=5) intruders. t-v. Quantification of the fraction of total (NISSL+) cells that were c-Fos+ following different behaviors (t), fraction of c-Fos+ that were Esr1+for each behavior (u), and fraction of NISSL+ cells that are Esr1+(v) in VMHvl, quantified from data as illustrated in (h-s). *p<0.05, ***p<0.001, ****p<0.0001; one-way ANOVA with Dunnett's multiple comparisons test.
Extended Data Figure 2
Extended Data Figure 2. In vivo electrophysiological responses of Esr1+ VMHvl neurons during photostimulation with 2, 10, and 20-ms pulses
a, Photostimulation paradigm. Extracellular recordings were obtained from Esr1+ VMHvl cells expressing rAAV2 Cre-dependent ChR2 in solitary, awake behaving animals using a modification of a 16-wire electrode bundle micro-drive containing an integrated optic fiber. Following a 30-s baseline measurement, photostimulation trials were performed (473 nm, 20 Hz, blue bars) for 30 s using three different pulse-widths (2 ms, 10 ms, and 20 ms). Five trials, each 2 minutes in length, were recorded for each pulse-width (see (c)). b, Mean firing rate changes averaged across 12 multi-units (5 trials/unit) in VMHvl during 30-s photostimulation periods. 2 ms, 17.98±2.35 spikes/sec, 10 ms, 29.26±3.67 spikes/sec, and 20 ms, 28.07±4.65 spikes/sec. *p<0.05, Wilcoxon rank sum test. c, Spiking responses of 12 multi-unit recording channels in VMHvl. Each raster plot represents the average of five trials per channel per pulse-width (2, 10 or 20 ms), arranged in order of response magnitude. The arrangement is the same for the three pulse widths (2 ms, 10 ms and 20 ms). d-f, Peri-stimulus time histograms (PSTHs) illustrating mean firing rate changes averaged over the 12 multi-units shown in (c), for photostimulation trials using 20 ms (d), 10 ms (e), or 2 ms (f) light pulse-widths. Data are mean ± SEM. See also main Figure 2d, which presents whole-cell patch clamp recordings from Esr1+ neurons in VMHvl acute slice preparations, indicating that spike fidelity is close to 100% and statistically indistinguishable between 2 ms and 20 ms light pulse-widths.
Extended Data Figure 3
Extended Data Figure 3. Photostimulation of Esr1+ VMHvl neurons expressing mCherry or Esr1- VMHvl neurons expressing ChR2 fails to evoke aggression
a. Animals expressing Cre-dependent mCherry virus in VMHvl fail to show aggression during photostimulation. Representative raster plot showing episodes of Close Investigation (CI; yellow ticks), mounting (green ticks) or attack (red ticks) in an mCherry-expressing Esr1cre/+ male. No attacks are evoked towards either a castrated male (upper plot) or an intact unreceptive female (lower plot) during photostimulation trials (blue bars; 473 nm, 20ms pulses, 20 Hz, 30 s; numbers indicate mW/mm2). b-c. Activation of the non-Esr1-expressing subpopulations of VMHvl neurons is insufficient to evoke aggression. Representative raster plots illustrating photostimulation-evoked behavioral responses towards a castrated male by a wild-type (b) or an Esr1cre/+(c) mouse injected with the “Cre-out” AAV2 containing a “floxed” ChR2 coding sequence (Fig. 2r). Attack (red rasters; 3.2-6.8 mW/mm2) was elicited during photostimulation trials (blue bars) in wild-type males, indicating that the floxed ChR2 construct is effective in the absence of Cre, whereas no behavior was evoked in Esr1cre/+ males where ChR2 is expressed in Esr1-, but not in Esr1+, neurons.
Extended Data Figure 4
Extended Data Figure 4. Latency to attack depends on the initial orientation of the resident with respect to the intruder at the time of photostimulation
(a, b) and (d, e). Video stills illustrating initial position and orientation (“facing toward vs. away”) of a ChR2-expressing Esr1cre/+ male (black) towards a castrated male intruder (white) at the onset of photostimulation (a, d) and at the initiation of evoked attack (b, e). (c, f), trajectory plots showing the paths taken by the Esr1cre/+ males from the onset of photostimulation (red dots) to the onset of attack (red arrowheads). Cage dimensions indicated in f. (g, h). Quantification of distance traveled from onset of photostimulation to attack (g) and latency to attack (h), from data in (a-f) (n=11, **p<0.01, Mann-Whitney U-test). Note that if the resident is initially facing away from the intruder (d-f), the latency to attack is longer (h) because the resident initially moves in the direction that it was facing (f) and does not attack until it encounters the intruder at close range. Data are mean ± SEM. n=number of animals.
Extended Data Figure 5
Extended Data Figure 5. Photostimulation of VMHvl Esr1+ neurons in females evokes close investigation and mounting
a-b. Representative raster plots illustrating photostimulation-evoked behaviors in Esr1cre/+ females expressing either ChR2 (a) or EGFP (b) in VMHvl towards an intact male (upper), a castrated male (middle), or an intact female (lower). Note that CI (yellow rasters) is augmented during photostimulation in the animal expressing ChR2, but not in the animal expressing EGFP. c-d. Quantification of CI by Esr1cre/+ females expressing EGFP (blue bars; n=4 per intruder) or ChR2 (red bars; n=3 per intruder) during 30 s prior to photostimulation (open symbols) vs. during 30 s photostimulation period (solid symbols). *p<0.05, **p<0.01, ***p<0.001; two-way ANOVA with Tukey's multiple comparisons test. e. Raster plot illustrating that photostimulation of Esr1cre/+ female expressing ChR2 evokes mounting (green rasters), but failed to elicit male-like aggression. f-g. Quantification of mounting parameters by Esr1cre/+ females expressing EGFP (open bars; n=4 per intruder) or ChR2 (black bars; n=3 per intruder) towards the indicated intruders. Two-way ANOVA with Tukey's multiple comparisons test, *p=0.02 (f) and *p=0.03 (g) without correction for multiple comparisons, but not significant when corrected (p=0.07 (f), and p=0.06 (g)). Data are mean ± SEM. n=number of animals.
Extended Data Figure 6
Extended Data Figure 6. CI and mounting are evoked at lower photostimulation intensities than attack
a-b. The average threshold intensity of photostimulation that evokes close investigation (CI) is similar to that required to evoke mounting (b), but significantly lower than that required to evoke attack (a). Data represent ChR2-expressing Esr1cre/+ males that exhibited CI and attack (a, n=12 per group) or CI and mounting (b, n=9 per group) in a given test session. **p<0.01; Mann-Whitney U-test. Data are mean ± SEM. n=number of animals. c-d. Raster plot from a test session with the same resident male, showing that activation of VMHvl Esr1+ neurons elicits mounting and/or attack towards a castrated male intruder, dependent upon the intensity of photostimulation. c. A raster plot illustrating the experiment shown in Supplementary Video 6. Mounting (green rasters) was elicited in a ChR2-expressing Esr1cre/+ male toward an unreceptive intact female during photostimulation trials (blue bars; 30 s). Note that mounting was followed by attack (red rasters) in the high intensity photostimulation trials (3.7 mW/mm2). d. A raster plot illustrating a shift in behavioral responses from mounting to attack toward a castrated male intruder dependent upon photostimulation intensity (see Fig. 4a for the behavioral shift toward a female intruder). Note that time line is not continuous at the breakage in the line under rasters.
Extended Data Figure 7
Extended Data Figure 7. Optogenetic silencing of VMHvl Esr1+ neurons does not affect reproductive behaviors towards females
a-d. Quantification of female-directed mating behaviors during photostimulation of Esr1cre/+ males expressing mCherry (n=4-5) or eNpHR3.0 (n=14-17). a-b and d. Parameters of reproductive behaviors during photostimulation trials (3 min) were normalized to those during non-stimulated periods. c. The latency from the onset of photostimulation to the first mounting. n.s.=not significant; Mann-Whitney U-test. Data are mean ± SEM. n=number of animals.
Extended Data Figure 8
Extended Data Figure 8. Relationship between behavioral response and photostimulation frequency
Behaviors evoked by optogenetic activation of ChR2-expressing Esr1cre/+ males at the indicated photostimulation frequencies are plotted (5, 10, and 20 Hz). Different photostimulation intensities were applied in different episodes (colored lines). In each episode, photostimulation frequency was varied at a fixed intensity. Only 2/14 stimulation episodes (orange) exhibited a behavioral shift from mounting to mixed to attack behaviors with increasing photostimulation frequency. Data from n=11 animals.
Extended Data Figure 9
Extended Data Figure 9. An example of hysteresis
A representative raster plot illustrating a shift from mounting (0.3 mW/mm2) to attack (0.6 mW/mm2) with increasing photostimulation intensity. Note that once attack was elicited, reducing the photostimulation intensity back to 0.3 mW/mm2 no longer evoked mounting, but simply failed to elicit attack. Whether this hysteresis is intrinsic to the animal, or represents a form of conditioning, is not clear.
Extended Data Figure 10
Extended Data Figure 10. Two alternative models to explain how activation of Esr1+ neurons in VMHvl can promote mounting and attack depending on conditions
See Supplementary Note 2.
Figure 1
Figure 1. Generation and characterization of a knock-in mouse line expressing Cre recombinase in Esr1+ cells
a. Strategy for targeting the Esr1 locus. H: HindIII, 3′ UTR: 3′ untranslated region, 2A: F2A sequence, Pgk: phosphoglycerate kinase promoter, neo: neomycin-resistance gene, pA: polyadenylation signal. b. Southern blot of HindIII-digested genomic DNA from two correctly targeted Esr1cre/+ embryonic stem cell lines. Wild-type (10.2 kb) and targeted (4.6 kb) alleles are revealed bya 3′ probe (a). c-h. In situ hybridization for Esr1mRNA in wild-type male (c, f, images obtained from Allen Mouse Brain Atlas, Bregma -1.75 mm) and for Cre mRNA in Esr1cre/+ male (d, g) and female (e, h) mice (Bregma -1.65 mm). VMHvl, ventrolateral subdivision of the ventromedial hypothalamus; ARH, arcuate nucleus. Dotted outline indicates VMH. i-x1. Immuno-staining for Esr1 protein (red) in wild-type (i, male; j, female) and Esr1cre/+ female mice (s, u, w, w1). k-x1. Native fluorescence of Cre-dependent AAV-encoded markers in Esr1cre/+ male (k-p, tdTomato) and female (r-x1, EGFP) mice. v1-x1 are the boxed areas in v-x. q, y. Quantification of k-p (q, n=1) and r-x1 (y, n=4). Data are mean ± SEM. n=number of animals in this and all figures unless otherwise indicated.
Figure 2
Figure 2. Esr1+ cells in VMHvl are necessary and sufficient for aggression
a. Strategy for optogenetic activation of Esr1+ cells in VMHvl. EF1α, elongation factor 1α promoter; ChR2 is V5 epitope-tagged. b-d. Whole-cell patch clamp recording from Esr1+ cells in VMHvl (c, EYFP+ cell) in acute hypothalamic slices. Photostimulation-evoked spiking (d, upper) and quantification of spike fidelity (d, lower) are shown (filled circles, 2 ms light pulse-width, n=11 cells; open circles, 20 ms pulse-width, n=5 cells). e-j. Double-labeling for Cre-dependent hrGFP viral reporter (e, h) and c-Fos (f, i) in VMHvl of Esr1cre/+ males following photostimulation; h-j, boxed areas indicated in e-g. k. Quantification of (e-j) (mCherry, n=5; ChR2, n=10; ***p<0.001; Mann-Whitney U-test). l, m. Representative raster plots (l) and video stills (m) illustrating photostimulation-evoked (blue bars; mW/mm2) attack (l, red rasters) or close investigation (CI, yellow rasters) byChR2-expressing Esr1cre/+ males (m, black mice), toward a castrated male (”♂”; l, m, upper) or an intact female (l, m, lower). See Supp. Video 1. n-q. Quantification of attack parameters towards castrated males (ChR2, n, n=33; o, n=23; p-q, n=11; mCherry, n, n=14) or females (ChR2, n, n=28; o. n=22; p-q. n=16; mCherry, n, n=10). r. Photoactivation of Esr1- cells using “Cre-out” ChR2 rAAV. s. Percentage of wild-type (WT; n=4) and Esr1cre/+(n=9) males showing photostimulated attack toward castrated males (see ED Fig. 3b, c). t. Expression of eNpHR3.0 in VMHvl Esr1+ neurons. u. Whole-cell patch clamp recording in acute hypothalamic slices, showing photostimulation-induced suppression of current injection-evoked spiking in eNpHR3.0-mCherry expressing Esr1+ cells. v. Representative raster plots illustrating effect of photostimulation on attack towards a male intruder. w-y. Quantification of behavioral parameters (mCherry, n=10; eNpHR3.0, n=13; ****p<0.0001; Mann-Whitney U-test). z. Percentage of photostimulation trials in which approach to intruder led to attack (mCherry, n=7; eNpHR3, n=4; **p<0.01; Mann-Whitney U-test). Data are mean ± SEM (d, k, o, z) or median ± min and max values (p-q, w-y).
Figure 3
Figure 3. Esr1+ cells in VMHvl mediate close investigation (CI) and mounting behaviors
a, b. Representative raster plots (a) and video stills (b) illustrating photostimulation-evoked mounting (a, green rasters; b, right) or CI (a, yellow rasters; b, left) in ChR2-expressing Esr1cre/+ males towards intruders of the indicated sex. c, d. Number (c) and duration (d) of CI episodes performed by males expressing mCherry (blue bars) or ChR2 (red bars), before (open bars) or during (filled bars) photostimulation, towards intruder males (n=4 each), castrated males (n=14 and n=18, respectively) or females (n=10 and n=12). ***p<0.001; two-way ANOVA with Tukey's multiple comparisons test. e. Aggressive sniffing (“CI with nose pushing”) during photostimulation by Esr1cre/+ males expressing mCherry (open bars) or ChR2 (filled bars) towards intruder castrated males (n=14 and n=49, respectively) or females (n=12 and n=32). f. Percentage of CI episodes interrupted by photostimulation ofEsr1cre/+ males expressing mCherry (n=7) or eNpHR3.0 (n=3). *p<0.05; Mann-Whitney U-test. g. Percentage of Esr1cre/+ males expressing mCherry (open bars) or ChR2 (filled bars) showing photostimulation-evoked mounting towards intruder males (n=4 and n=8, respectively), castrated males (n=14 and n=35) or females (n=10 and n=28). h-k. Quantification of photostimulation-evoked mounting towards intruder males (n=4), castrated males (n=11) or intact females (n=11; i, mCherry, n=5) towards females. ***p<0.001;Mann-Whitney U-test. Data are mean ± SEM (c-d) or median ± min and max values (h-k).
Figure 4
Figure 4. Behavioral responses shift from mounting to attack depending upon photostimulation intensity and the number of activated cells in VMHvl
a-b. Representative raster plots (a) and images (b) illustrating shift from mounting to attack with increasing photostimulation intensity. c-d. Threshold photostimulation intensities evoking mounting, mixed or attack behavior (c, n=11), or (d) the relative percentage of those behaviors evoked by the indicated intensity range (n in bars). Data are from test sessions exhibiting multiple behaviors. **p<0.01, ****p<0.0001; two-way ANOVA with Tukey's multiple comparisons test. e. Proportion of photostimulation-evoked behaviors in animals injected with different amounts of AAV (100 vs. 300 nl), and incubated for different times post-injection (weeks). n within bars. Blue shading, mounting episodes with or without attack (“MT/MAT”). f-m. Double labeling for virally expressed hrGFP (f, j, h-i, l-m, native fluorescence) and photostimulation-induced c-Fos (g, k, i, m, anti-c-Fos, red) in solitary ChR2-expressing Esr1cre/+ males photostimulated 1 hr before sacrifice in their home cage, at an intensity that had previously evoked either mounting (f-i) or attack (j-m) several days earlier. i, m, boxed areas in h and l, respectively. n-o. Quantification of number of hrGFP+ (n) and c-Fos+ (o) cells in VMHvl across successive axial levels, following solitary photostimulation of “mounters” (green symbols, n=6) or “attackers” (red symbols, n=10), as in (f-m). Black symbols, no photostimulation prior to sacrifice (n=3). *p<0.05, ***p<0.001; two-way ANOVA with Tukey's multiple comparisons test. p-t. Two-photon Ca2+ imaging of acute hypothalamic slices expressing Cre-dependent ChR2-EYFP and Cre-independent GCaMP6s. p. Representative fluorescence images at the indicated time points and illumination power. q. Average Ca2+ transients in GCaMP6s+ cells with (purple trace, n=60) or without ChR2 (orange trace, n=48). Photostimulation (445 nm, 2-ms pulses, 20 Hz) was delivered for 10 s (blue bars in q). r. Percentage of GCaMP6s-expressing cells with ΔF/Fpeak>5 standard deviations from baseline, as a function of light power. *p<0.05; Pearson's Chi-square test. s. Normalized ΔF/Fpeak (purple) and ΔF/Farea (orange, integrated area under the curves in (q) during 30 s following photostimulation) as a function of light power, relative to cells activated at 4.8 mW (n=35). t. Number of activated cells × integrated activity per active cell, vs. laser power. s-t. *p<0.05, **p<0.01, ****p<0.0001; repeated measures one-way ANOVA. u, Percentage of c-Fos+ cells among Esr1+ neurons in VMHvl of wild-type animals following the indicated behaviors (control, n=3; CI, n=4; Mate, n=5; Fight, n=5). Data are mean ± SEM. n=number of animals (c-e, n-o, u) or cells (q-s).v. Threshold model for relationship between level of Esr1+ neuron activity and behavior. MT, mount only; MAT, mixed mount and attack; AT, attack only. See also Supplementary Note 2.

References

    1. Tinbergen N. Symposiua of the Society for Experimental Biology. IV. Academic Press, Inc.; 1950. Physiological Mechanisms in Animal Behaviour; pp. 305–312.
    1. Devidze N, Lee A, Zhou J, Pfaff D. CNS arousal mechanisms bearing on sex and other biologically regulated behaviors. Physiology & Behavior. 2006;88:283–293. doi: 10.1016/j.physbeh.2006.05.030. - DOI - PubMed
    1. Lin D, et al. Functional identification of an aggression locus in the mouse hypothalamus. Nature. 2011;470:221–226. doi: 10.1038/nature09736. - DOI - PMC - PubMed
    1. Lein ES, et al. Genome-wide atlas of gene expression in the adult mouse brain. Nature. 2007;445:168–176. doi: 10.1038/nature05453. - DOI - PubMed
    1. Morgan JI, Cohen DR, Hempstead JL, Curran T. Mapping patterns of c-fos expression in the central nervous system after seizure. Science. 1987;237:192–197. - PubMed

Publication types