

doi: 10.1038/psp.2014.6.
Revitalizing personalized medicine: respecting biomolecular complexities beyond gene expression
Affiliations
- PMID: 24739991
- PMCID: PMC4011166
- DOI: 10.1038/psp.2014.6
Item in Clipboard
Revitalizing personalized medicine: respecting biomolecular complexities beyond gene expression
CPT Pharmacometrics Syst Pharmacol.
.
Abstract
Despite recent advancements in "omic" technologies, personalized medicine has not realized its fullest potential due to isolated and incomplete application of gene expression tools. In many instances, pharmacogenomics is being interchangeably used for personalized medicine, when actually it is one of the many facets of personalized medicine. Herein, we highlight key issues that are hampering the advancement of personalized medicine and highlight emerging predictive tools that can serve as a decision support mechanism for physicians to personalize treatments.
Figures

Manifestation of DNA sequence to molecular phenotypes and cellular responses. Each step
in this process is confounded by several biochemical events that add dispersion and
uncertainty to the subsequent steps. As such, it would be highly unlikely for there to
exist a one-to-one relationship between a specific gene sequence and ultimate clinical
outcome.

A hypothetical case for dispersion of biomolecular information from gene expression to
molecular phenotype to cellular phenotype. For each specific gene variant (represented
as gene score), there is a distribution of molecular phenotype among the patient
population due to variations in random gene activation and repression, mRNA degradation,
translational noise, alternate splicing, and protein degradation arising at the
individual patient level. At the next level, for each value of molecular phenotype,
there is a distribution of cellular response in the population due to protein
phosphorylation, membrane drug efflux pumps, transportation limitations, and resistance
mechanisms in apoptotic pathways. Eventually, two patients having the same gene variant
might fall anywhere in the bivariate distribution in phenotype space. mRNA, messenger
RNA.

Depiction of a single gene expression and regulation. Every step in this process is
governed by stochastic biochemical events. The gene randomly transits between active and
repressed promoter state and hence mRNA is produced in bursts. A fraction of mRNA is
randomly degraded, and the rest is translated into protein. A fraction of protein also
undergoes decay stochastically. Reprinted with permission from Macmillan Publishers:
Nature Reviews Genetics.
copyright 2005. mRNA, messenger RNA.

Different levels of variation observed during 6-MP treatment. As one moves from gene
variant to clinical response, the downstream responses are dispersed for a given
upstream genotypic/phenotypic variant. (a) For a few TPMT gene variants, several
TPMT enzyme activities are observed on continuous scale in humans. (b) For a
specific gene variant, there is a huge variation in TPMT activity and possible overlap
with other gene variant. (c) Relationship between TPMT activity and 6-TGN
concentration; for a given range of TPMT activity, a huge variation in 6-TGN
concentration was observed. (d–f) Relationship between 6-TGN
concentration and cellular response; for a given 6-TGN concentration, substantial
dispersion in cellular responses were observed during 6-MP treatment. 6-MP,
6-mercaptopurine; 6-TGN, 6-thioguanine nucleotide; RBC, red blood cell;
TPMT, thiopurine S-methyltransferase; WBC, white blood cell.
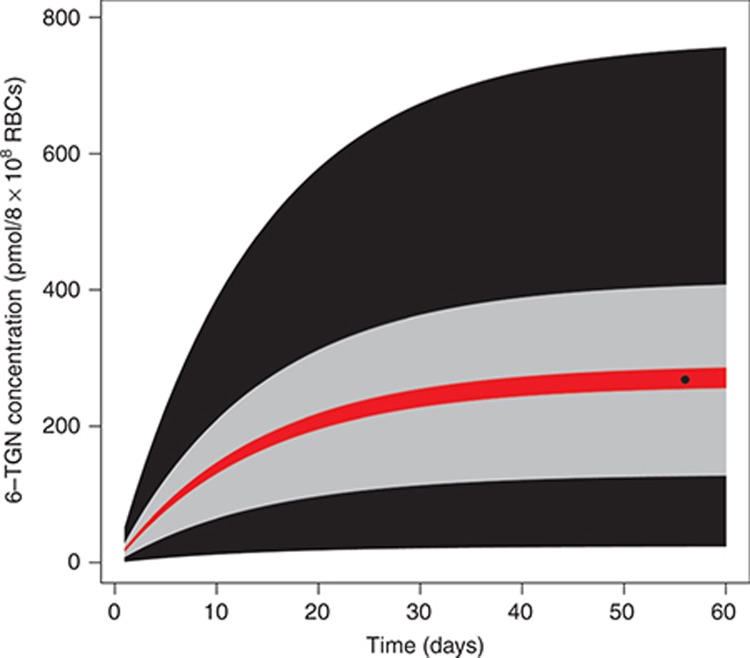
95% Confidence region for 6-TGN concentration predicted through nonparametric Bayesian
population modeling approach. Black region: CR prediction based on genotypic
information; gray: CR based on TPMT enzyme activity; red: CR based on 6-TGN
measurement; solid dot: 6-TGN measurement. 6-TGN, 6-thioguanine nucleotide; CR,
confidence region; RBCs, red blood cells; TPMT, thiopurine
S-methyltransferase.
References
-
- Lander E.S., et al. International Human Genome Sequencing Consortium Initial sequencing and analysis of the human genome. Nature. 2001;409:860–921. - PubMed
-
- Feuk L., Carson A.R., Scherer S.W. Structural variation in the human genome. Nat. Rev. Genet. 2006;7:85–97. - PubMed
-
- Lazarou J., Pomeranz B.H., Corey P.N. Incidence of adverse drug reactions in hospitalized patients: a meta-analysis of prospective studies. JAMA. 1998;279:1200–1205. - PubMed
-
- Ernst F.R., Grizzle A.J. Drug-related morbidity and mortality: updating the cost-of-illness model. J. Am. Pharm. Assoc. (Wash) 2001;41:192–199. - PubMed
LinkOut - more resources
Full Text Sources
Other Literature Sources
