

Control of intermale aggression by medial prefrontal cortex activation in the mouse
- PMID: 24740241
- PMCID: PMC3989250
- DOI: 10.1371/journal.pone.0094657
Control of intermale aggression by medial prefrontal cortex activation in the mouse
Abstract
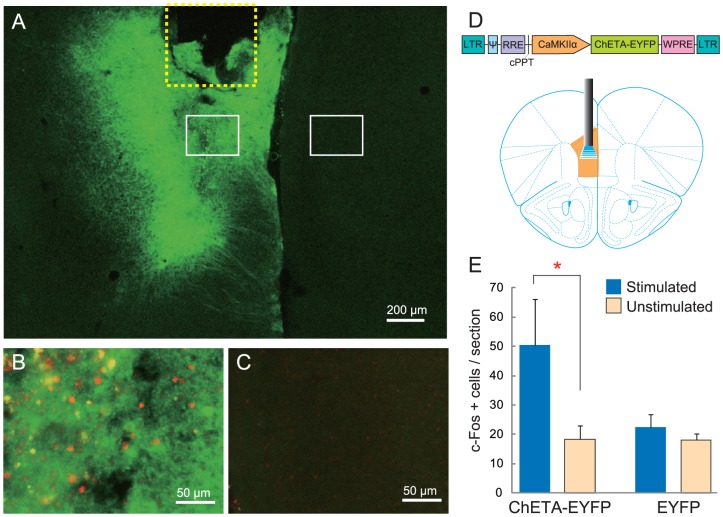
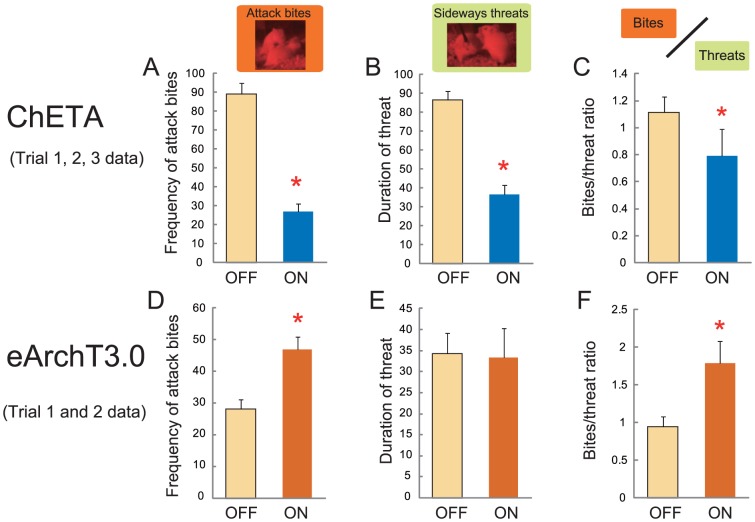
Aggressive behavior is widely observed throughout the animal kingdom because of its adaptiveness for social animals. However, when aggressive behavior exceeds the species-typical level, it is no longer adaptive, so there should be a mechanism to control excessive aggression to keep it within the adaptive range. Using optogenetics, we demonstrate that activation of excitatory neurons in the medial prefrontal cortex (mPFC), but not the orbitofrontal cortex (OFC), inhibits inter-male aggression in mice. At the same time, optogenetic silencing of mPFC neurons causes an escalation of aggressive behavior both quantitatively and qualitatively. Activation of the mPFC suppresses aggressive bursts and reduces the intensity of aggressive behavior, but does not change the duration of the aggressive bursts. Our findings suggest that mPFC activity has an inhibitory role in the initiation and execution, but not the termination, of aggressive behavior, and maintains such behavior within the adaptive range.
Conflict of interest statement
Figures


Similar articles
-
Task Division within the Prefrontal Cortex: Distinct Neuron Populations Selectively Control Different Aspects of Aggressive Behavior via the Hypothalamus.J Neurosci. 2018 Apr 25;38(17):4065-4075. doi: 10.1523/JNEUROSCI.3234-17.2018. Epub 2018 Feb 27. J Neurosci. 2018. PMID: 29487128 Free PMC article.
-
Cell-Type-Specific Contributions of Medial Prefrontal Neurons to Flexible Behaviors.J Neurosci. 2018 May 9;38(19):4490-4504. doi: 10.1523/JNEUROSCI.3537-17.2018. Epub 2018 Apr 12. J Neurosci. 2018. PMID: 29650697 Free PMC article.
-
Structural and functional alterations in the prefrontal cortex after post-weaning social isolation: relationship with species-typical and deviant aggression.Brain Struct Funct. 2017 May;222(4):1861-1875. doi: 10.1007/s00429-016-1312-z. Epub 2016 Sep 23. Brain Struct Funct. 2017. PMID: 27664119
-
Genetic analysis of different kinds of aggressive behavior.Behav Genet. 1993 Sep;23(5):491-7. doi: 10.1007/BF01067985. Behav Genet. 1993. PMID: 8267559 Review.
-
Neurogenetics of aggressive behavior: studies in rodents.Curr Top Behav Neurosci. 2014;17:3-44. doi: 10.1007/7854_2013_263. Curr Top Behav Neurosci. 2014. PMID: 24318936 Free PMC article. Review.
Cited by
-
Elevated reactive aggression in forebrain-specific Ccn2 knockout mice.J Cell Commun Signal. 2024 Jul 20;18(3):e12040. doi: 10.1002/ccs3.12040. eCollection 2024 Sep. J Cell Commun Signal. 2024. PMID: 39524137 Free PMC article.
-
Chronic social stress during early development elicits unique behavioral changes in adulthood.Encephalitis. 2022 Apr;2(2):45-53. doi: 10.47936/encephalitis.2021.00178. Epub 2022 Mar 11. Encephalitis. 2022. PMID: 37469652 Free PMC article.
-
Social Suppressive Behavior Is Organized by the Spatiotemporal Integration of Multiple Cortical Regions in the Japanese Macaque.PLoS One. 2016 Mar 10;11(3):e0150934. doi: 10.1371/journal.pone.0150934. eCollection 2016. PLoS One. 2016. PMID: 26963915 Free PMC article.
-
Three-Year Assault Cases Performed on the Emergency Trauma Center.Medeni Med J. 2024 Dec 27;39(4):293-301. doi: 10.4274/MMJ.galenos.2024.61426. Medeni Med J. 2024. PMID: 39726801 Free PMC article.
-
Aggression Unleashed: Neural Circuits from Scent to Brain.Brain Sci. 2024 Aug 8;14(8):794. doi: 10.3390/brainsci14080794. Brain Sci. 2024. PMID: 39199486 Free PMC article. Review.
References
-
- Nelson RJ, Trainor BC (2007) Neural mechanisms of aggression. Nat. Rev. Neurosci 8: 536–546. - PubMed
-
- Davidson RJ, Putnam KM, Larson CL (2000) Dysfunction in the Neural Circuitry of Emotion Regulation–A Possible Prelude to Violence. Science 289: 591–594. - PubMed
-
- Hoover WB, Vertes RP (2011) Projections of the medial orbital and ventral orbital cortex in the rat. J. Comp. Neurol 519: 3766–3801. - PubMed
-
- Vertes RP (2004) Differential projections of the infralimbic and prelimbic cortex in the rat. Synapse 51: 32–58. - PubMed
-
- Gabbott PLA, Warner TA, Jays PRL, Salway P, Busby SJ (2005) Prefrontal cortex in the rat: projections to subcortical autonomic, motor, and limbic centers. J. Comp. Neurol 492: 145–177. - PubMed
Publication types
MeSH terms
Substances
LinkOut - more resources
Full Text Sources
Other Literature Sources
Research Materials
