

A population pharmacodynamic model for lactate dehydrogenase and neuron specific enolase to predict tumor progression in small cell lung cancer patients
- PMID: 24740245
- PMCID: PMC4012048
- DOI: 10.1208/s12248-014-9600-0
A population pharmacodynamic model for lactate dehydrogenase and neuron specific enolase to predict tumor progression in small cell lung cancer patients
Abstract
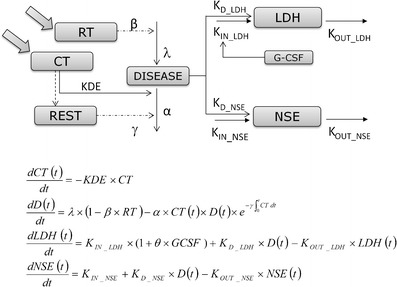
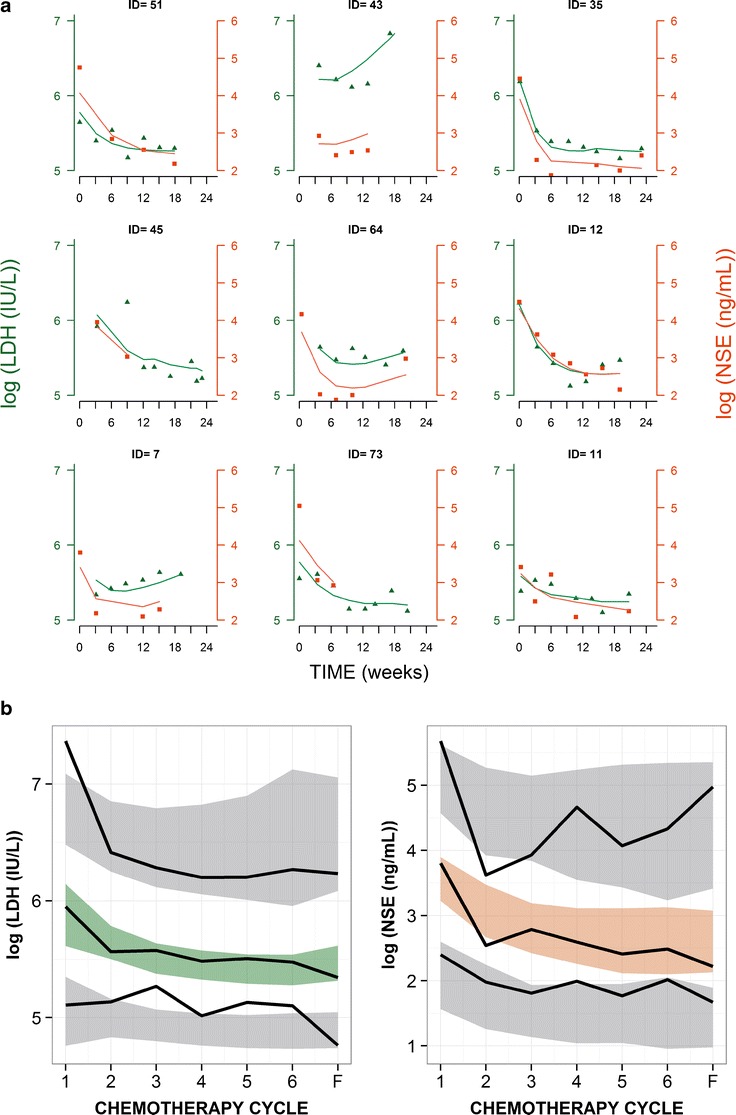
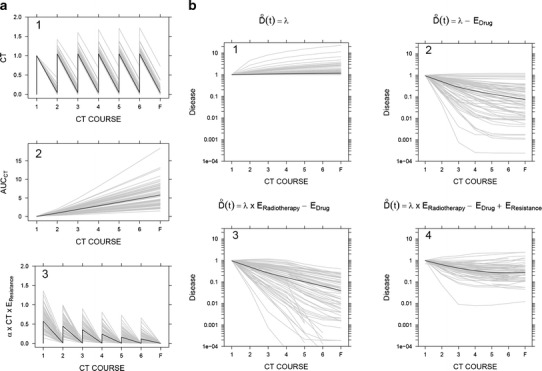
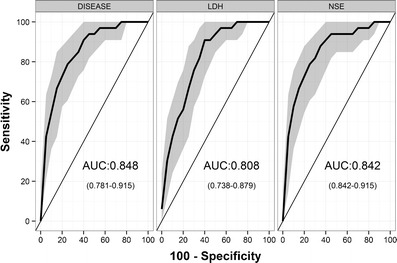
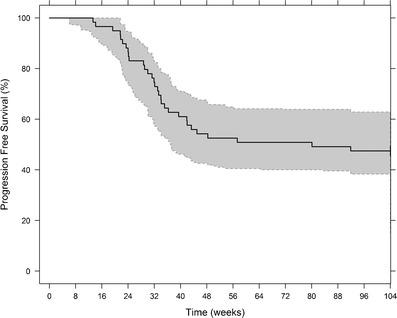
The development of individualized therapies poses a major challenge in oncology. Significant hurdles to overcome include better disease monitoring and early prediction of clinical outcome. Current clinical practice consists of using Response Evaluation Criteria in Solid Tumors (RECIST) to categorize response to treatment. However, the utility of RECIST is restricted due to limitations on the frequency of measurement and its categorical rather than continuous nature. We propose a population modeling framework that relates circulating biomarkers in plasma, easily obtained from patients, to tumor progression levels assessed by imaging scans (i.e., RECIST categories). We successfully applied this framework to data regarding lactate dehydrogenase (LDH) and neuron specific enolase (NSE) concentrations in patients diagnosed with small cell lung cancer (SCLC). LDH and NSE have been proposed as independent prognostic factors for SCLC. However, their prognostic and predictive value has not been demonstrated in the context of standard clinical practice. Our model incorporates an underlying latent variable ("disease level") representing (unobserved) tumor size dynamics, which is assumed to drive biomarker production and to be influenced by exposure to treatment; these assumptions are in agreement with the known physiology of SCLC and these biomarkers. Our model predictions of unobserved disease level are strongly correlated with disease progression measured by RECIST criteria. In conclusion, the proposed framework enables prediction of treatment outcome based on circulating biomarkers and therefore can be a powerful tool to help clinicians monitor disease in SCLC.
Figures
Similar articles
-
Comparison of Tc-99m sestamibi, serum neuron-specific enolase and lactate dehydrogenase as predictors of response to chemotherapy in small cell lung cancer.Cancer Biother Radiopharm. 2000 Aug;15(4):381-6. doi: 10.1089/cbr.2000.15.381. Cancer Biother Radiopharm. 2000. PMID: 11041023 Clinical Trial.
-
Serum neuron-specific enolase (S-NSE) in progressive small-cell lung cancer (SCLC).Br J Cancer. 1994 Oct;70(4):759-61. doi: 10.1038/bjc.1994.391. Br J Cancer. 1994. PMID: 7917935 Free PMC article. Clinical Trial.
-
[Pre-treatment and treatment-induced neuron-specific enolase in patients with small-cell lung cancer: an open prospective study].Arch Bronconeumol. 2010 Jul;46(7):364-9. doi: 10.1016/j.arbres.2010.04.005. Epub 2010 May 27. Arch Bronconeumol. 2010. PMID: 20537457 Clinical Trial. Spanish.
-
Ifosfamide in the treatment of small cell lung cancer.Semin Oncol. 1996 Jun;23(3 Suppl 6):2-6. Semin Oncol. 1996. PMID: 8677443 Review.
-
[Carboplatin plus irinotecan induced partial response in a patient with small cell carcinoma of the prostate; a case report].Hinyokika Kiyo. 2014 Jan;60(1):39-43. Hinyokika Kiyo. 2014. PMID: 24594772 Review. Japanese.
Cited by
-
Assessing the impact of the addition of dendritic cell vaccination to neoadjuvant chemotherapy in breast cancer patients: A model-based characterization approach.Br J Clin Pharmacol. 2019 Aug;85(8):1670-1683. doi: 10.1111/bcp.13947. Epub 2019 Jun 14. Br J Clin Pharmacol. 2019. PMID: 30933365 Free PMC article.
-
Drug Exposure to Establish Pharmacokinetic-Response Relationships in Oncology.Clin Pharmacokinet. 2020 Feb;59(2):123-135. doi: 10.1007/s40262-019-00828-3. Clin Pharmacokinet. 2020. PMID: 31654368 Review.
-
Latent variable modeling improves AKI risk factor identification and AKI prediction compared to traditional methods.BMC Nephrol. 2017 Feb 8;18(1):55. doi: 10.1186/s12882-017-0465-1. BMC Nephrol. 2017. PMID: 28178929 Free PMC article.
-
The role of oxygen intake and liver enzyme on the dynamics of damaged hepatocytes: Implications to ischaemic liver injury via a mathematical model.PLoS One. 2021 Apr 22;16(4):e0230833. doi: 10.1371/journal.pone.0230833. eCollection 2021. PLoS One. 2021. PMID: 33886563 Free PMC article.
-
Systemic Exposure of Rituximab Increased by Ibrutinib: Pharmacokinetic Results and Modeling Based on the HELIOS Trial.Pharm Res. 2019 May 1;36(7):93. doi: 10.1007/s11095-019-2605-8. Pharm Res. 2019. PMID: 31044267 Clinical Trial.
References
Publication types
MeSH terms
Substances
LinkOut - more resources
Full Text Sources
Other Literature Sources
Medical
