. 2014 Apr 16;9(4):e89648.
doi: 10.1371/journal.pone.0089648. eCollection 2014.

Whole CMV proteome pattern recognition analysis after HSCT identifies unique epitope targets associated with the CMV status

Affiliations

Whole CMV proteome pattern recognition analysis after HSCT identifies unique epitope targets associated with the CMV status

Lena Pérez-Bercoff et al. PLoS One. .

Abstract

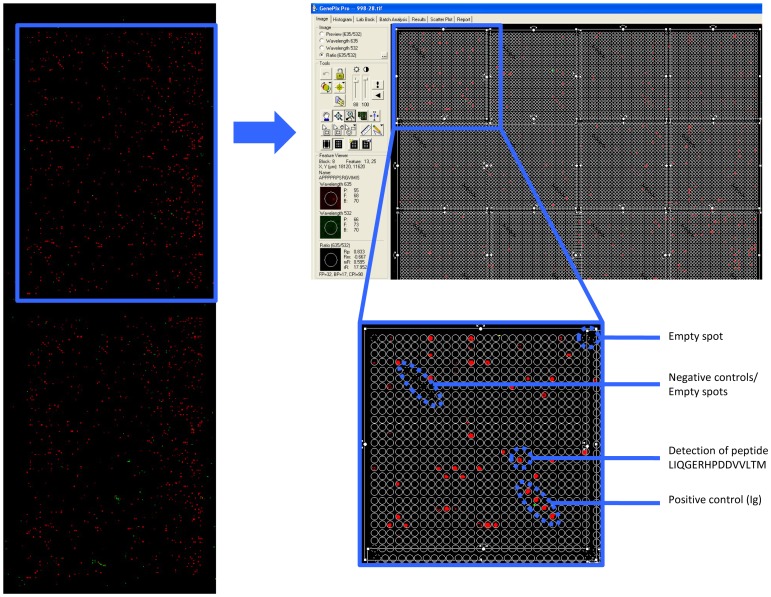
Cytomegalovirus (CMV) infection represents a vital complication after Hematopoietic Stem Cell Transplantation (HSCT). We screened the entire CMV proteome to visualize the humoral target epitope-focus profile in serum after HSCT. IgG profiling from four patient groups (donor and/or recipient +/- for CMV) was performed at 6, 12 and 24 months after HSCT using microarray slides containing 17174 of 15mer-peptides overlapping by 4 aa covering 214 proteins from CMV. Data were analyzed using maSigPro, PAM and the 'exclusive recognition analysis (ERA)' to identify unique CMV epitope responses for each patient group. The 'exclusive recognition analysis' of serum epitope patterns segregated best 12 months after HSCT for the D+/R+ group (versus D-/R-). Epitopes were derived from UL123 (IE1), UL99 (pp28), UL32 (pp150), this changed at 24 months to 2 strongly recognized peptides provided from UL123 and UL100. Strongly (IgG) recognized CMV targets elicited also robust cytokine production in T-cells from patients after HSCT defined by intracellular cytokine staining (IL-2, TNF, IFN and IL-17). High-content peptide microarrays allow epitope profiling of entire viral proteomes; this approach can be useful to map relevant targets for diagnostics and therapy in patients with well defined clinical endpoints. Peptide microarray analysis visualizes the breadth of B-cell immune reconstitution after HSCT and provides a useful tool to gauge immune reconstitution.


Conflict of interest statement

Competing Interests: The authors have the following interests. M.S. was employed for part of the duration of this study by JPT, the provider of the (peptide microarray) chips. There are no further patents, products in development or marketed products to declare. This does not alter their adherence to all the PLOS ONE policies on sharing data and materials, as detailed online in the guide for authors.

Figures

Figure 1
Figure 1. Overview of HCMV peptide microarray chip analysis.
The microarray chips (left) consists of two identical subarrays, each with 17496 spots arranged in 24 blocks of 729 spots arranged in columns and rows of 27. The peptide spots represented 17174 unique peptides, 305 positive control spots (4 repetitions each of IgG, IgA, IgM, and IgE) and 268 negative controls. Screenshot (right, top) and closeup (right, bottom) of empty spots, positive spots and a positive response, detecting an serum Ab-peptide complex.
Figure 2
Figure 2. Differential CMV peptide recognition after HSCT segregates with the CMV status of the donor and recipient.
Comparisons between serum reactivity in the D+ and D− groups and R+ and R− groups reflecting the number of CMV epitopes predicted by the ‘exclusive recognition analysis. Some peptides are uniquely recognized in serum from all individuals in each test group (but never in the control group, D−/R−). The list of epitopes is provided in Table 1.
Figure 3
Figure 3. PAM analysis segregates CMV epitope responses.
PAM visualizes the difference in antibody response against specific epitopes in different patient groups: distinct CMV epitope are always strongly recognized in one patient group, and always weakly recognized in the control group (or vice versa). Paradigm of weak antibody responses in patients in the D−R− group (black dots) in all patients, yet strong recognition in serum from all patients in the other serological groups (grey dots). A detailed listing of PAM-defined targets is provided in the Table S3.
Figure 4
Figure 4. Result of the microarray significant profiles analysis (MaSigPro).
a) Venn diagram with the number of significant peptides obtained in the three comparisons (each patient group vs. D−R−. The lists of peptides provided in the Table S5 represents the entire set of peptides contained in the Venn diagram. These peptides were also grouped into 9 clusters (default value) according to their recognition profile (see Table S5). b–c) Cluster analyses using CMV peptides that were differentially recognized in serum from patients, based on the D−/R− status. Three representative peptide clusters are reported, one for each analysis: D−R+ vs. D−R− (top), D+R− vs. D−R− (middle), D+R+ vs. D−R− (bottom). b) The consistency of the CMV epitope response in the cluster is visualized using the continuous peptide recognition profile across all the samples. Each peptide in the cluster is represented with a different color. c) The group-averaged CMV epitope recognition profiles (for different time points after HSCT) are shown to visualize differences (between the different patient groups) for CMV peptides selected in each cluster. Each group is represented with a different color (red = D−R−, green = D−R+, blue = D+R−, cyan = D+R+). Below the figures, peptides in the three clusters are listed. All the identified clusters and peptides are reported in the Table S4 in greater detail.
Figure 5
Figure 5. Analysis of polyfunctional T cells to previously defined CMV targets and targets defined by peptide array technology.
PBMCs were incubated for 6-2 (IL-2), interferon-γ (IFN-γ) and tumor necrosis factor-alpha, interleukin-17a (IL-17a) productions were measured by intracellular cytokine staining (ICS) on the single-cell level. The cytokine response of one representative individual is shown.

Similar articles

Cited by

References

    1. Ljungman P, Perez-Bercoff L, Jonsson J, Avetisyan G, Sparrelid E, et al. (2006) Risk factors for the development of cytomegalovirus disease after allogeneic stem cell transplantation. Haematologica 91: 78–83. - PubMed
    1. Weseslindtner L, Kerschner H, Steinacher D, Nachbagauer R, Kundi M, et al. (2012) Prospective Analysis of Human Cytomegalovirus DNAemia and Specific CD8+ T Cell Responses in Lung Transplant Recipients. Am J Transplant 12: 2172–2180. - PubMed
    1. Bunde T, Kirchner A, Hoffmeister B, Habedank D, Hetzer R, et al. (2005) Protection from cytomegalovirus after transplantation is correlated with immediate early 1-specific CD8 T cells. J Exp Med 201: 1031–1036. - PMC - PubMed
    1. Schoppel K, Schmidt C, Einsele H, Hebart H, Mach M (1998) Kinetics of the antibody response against human cytomegalovirus-specific proteins in allogeneic bone marrow transplant recipients. J Infect Dis 178: 1233–1243. - PubMed
    1. Ruutu T, Ljungman P, Brinch L, Lenhoff S, Lonnqvist B, et al. (1997) No prevention of cytomegalovirus infection by anti-cytomegalovirus hyperimmune globulin in seronegative bone marrow transplant recipients. The Nordic BMT Group. Bone Marrow Transplantation 19: 233–236. - PubMed

Publication types