High resolution, large deformation 3D traction force microscopy
- PMID: 24740435
- PMCID: PMC3989172
- DOI: 10.1371/journal.pone.0090976
High resolution, large deformation 3D traction force microscopy
Abstract
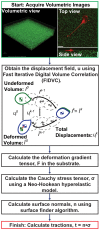
Traction Force Microscopy (TFM) is a powerful approach for quantifying cell-material interactions that over the last two decades has contributed significantly to our understanding of cellular mechanosensing and mechanotransduction. In addition, recent advances in three-dimensional (3D) imaging and traction force analysis (3D TFM) have highlighted the significance of the third dimension in influencing various cellular processes. Yet irrespective of dimensionality, almost all TFM approaches have relied on a linear elastic theory framework to calculate cell surface tractions. Here we present a new high resolution 3D TFM algorithm which utilizes a large deformation formulation to quantify cellular displacement fields with unprecedented resolution. The results feature some of the first experimental evidence that cells are indeed capable of exerting large material deformations, which require the formulation of a new theoretical TFM framework to accurately calculate the traction forces. Based on our previous 3D TFM technique, we reformulate our approach to accurately account for large material deformation and quantitatively contrast and compare both linear and large deformation frameworks as a function of the applied cell deformation. Particular attention is paid in estimating the accuracy penalty associated with utilizing a traditional linear elastic approach in the presence of large deformation gradients.
Conflict of interest statement
Figures

 m.
m.
 and
and  cross-sections of the calculated 3D displacement gradient for (A) a Schwann cell (scale bar = 40
  m), (B) a polymorphonuclear leukocyte (scale bar = 20
  m) and (C) a NIH 3T3 fibroblast (scale bar = 20
  m). (D) Total force (
 ), root mean squared tractions (
 ) and maximum traction (
 ) ratios plotted against the displacement gradient, under the application of a 3D Gaussian-shaped displacement field (inset). The numerator in the ratios is calculated using the new large deformation approach, whereas the denominator features the results from the traditional linear elastic, small deformation material approximation.
 , at time
  , into a deformed configuration,
  , at time
  . (B) Angle change between the undeformed and deformed surface normals in (A)
  and
and  , under the application of a cell-simulated Gaussian displacement field profile. The x-axis denotes the maximum value of the full-field 3D displacement gradient magnitude. The dot product represents the cosine of the angle between the two surface vectors. LSCM
  cross-sectional images (C) in the absence of a cell, and (D) directly underneath a locomoting Schwann cell. Scale bars = 5
  m.
m.
 , and (B) displacement gradient magnitude,
  . Profiles of calculated maximum 3D principal strains calculated from the (C) infinitesimal (
 ) and (D) Lagrangian (
 ) strains. The corresponding traction magnitudes calculated on the (E) undeformed surface,
  , using a linear elastic constitutive model,
  , and on (F) the deformed surface,
  using a large deformation (LD) constitutive model
  . Scale bars = 40
  m.
m.

 , and its (B) resulting displacement gradient magnitude, (
 ). Calculated maximum principal strains from the (C) infinitesimal (
 ), and (D) Lagrangian (
 ) strains. The corresponding traction magnitudes calculated on the (E) undeformed surface,
  , using a linear elastic constitutive model,
  , and on the (F) deformed surface,
  using a large deformation (LD) constitutive model
  . Cell outlines are shown in white. Scale bars = 40
  m.
m.


 m.
m.References
-
- Paszek MJ, Zahir N, Johnson KR, Lakins JN, Rozenberg GI, et al. (2005) Tensional homeostasis and the malignant phenotype. Cancer Cell 8: 241–254. - PubMed
-
- Butler JP, Tolic-Norrelykke IM, Fabry B, Fredberg JJ (2002) Traction fields, moments, and strain energy that cells exert on their surroundings. American Journal of Physiology-Cell Physiology 282: C595–C605. - PubMed
Publication types
MeSH terms
Grants and funding
LinkOut - more resources
Full Text Sources
Other Literature Sources

