. 2014 May 15;192(10):4541-50.
doi: 10.4049/jimmunol.1301390. Epub 2014 Apr 16.

Tissue-resident exhausted effector memory CD8+ T cells accumulate in the retina during chronic experimental autoimmune uveoretinitis

Affiliations

Tissue-resident exhausted effector memory CD8+ T cells accumulate in the retina during chronic experimental autoimmune uveoretinitis

Joanne Boldison et al. J Immunol. .

Abstract

Experimental autoimmune uveoretinitis is a model for noninfectious posterior segment intraocular inflammation in humans. Although this disease is CD4(+) T cell dependent, in the persistent phase of disease CD8(+) T cells accumulate. We show that these are effector memory CD8(+) T cells that differ from their splenic counterparts with respect to surface expression of CD69, CD103, and Ly6C. These retinal effector memory CD8(+) T cells have limited cytotoxic effector function, are impaired in their ability to proliferate in response to Ag-specific stimulation, and upregulate programmed death 1 receptor. Treatment with fingolimod (FTY720) during the late phase of disease revealed that retinal CD8(+) T cells were tissue resident. Despite signs of exhaustion, these cells were functional, as their depletion resulted in an expansion of retinal CD4(+) T cells and CD11b(+) macrophages. These results demonstrate that, during chronic autoimmune inflammation, exhausted CD8(+) T cells become established in the local tissue. They are phenotypically distinct from peripheral CD8(+) T cells and provide local signals within the tissue by expression of inhibitory receptors such as programmed death 1 that limit persistent inflammation.


Figures

FIGURE 1.
FIGURE 1.
CD8+ T cells accumulate in the late phase of EAU. Mice were immunized to induce EAU, after which disease progression was monitored by TEFI and retinal infiltrate characterized by flow cytometry on different days postimmunization. (A) Representative TEFI images. Mice display classic EAU features indicated by white arrowheads, including inflamed optic disc (day 23 image), vasculitis (day 30 image), and choroidal lesions (day 35 image). The optic disc has a diameter of ~220 μm. (B) EAU disease scores for retinas from different days postimmunization. Black line represents the mean score. (CE) Average cell number per retina pooled from different days during EAU for CD45+ (C), CD4+ (D), and CD8+ (E) populations. Data expressed as mean ± SEM. Data are the combination of three independent experiments. Each time point includes a minimum of 23 retinas. (F and G) Ratios of cell numbers per retina at different time points calculated for CD4:CD45 (F) and CD8:CD45 (G). Box and whisker plots show median, 25th and 75th percentile, and range. (H) Percentage of CD8+CD3+ T cells in the spleen. (I) Pie charts represent the average percentages of various retinal cell subpopulations (CD4, B220, NK1.1, and CD8) within the CD11b parent population. CD11b populations (pink) were negative for all markers used. All cells were gated on 7AADCD45+ populations. *p < 0.05, ***p < 0.001.
FIGURE 2.
FIGURE 2.
CD8+ T cells are localized throughout the retina. Representative images of immunohistochemistry performed on retinal sections from mice (n = 7) with EAU at day 26 and day 40 postimmunization show CD8+ staining (red) with DAPI counterstain (blue). Staining is prominent around regions of vasculitis, marked intraretinal infiltration, and structural damage. Scale bar, 50 μm.
FIGURE 3.
FIGURE 3.
Retinal CD8+ T cells show Ag-specific activation. Mice were immunized for EAU, and, at day 40 postimmunization, retinas and spleen were taken to measure proliferation by CFSE dilution (A and B) or IFN-γ intracellular cytokine staining (C and D) following stimulation with RBP-31–20 peptide or OVA peptide. All retinal cells were cultured with allelically marked irradiated APCs, which were subsequently gated out from the analysis. Splenocytes stimulated with PMA/ionomycin were used as a positive control. (A) Geometric mean fluorescent intensity (GMFI) for CD3 receptor (B) shows percentage proliferation of CD8+ T cells. (C) Representative flow cytometry plots of IFN-γ production from CD8+ T cells. (D) Average percentage of IFN-γ–producing CD8+ T cells from the retina. All cells gated on live CD8+CD3+ populations. Data represent three independent experiments, with at least two mice in each experiment. Data expressed as mean ± SEM. *p < 0.05, **p < 0.01. ns, not significant.
FIGURE 4.
FIGURE 4.
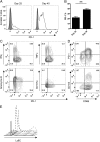
Phenotype of retinal CD8+ T cells. Mice were immunized for EAU, and, at different time points, CD8+ T cells were examined for the indicated markers. After dissection, retinas were pooled together before analysis, at least three retinas per experiment. (A) Representative flow cytometry plots of CD8+ T cells isolated from the spleen (gray filled histograms) and the retina (black histograms). CD44 and CD62L markers were gated on CD8+CD3+ cells; CD69, Ly6C, and CD103 markers were gated on CD8+CD3+CD44highCD62Llow populations. (B and C) Average cell percentage for CD8+ T cells prepared from the retina for surface markers (B) and cytotoxic markers and cytokine expression (C). Data represent at least three independent experiments at each time point. Data expressed as mean ± SEM. *p < 0.05.
FIGURE 5.
FIGURE 5.
Upregulation of PD-1 correlates with a lack of effector function. CD8+ T cells isolated from the spleen or the retina from mice with EAU were examined by flow cytometry at 25 or 40 d postimmunization. After dissection, retinas were pooled together before analysis, at least three retinas per experiment. (A) Representative plots of the percentage of PD-1 expression on CD8+CD3+ cells in the spleen (gray filled histogram) and the retina (black histogram). (B) Combined retinal CD8+CD3+ T cell percentages for PD-1 expression. Data expressed as mean ± SEM. Data are representative of at least three independent experiments at each time point. (CE) Retinal CD8+CD3+ T cells were examined on day 40 postimmunization for (C) cytokine and cytotoxic markers against PD-1 expression. (D) CD69 and PD-1 expression (top panel) and PD-1+ cells analyzed for CD69 and CD103 expression (bottom panel). (E) Ly6C expression from CD69PD-1 (dashed grey), CD69+PD-1 (dashed black), CD69PD-1+ (solid grey), and CD69+PD-1+ (solid black). Representative flow cytometry plots are shown. **p < 0.01.
FIGURE 6.
FIGURE 6.
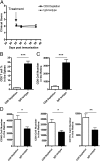
FTY720 treatment during chronic EAU reveals tissue residency of CD8+ T cells. Mice were immunized to induce EAU, and eyes were monitored by TEFI from day 30 onward. Groups of mice were treated with 0.3 mg/kg of either FTY720 or AAL149 (analog control) on day 35, and then every 24 h thereafter for 8 d. Peripheral blood, splenocytes, and retina were characterized and quantified 24 h after final treatment. (A) TEFI disease scores for each treatment group. (B and C) Average cell numbers for both treatment groups day 9 after treatment. (B) CD4+ and CD8+ T cells in peripheral blood (left panel) and the spleen (right panel). (C) CD8+, CD4+, and CD11b+ cells in the retina. (D) CD8+CD69+ and CD8+CD69 cell numbers in the retina. Data represent two independent experiments. Each treatment has a minimum of 18 retinas. Data expressed as mean ± SEM. *p < 0.05, **p < 0.01, ***p < 0.001. ns, not significant.
FIGURE 7.
FIGURE 7.
Retinal CD8+ T cells control local retinal infiltrate. Mice were immunized for EAU, and eyes were monitored by TEFI from day 30 onward. Groups of mice were treated with 250 μg of either CD8 depletion Abs or IgG isotype control on day 35 postimmunization for 4 d before quantification of cell populations by flow cytometry. (A) TEFI disease scores for each treatment group. (B) CD8+ T cell percentage in the spleen. (C and D) Average cell numbers in the retina for both treatment groups 4 d after treatment. (C) CD8+ T cells. (D) Total CD45+ cells, CD4+ T cells, and CD11b+ cells. Data represent four independent experiments; each treatment has a minimum of 16 retinas. Data expressed as mean ± SEM. *p < 0.05, **p < 0.01, ***p < 0.001.

References

    1. Imrie F. R., Dick A. D. 2007. Biologics in the treatment of uveitis. Curr. Opin. Ophthalmol. 18: 481–486. - PubMed
    1. Avichezer D., Silver P. B., Chan C. C., Wiggert B., Caspi R. R. 2000. Identification of a new epitope of human IRBP that induces autoimmune uveoretinitis in mice of the H-2b haplotype. Invest. Ophthalmol. Vis. Sci. 41: 127–131. - PubMed
    1. Kerr E. C., Raveney B. J., Copland D. A., Dick A. D., Nicholson L. B. 2008. Analysis of retinal cellular infiltrate in experimental autoimmune uveoretinitis reveals multiple regulatory cell populations. J. Autoimmun. 31: 354–361. - PubMed
    1. Chen, M., D. A. Copland, J. Zhao, J. Liu, J. V. Forrester, A. D. Dick, and H. Xu. 2012. Persistent inflammation subverts thrombospondin-1-induced regulation of retinal angiogenesis and is driven by CCR2 ligation. Am. J. Pathol. 180: 235-245. - PubMed
    1. Forrester J. V., Huitinga I., Lumsden L., Dijkstra C. D. 1998. Marrow-derived activated macrophages are required during the effector phase of experimental autoimmune uveoretinitis in rats. Curr. Eye Res. 17: 426–437. - PubMed

Publication types

MeSH terms

Substances