. 2014 Sep;63(9):3047-56.
doi: 10.2337/db13-1366. Epub 2014 Apr 16.

Diabetes irreversibly depletes bone marrow-derived mesenchymal progenitor cell subpopulations

Affiliations

Diabetes irreversibly depletes bone marrow-derived mesenchymal progenitor cell subpopulations

Michael Januszyk et al. Diabetes. 2014 Sep.

Abstract

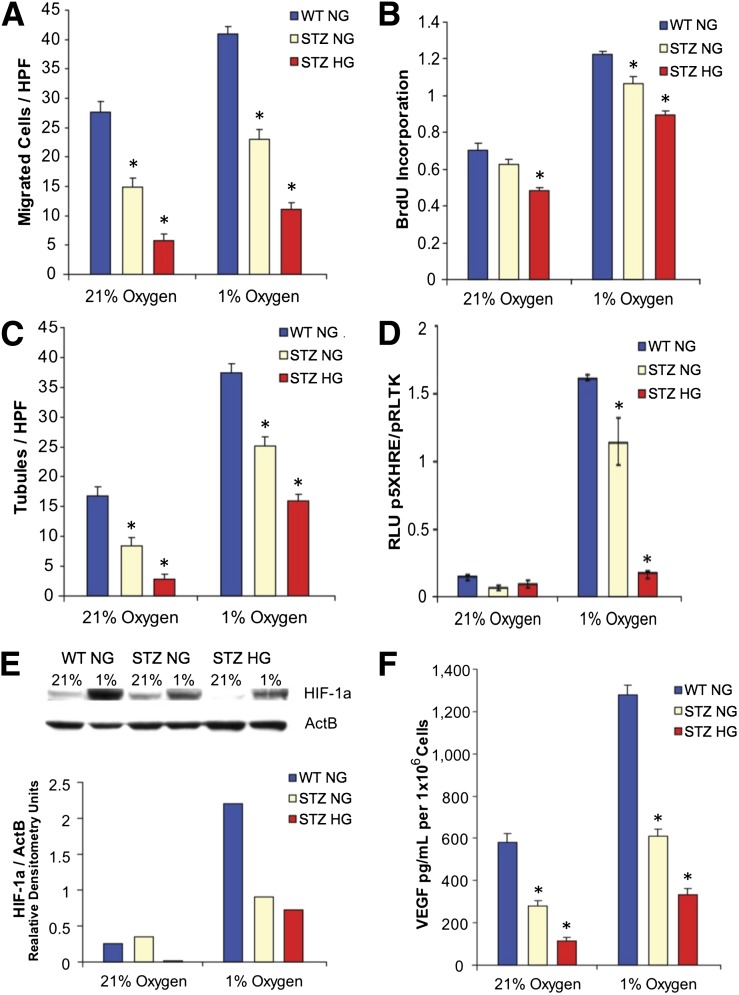
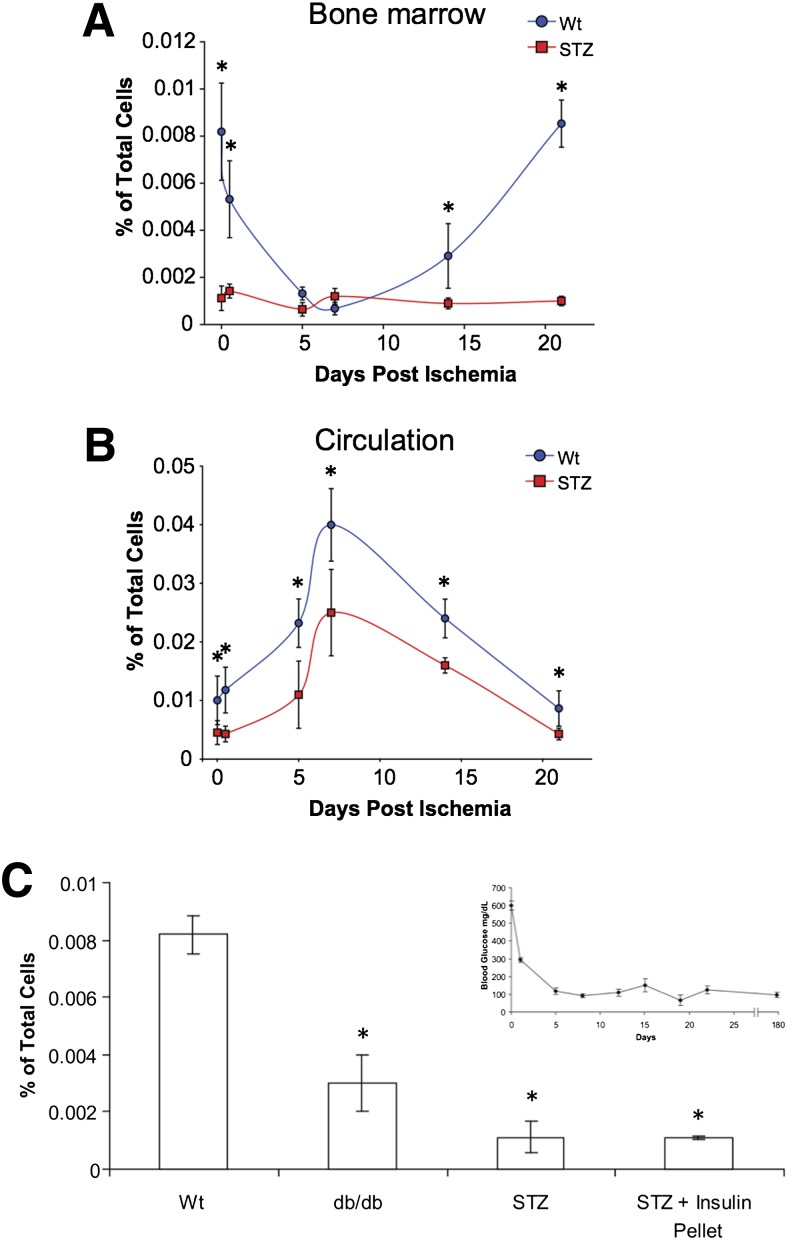
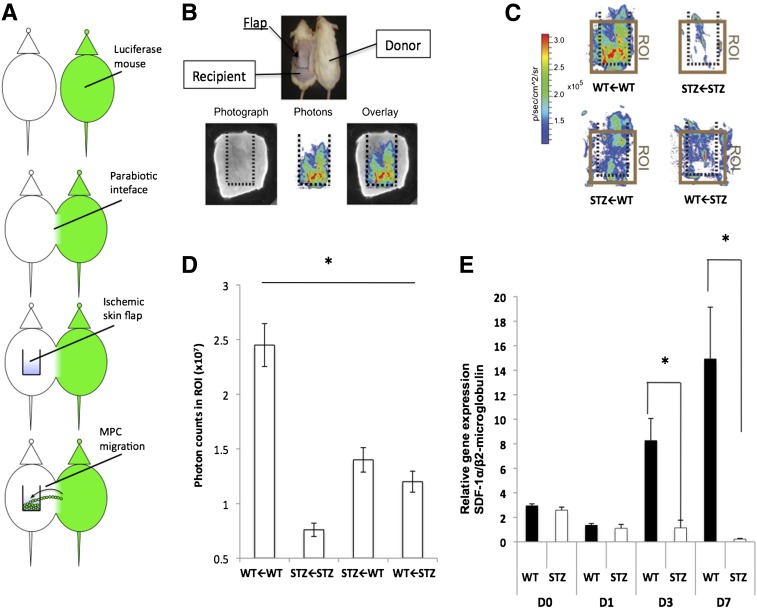
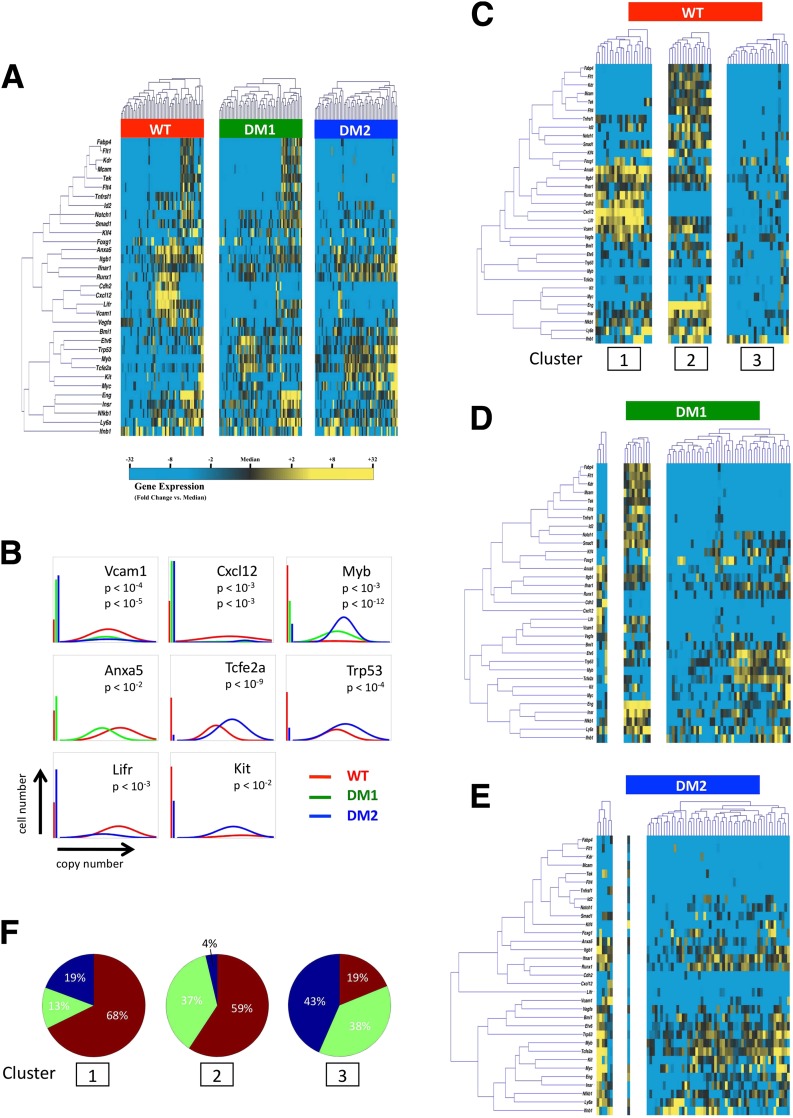
Diabetic vascular pathology is largely attributable to impairments in tissue recovery from hypoxia. Circulating progenitor cells have been postulated to play a role in ischemic recovery, and deficiencies in these cells have been well described in diabetic patients. Here, we examine bone marrow-derived mesenchymal progenitor cells (BM-MPCs) that have previously been shown to be important for new blood vessel formation and demonstrate significant deficits in the context of diabetes. Further, we determine that this dysfunction is attributable to intrinsic defects in diabetic BM-MPCs that are not correctable by restoring glucose homeostasis. We identify two transcriptionally distinct subpopulations that are selectively depleted by both type 1 and type 2 diabetes, and these subpopulations have provasculogenic expression profiles, suggesting that they are vascular progenitor cells. These results suggest that the clinically observed deficits in progenitor cells may be attributable to selective and irreversible depletion of progenitor cell subsets in patients with diabetes.


Figures

Figure 1
Figure 1
Diabetic BM-MPCs have poor baseline vasculogenic properties in hyperoxia and hypoxia, functions that cannot be corrected with return to normal glucose levels. MPCs isolated from the bone marrow of type 1 diabetic (modeled by STZ) and WT mice were cultured in either 21% oxygen (hyperoxia) or 1% oxygen (hypoxia) under either normoglycemic (NG) (1 g/L) or hyperglycemic (HG) (4.5 g/L) glucose conditions. Diabetic BM-MPCs under all culture conditions exhibited a diminished ability to migrate toward a CXCL12 stimulus, a peptide critical for progenitor cell chemotaxis in vasculogenesis (A); undergo proliferation based on genomic BrdU incorporation studies (B); and form tubules in Matrigel when cocultured with b.End3 cells (C). D: HIF-1α transcriptional activity in STZ diabetic BM-MPCs, as measured by a firefly luciferase reporter plasmid using the VEGF HRE. E: Immunoblot and densitometry for HIF-1α protein demonstrate that diabetic BM-MPCs fail to stabilize HIF-1α in hypoxia. F: Diabetic BM-MPCs produce less VEGF-A in hyperoxic and hypoxic conditions as measured by ELISA on conditioned medium. HPF, high power field; RLU, relative light units. *P < 0.05 vs. WT group, n = 3.
Figure 2
Figure 2
Diabetic and WT Lin/CD45/Sca-1+ cells are mobilized from the bone marrow in response to peripheral ischemia. A: Bone marrow isolated from STZ-induced diabetic mice had significantly fewer Lin/CD45/Sca-1+ cells compared with normal animals at baseline. B: Peripheral blood isolated from WT mice showed an increase in the number of circulating Lin/CD45/Sca-1+ cells 7 days after surgery. Diabetic mice, in contrast, exhibited an attenuated response to peripheral ischemic insult. C: Baseline levels of Lin/CD45/Sca-1+ cells from the bone marrow of normal, db/db mice, STZ diabetic mice, and STZ mice after 6 months of treatment with an insulin pellet. Hyperglycemic control failed to normalize levels of Lin/CD45/Sca-1+ cells. Inset: STZ diabetic mice had insulin pellets implanted at day zero, and their glucose was monitored for 6 months, throughout which normoglycemic levels were maintained. *P < 0.05 vs. WT group.
Figure 3
Figure 3
Diabetic BM-MPCs exhibit impaired cell trafficking in vivo; this cannot be corrected with restoration of WT signaling. A: Parabiosis schema. Luciferase-positive and control mice are joined surgically, creating a parabiotic interface. An ischemic skin flap is created on the dorsum of the control mouse, and the number of migrating (luciferase+) cells was recorded using IVIS. B: Eight weeks after parabiosis, a modified ischemic flap is created on the back of the recipient mouse (top). Three months after ischemia, the ischemic flap from the recipient mouse is assayed for bioluminescence ex vivo (bottom panel). C: Heat maps of bioluminescence ex vivo imaging from WT←WT, STZ←STZ, STZ←WT, and WT←STZ pairings. Mouse pairs are denoted according to recipient animal←donor animal. D: Quantification of region of interest (ROI) from the ischemic flap area of each pairing. E: Transcriptional analysis of SDF-1α in ischemic flaps of WT and STZ mice at days 0, 1, 3, and 7 after flap creation. D, day; p, photons; sr, squared radian. *P < 0.05 vs. QT group.
Figure 4
Figure 4
Single-cell qPCR of Lin/CD45/Sca-1+ BM-MPCs. A: Hierarchical clustering of simultaneous gene expression for 60 individual cells from WT, STZ diabetic (DM1), and db/db (DM2) mice. Gene expression is presented as fold change from median on a color scale from yellow (high expression, 32-fold above median) to blue (low expression, 32-fold below median). See Supplementary Figs. 4 and 5 for complete data set. B: Differentially expressed genes between WT and diabetic (STZ [DM1] or db/db [DM2]) cells identified using nonparametric two-sample Kolmogorov-Smirnov testing. Eight genes exhibit significantly different (P < 0.01 after Bonferroni correction for multiple comparisons) distributions of single-cell expression between populations, illustrated here using median-centered Gaussian curve fits. The left bar for each panel represents the fraction of qPCR reactions that failed to amplify in each group. Curves and P values for each gene are shown only for those diabetic groups significantly different from WT cells. C: K-means clustering of WT cells, with k = 3 chosen using the gap statistic as described in Supplementary Fig. 6. D and E: Cells from STZ-induced (DM1) and db/db (DM2) animals were partitioned into subgroups according to the cluster centroids of the WT cells in C. F: Pie graphs representing the fraction of cells comprising each cluster from WT (red), STZ diabetic (green), and db/db (blue) animals.

Comment in

References

    1. Zimmet P, Alberti KG, Shaw J. Global and societal implications of the diabetes epidemic. Nature 2001;414:782–787 - PubMed
    1. Annual number (in thousands) of new cases of diagnosed diabetes among adults aged 18–79 years, United States, 1980–2010 [article online], 2010. Available from http://www.cdc.gov/diabetes/statistics/incidence/fig1.htm. Accessed 14 June 2013
    1. Narayan KM, Boyle JP, Geiss LS, Saaddine JB, Thompson TJ. Impact of recent increase in incidence on future diabetes burden: U.S., 2005-2050. Diabetes Care 2006;29:2114–2116 - PubMed
    1. Caro JJ, Ward AJ, O'Brien JA. Lifetime costs of complications resulting from type 2 diabetes in the U.S. Diabetes Care 2002;25:476–481 - PubMed
    1. Fox CS, Coady S, Sorlie PD, et al. . Increasing cardiovascular disease burden due to diabetes mellitus: the Framingham Heart Study. Circulation 2007;115:1544–1550 - PubMed