. 2014 Sep;63(9):3077-90.
doi: 10.2337/db14-0235. Epub 2014 Apr 16.

mTORC1-independent reduction of retinal protein synthesis in type 1 diabetes

Affiliations

mTORC1-independent reduction of retinal protein synthesis in type 1 diabetes

Patrice E Fort et al. Diabetes. 2014 Sep.

Abstract

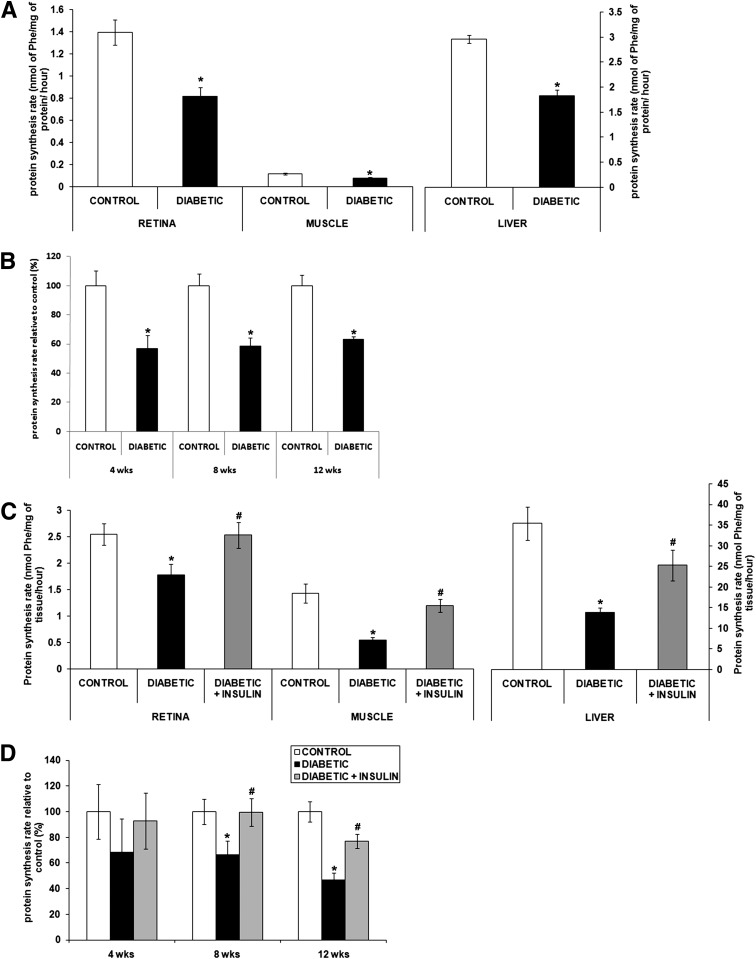
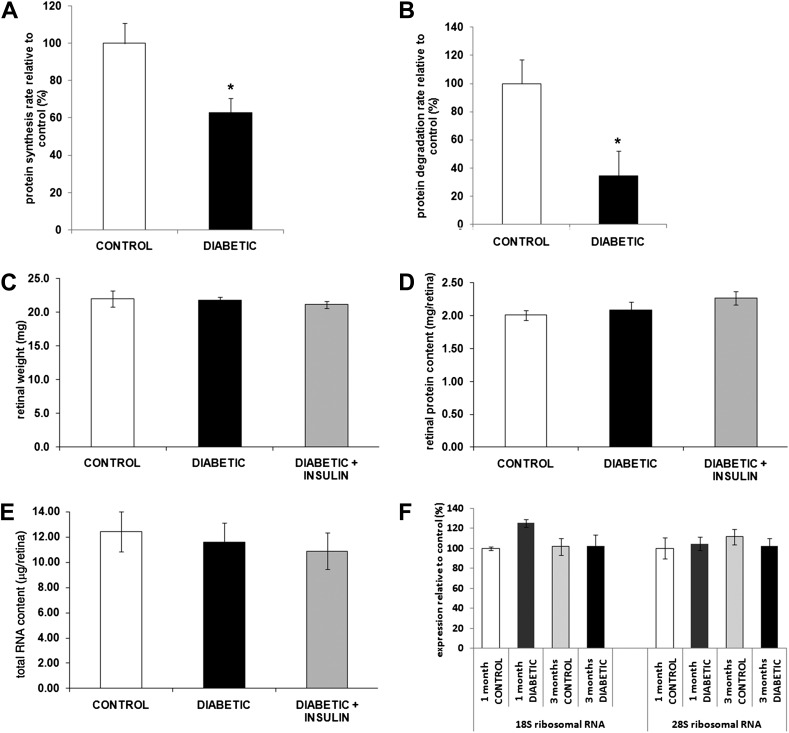
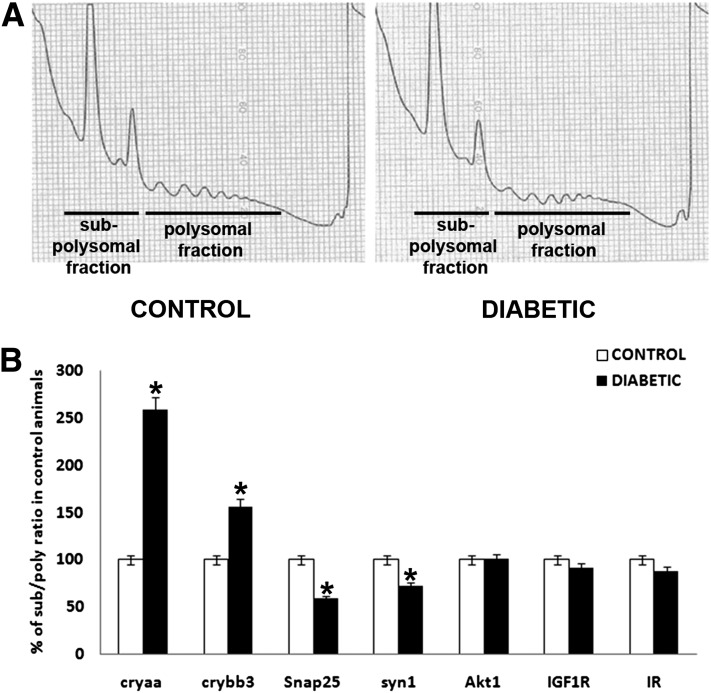
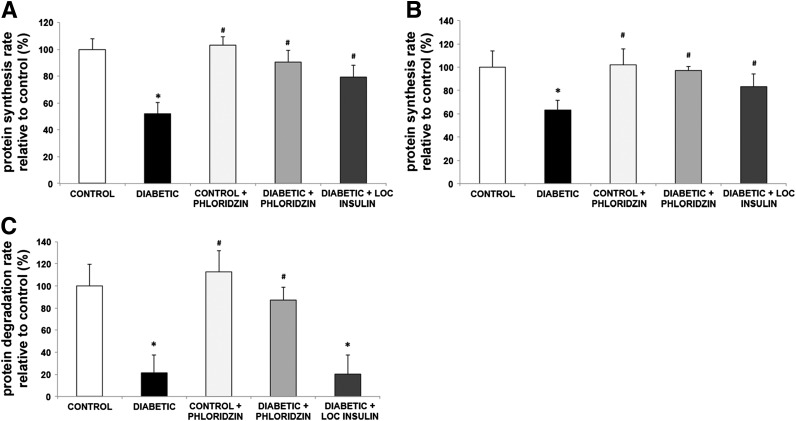
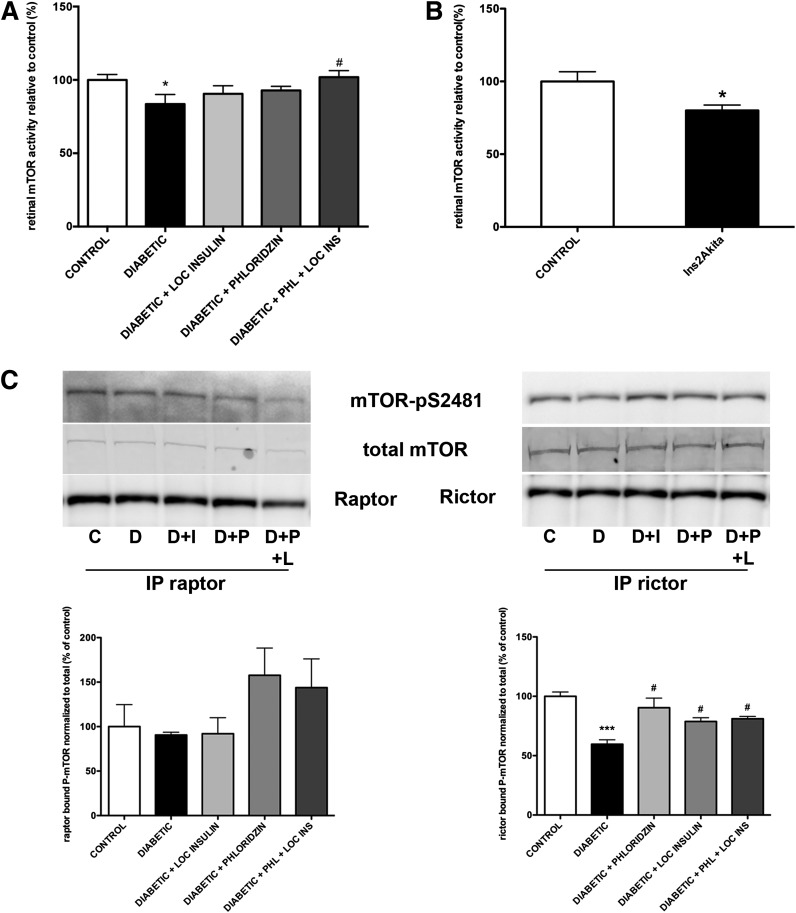
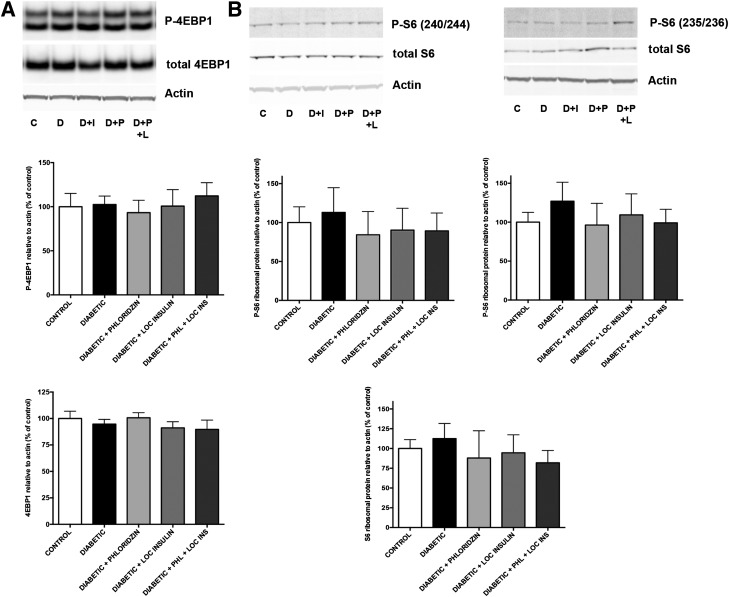
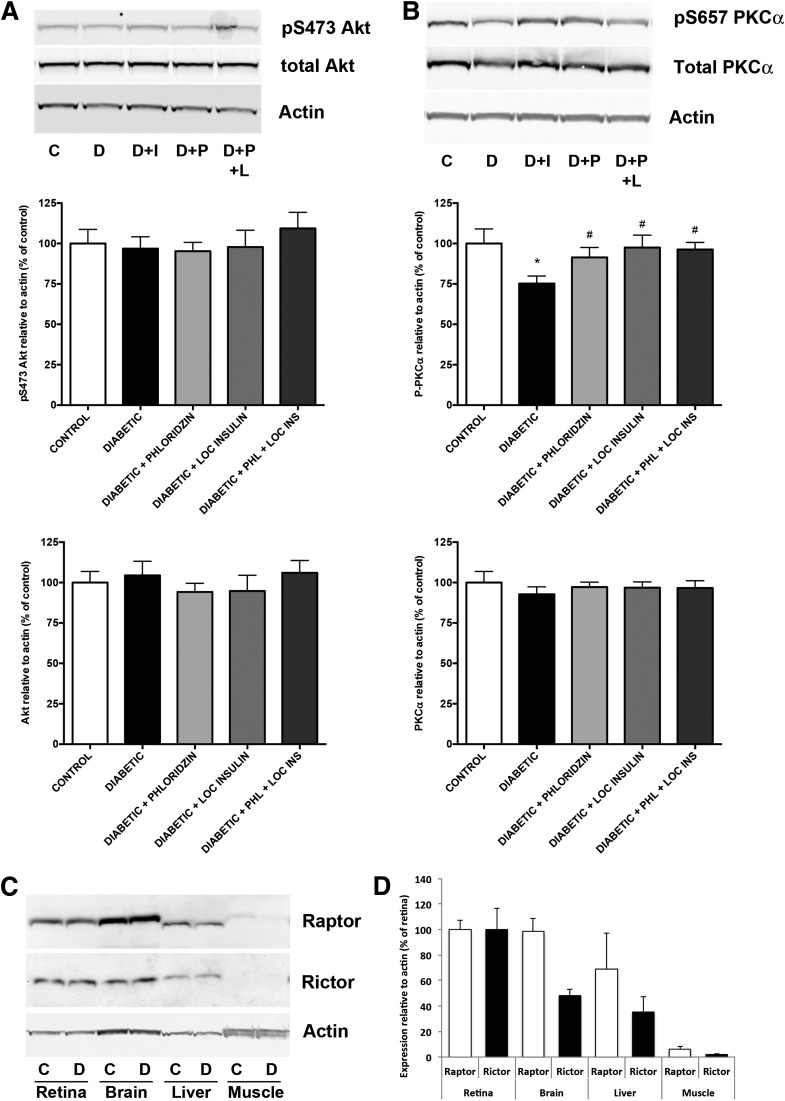
Poorly controlled diabetes has long been known as a catabolic disorder with profound loss of muscle and fat body mass resulting from a simultaneous reduction in protein synthesis and enhanced protein degradation. By contrast, retinal structure is largely maintained during diabetes despite reduced Akt activity and increased rate of cell death. Therefore, we hypothesized that retinal protein turnover is regulated differently than in other insulin-sensitive tissues, such as skeletal muscle. Ins2(Akita) diabetic mice and streptozotocin-induced diabetic rats exhibited marked reductions in retinal protein synthesis matched by a concomitant reduction in retinal protein degradation associated with preserved retinal mass and protein content. The reduction in protein synthesis depended on both hyperglycemia and insulin deficiency, but protein degradation was only reversed by normalization of hyperglycemia. The reduction in protein synthesis was associated with diminished protein translation efficiency but, surprisingly, not with reduced activity of the mTORC1/S6K1/4E-BP1 pathway. Instead, diabetes induced a specific reduction of mTORC2 complex activity. These findings reveal distinctive responses of diabetes-induced retinal protein turnover compared with muscle and liver that may provide a new means to ameliorate diabetic retinopathy.


Figures

Figure 1
Figure 1
Diabetes disrupts retinal protein synthesis in diabetic rats and mice. The in vivo flooding dose of phenylalanine method was used to measure protein synthesis rate in retina, muscle, and liver from Ins2Akita diabetic mice and littermate controls (A and B) and from STZ-induced diabetic rats treated or not with systemic insulin and age-matched controls (C and D). Graphic representation of the decreased protein synthesis rate in the Ins2Akita diabetic mice (A) and its reversal by systemic insulin administration measured in retina, gastrocnemius muscle, and liver after 8 weeks of diabetes in STZ-induced rats (C). Graphic representation of the time course study of the retinal protein synthesis rate in Ins2Akita diabetic mice (B) and STZ-diabetic rats (D) relative to control (n = 8/group). *Significantly different from control (P < 0.05). #Significantly different from diabetic (P < 0.05). Phe, phenylalanine.
Figure 2
Figure 2
Diabetes reduces retinal protein synthesis and degradation independent of retinal weight, total protein, total RNA, and ribosomal RNA content. Retinas from 3-month diabetic STZ rats treated or not with systemic insulin and age-matched controls were harvested for assessment of the impact of diabetes on retinal protein synthesis (A), degradation rate (B), and composition (CF). Diabetes reduced retinal protein synthesis (A) and retinal degradation (B) as measured by the pulse-chase method without affecting retinal wet weight (C), protein content (D), total RNA content (E), and ribosomal RNA content (F) (n ≥ 20/group). *Significantly different from control.
Figure 3
Figure 3
Diabetes reduces retinal protein synthesis through an impairment in both peptide chain initiation and elongation while affecting specific mRNA translation rates. The impact of diabetes on polysome profiles and RNA pools of the subpolysomal and polysomal fractions was also analyzed. Representative polysome profiles are presented and show that translation efficiency is due to impairment in both peptide chain initiation and elongation in the retina during diabetes (A). RNA isolated from both subpolysomal and polysomal fractions was analyzed by quantitative RT-PCR and demonstrated the decreased translation of α-A-crystallin (cryaa) and β-B3-crystallin (crybb3) mRNA and increased translation of synaptic genes Snap25 and synapsin 1 (syn1) during diabetes (B). *Significantly different from control.
Figure 4
Figure 4
Blood glucose normalization reverses both retinal protein synthesis and retinal protein degradation induced by diabetes, whereas local insulin only reverses the reduction in protein synthesis. Rats with 3 months of diabetes were treated by administration of phloridzin twice daily or insulin subconjunctivally once daily for the last 4 days. Protein synthesis rate was then measured using the flooding dose of phenylalanine method, and results show that both treatments partially reverse the protein synthesis decrease induced by diabetes (A). Similarly, retinas from diabetic and age-matched control rats treated with either phloridzin twice daily or insulin subconjunctivally once daily for the last 4 days were harvested and incubated ex vivo with radiolabeled methionine to measure protein synthesis rate (B) followed by pulse-chase method to measure protein degradation rate (C). Phloridzin treatment for 4 days reversed both protein synthesis and protein degradation rates, whereas ocular insulin only reversed the protein synthesis defects induced by diabetes (n ≥ 8/group). *Significantly different from control (P < 0.05). #Significantly different from diabetic (P < 0.05). LOC, local.
Figure 5
Figure 5
Diabetes reduces total retinal mTOR activity and mTORC2 associated mTOR phosphorylation. Rats with 3 months of diabetes were treated with either phloridzin twice daily or insulin subconjunctivally once daily for the last 4 days. Retinal mTOR activity was then measured, which demonstrated that mTOR activity was significantly reduced in the retina during diabetes and was reversed by the combined treatment (A). Retinal mTOR activity was also measured in 3-month diabetic Ins2Akita mice and demonstrated a similar reduction (B) (n ≥ 8/group). *Significantly different from control (P < 0.05). #Significantly different from diabetic (P < 0.05). Specific activity of the mTORC1 and mTORC2 complexes was assessed by immunoprecipitation of rictor and raptor followed by assessment of the bound mTOR activity using an antibody against pS2481 (C). Diabetes did not reduce raptor-bound mTOR phosphorylation, but it significantly reduced rictor-bound mTOR phosphorylation. This reduction was reversed by both phloridzin and local insulin treatment. C, control; D, diabetic; D+I, diabetic + insulin; D+P, diabetic + phloridzin; D+P+L, diabetic + phloridzin + local insulin; IP, immunoprecipitation. ***Significantly different from control (P < 0.001); #Significantly different from diabetic (P < 0.05).
Figure 6
Figure 6
Diabetes does not affect the expression and phosphorylation of downstream targets of mTORC1. Rats with 3 months of diabetes were treated with either phloridzin twice daily or insulin subconjunctivally once daily for the last 4 days. Analysis of the levels of expression of 4E-BP1 and its phosphorylation on threonines 37 and 46 (A) and S6 ribosomal protein and its phosphorylation on serines 240/244 and serines 235/236 (B), downstream targets of TORC1, showed that neither was reduced by diabetes (n ≥ 5/group). C, control; D, diabetic; D+I, diabetic + insulin; D+P, diabetic + phloridzin; D+P+L, diabetic + phloridzin + local insulin.
Figure 7
Figure 7
Diabetes affects a downstream target of mTORC2, the predominant TOR-associated complex in the retina. Rats with 3 months of diabetes were treated with either phloridzin twice daily or insulin subconjunctivally once daily for the last 4 days. Analysis of the level of serine 473 phosphorylation of Akt (A) and PKC-α (B), downstream targets of TORC2, showed that PKC-α was reduced by diabetes, and this effect is reversed by both local insulin and systemic phloridzin treatment (n ≥ 5/group). *Significantly different from control (P < 0.001). #Significantly different from diabetic (P < 0.05). C, control; D, diabetic; D+I, diabetic + insulin; D+P, diabetic + phloridzin; D+P+L, diabetic + phloridzin + local insulin. Further analysis of TORC complexes showed that the retina has a comparable level of expression to raptor but a higher level of expression of rictor compared with other insulin-sensitive tissues, including brain, liver, and skeletal muscle. A representative picture (C) is shown as well as a graphical representation of the quantification (D) (n = 4/group).

References

    1. Antonetti DA, Klein R, Gardner TW. Diabetic retinopathy. N Engl J Med 2012;366:1227–1239 - PubMed
    1. Tesfaye S, Boulton AJ, Dyck PJ, et al. Toronto Diabetic Neuropathy Expert Group Diabetic neuropathies: update on definitions, diagnostic criteria, estimation of severity, and treatments. Diabetes Care 2010;33:2285–2293 - PMC - PubMed
    1. Antonetti DA, Barber AJ, Bronson SK, et al. JDRF Diabetic Retinopathy Center Group Diabetic retinopathy: seeing beyond glucose-induced microvascular disease. Diabetes 2006;55:2401–2411 - PubMed
    1. Ahmed J, Braun RD, Dunn R, Jr, Linsenmeier RA. Oxygen distribution in the macaque retina. Invest Ophthalmol Vis Sci 1993;34:516–521 - PubMed
    1. Wangsa-Wirawan ND, Linsenmeier RA. Retinal oxygen: fundamental and clinical aspects. Arch Ophthalmol 2003;121:547–557 - PubMed

Publication types

MeSH terms