

The rate of fall of blood glucose determines the necessity of forebrain-projecting catecholaminergic neurons for male rat sympathoadrenal responses
- PMID: 24740574
- PMCID: PMC4113074
- DOI: 10.2337/db13-1753
The rate of fall of blood glucose determines the necessity of forebrain-projecting catecholaminergic neurons for male rat sympathoadrenal responses
Abstract
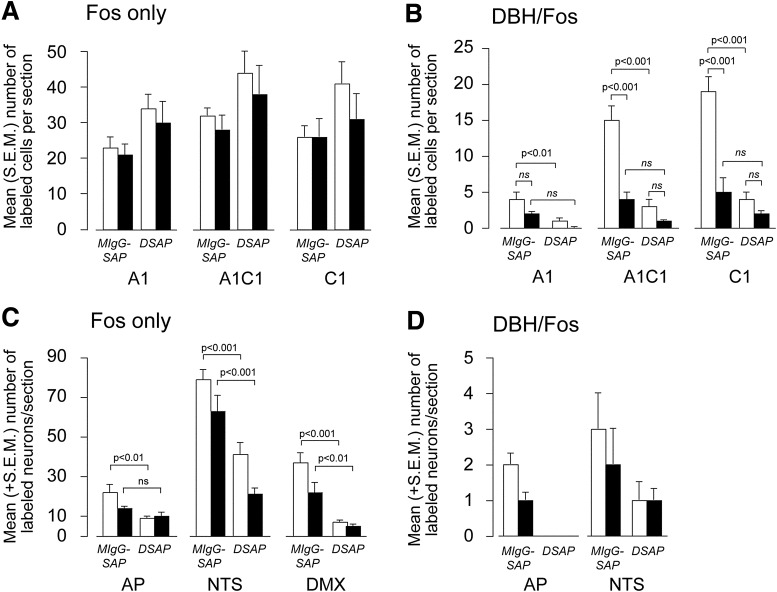
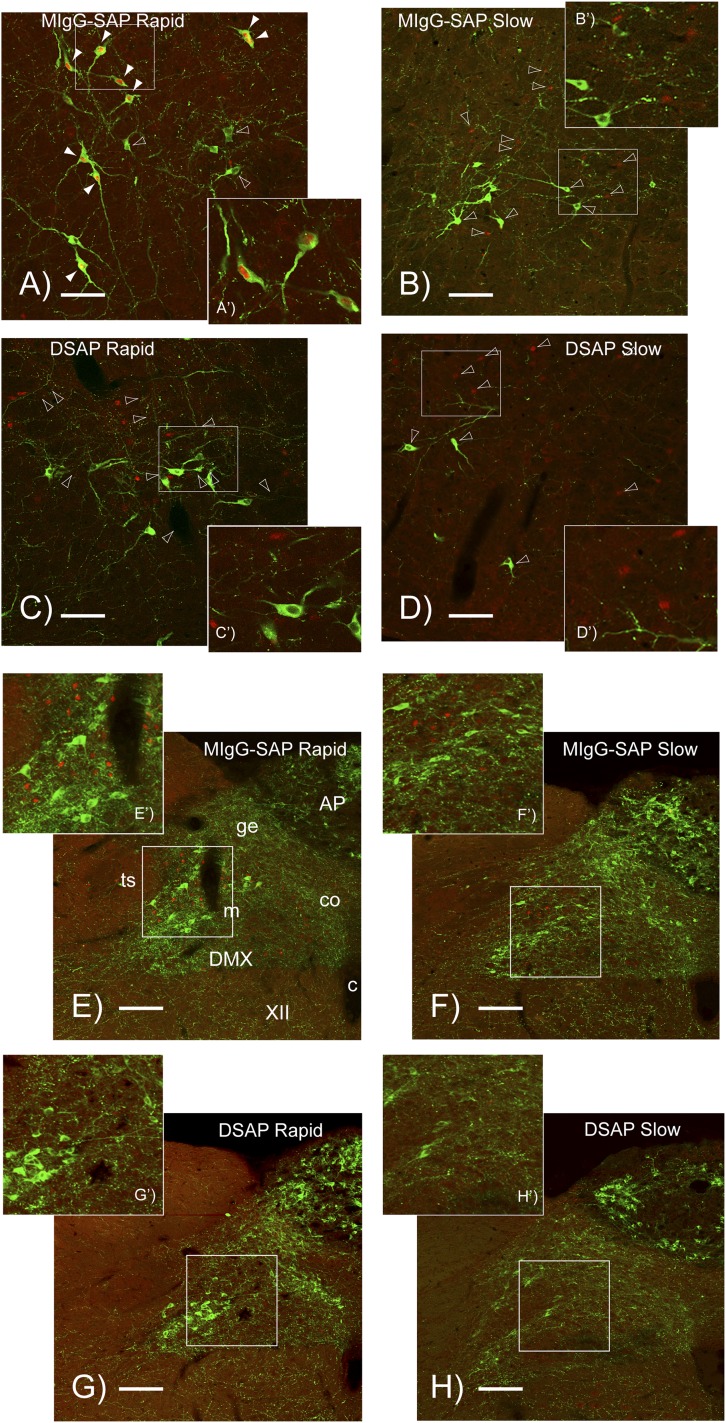
Different onset rates of insulin-induced hypoglycemia use distinct glucosensors to activate sympathoadrenal counterregulatory responses (CRRs). Glucosensory elements in the portal-mesenteric veins are dispensable with faster rates when brain elements predominate, but are essential for responses to the slower-onset hypoglycemia that is common with insulin therapy. Whether a similar rate-associated divergence exists within more expansive brain networks is unknown. Hindbrain catecholamine neurons distribute glycemia-related information throughout the forebrain. We tested in male rats whether catecholaminergic neurons that project to the medial and ventromedial hypothalamus are required for sympathoadrenal CRRs to rapid- and slow-onset hypoglycemia and whether these neurons are differentially engaged as onset rates change. Using a catecholamine-specific neurotoxin and hyperinsulinemic-hypoglycemic clamps, we found that sympathoadrenal CRRs to slow- but not rapid-onset hypoglycemia require hypothalamus-projecting catecholaminergic neurons, the majority of which originate in the ventrolateral medulla. As determined with Fos, these neurons are differentially activated by the two onset rates. We conclude that 1) catecholaminergic projections to the hypothalamus provide essential information for activating sympathoadrenal CRRs to slow- but not rapid-onset hypoglycemia, 2) hypoglycemia onset rates have a major impact on the hypothalamic mechanisms that enable sympathoadrenal CRRs, and 3) hypoglycemia-related sensory information activates hindbrain catecholaminergic neurons in a rate-dependent manner.
© 2014 by the American Diabetes Association. Readers may use this article as long as the work is properly cited, the use is educational and not for profit, and the work is not altered.
Figures
Comment in
-
Is there cross talk between portal and hypothalamic glucose-sensing circuits?Diabetes. 2014 Aug;63(8):2617-9. doi: 10.2337/db14-0755. Diabetes. 2014. PMID: 25060894 Free PMC article. No abstract available.
Similar articles
-
Activation of hindbrain neurons is mediated by portal-mesenteric vein glucosensors during slow-onset hypoglycemia.Diabetes. 2014 Aug;63(8):2866-75. doi: 10.2337/db13-1600. Epub 2014 Apr 11. Diabetes. 2014. PMID: 24727435 Free PMC article.
-
Orexin-A enhances feeding in male rats by activating hindbrain catecholamine neurons.Am J Physiol Regul Integr Comp Physiol. 2015 Aug 15;309(4):R358-67. doi: 10.1152/ajpregu.00065.2015. Epub 2015 Jun 10. Am J Physiol Regul Integr Comp Physiol. 2015. PMID: 26062632 Free PMC article.
-
Brain insulin action regulates hypothalamic glucose sensing and the counterregulatory response to hypoglycemia.Diabetes. 2010 Sep;59(9):2271-80. doi: 10.2337/db10-0401. Epub 2010 Jun 14. Diabetes. 2010. PMID: 20547974 Free PMC article.
-
Sympathoadrenal system in neuroendocrine control of glucose: mechanisms involved in the liver, pancreas, and adrenal gland under hemorrhagic and hypoglycemic stress.Can J Physiol Pharmacol. 1992 Feb;70(2):167-206. doi: 10.1139/y92-024. Can J Physiol Pharmacol. 1992. PMID: 1521177 Review.
-
Sweet talk in the brain: glucosensing, neural networks, and hypoglycemic counterregulation.Front Neuroendocrinol. 2010 Jan;31(1):32-43. doi: 10.1016/j.yfrne.2009.10.006. Epub 2009 Oct 24. Front Neuroendocrinol. 2010. PMID: 19836412 Free PMC article. Review.
Cited by
-
Rapid-onset hypoglycemia suppresses Fos expression in discrete parts of the ventromedial nucleus of the hypothalamus.Am J Physiol Regul Integr Comp Physiol. 2016 Jun 1;310(11):R1177-85. doi: 10.1152/ajpregu.00042.2016. Epub 2016 Mar 30. Am J Physiol Regul Integr Comp Physiol. 2016. PMID: 27030665 Free PMC article.
-
Hindbrain astrocytes and glucose counter-regulation.Physiol Behav. 2019 May 15;204:140-150. doi: 10.1016/j.physbeh.2019.02.025. Epub 2019 Feb 21. Physiol Behav. 2019. PMID: 30797812 Free PMC article. Review.
-
Adrenergic modulation of melanocortin pathway by hunger signals.Nat Commun. 2023 Oct 19;14(1):6602. doi: 10.1038/s41467-023-42362-8. Nat Commun. 2023. PMID: 37857606 Free PMC article.
-
Is there cross talk between portal and hypothalamic glucose-sensing circuits?Diabetes. 2014 Aug;63(8):2617-9. doi: 10.2337/db14-0755. Diabetes. 2014. PMID: 25060894 Free PMC article. No abstract available.
-
Hindbrain glucoregulatory mechanisms: Critical role of catecholamine neurons in the ventrolateral medulla.Physiol Behav. 2019 Sep 1;208:112568. doi: 10.1016/j.physbeh.2019.112568. Epub 2019 Jun 5. Physiol Behav. 2019. PMID: 31173784 Free PMC article. Review.
References
-
- Hoeldtke RD, Boden G. Epinephrine secretion, hypoglycemia unawareness, and diabetic autonomic neuropathy. Ann Intern Med 1994;120:512–517 - PubMed
-
- Levin BE, Routh VH, Kang L, Sanders NM, Dunn-Meynell AA. Neuronal glucosensing: what do we know after 50 years? Diabetes 2004;53:2521–2528 - PubMed
-
- Donovan CM. Portal vein glucose sensing. Diabetes Nutr Metab 2002;15:308–312; discussion 313–314 - PubMed
-
- Hevener AL, Bergman RN, Donovan CM. Novel glucosensor for hypoglycemic detection localized to the portal vein. Diabetes 1997;46:1521–1525 - PubMed
Publication types
MeSH terms
Substances
Grants and funding
LinkOut - more resources
Full Text Sources
Other Literature Sources
Medical
Research Materials
