

A novel spatiotemporal analysis of peri-ictal spiking to probe the relation of spikes and seizures in epilepsy
- PMID: 24740852
- PMCID: PMC4099424
- DOI: 10.1007/s10439-014-1004-x
A novel spatiotemporal analysis of peri-ictal spiking to probe the relation of spikes and seizures in epilepsy
Abstract
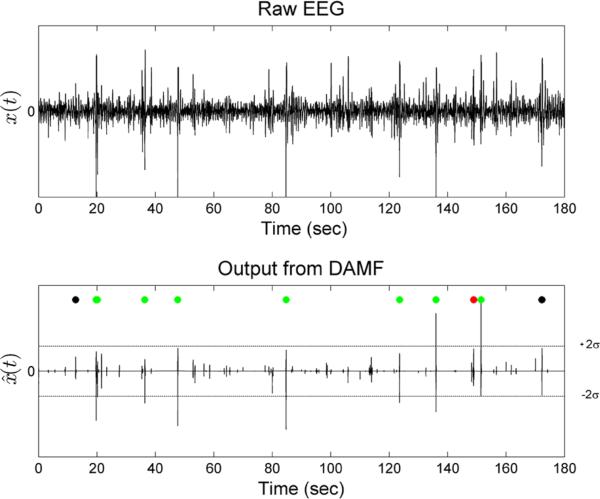
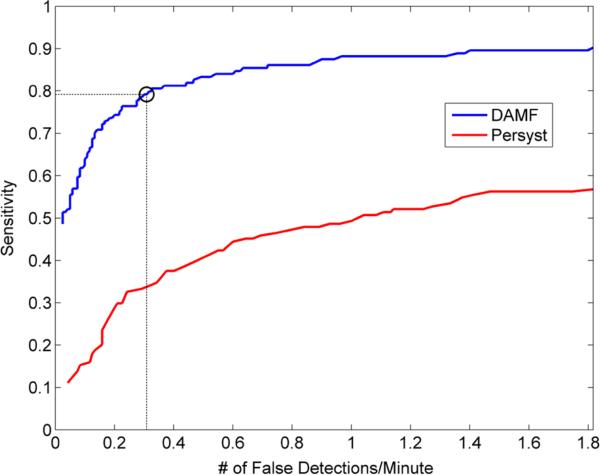
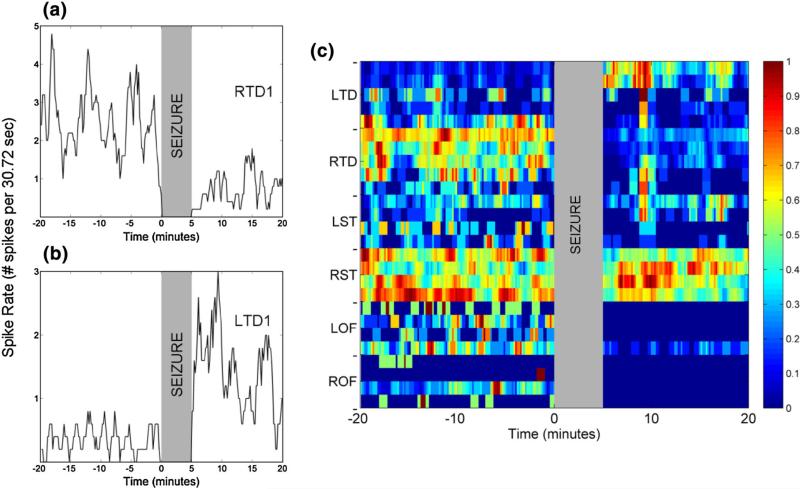
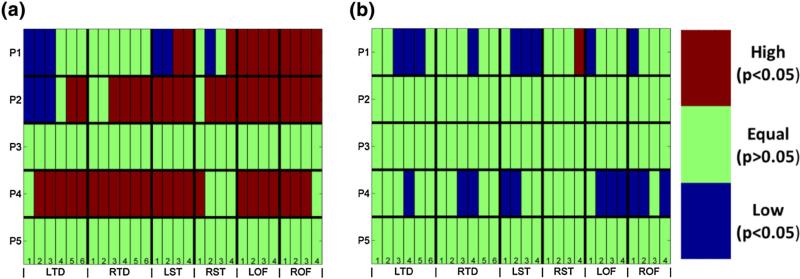
The relation between epileptic spikes and seizures is an important but still unresolved question in epilepsy research. Preclinical and clinical studies have produced inconclusive results on the causality or even on the existence of such a relation. We set to investigate this relation taking in consideration seizure severity and spatial extent of spike rate. We developed a novel automated spike detection algorithm based on morphological filtering techniques and then tested the hypothesis that there is a pre-ictal increase and post-ictal decrease of the spatial extent of spike rate. Peri-ictal (around seizures) spikes were detected from intracranial EEG recordings in 5 patients with temporal lobe epilepsy. The 94 recorded seizures were classified into two classes, based on the percentage of brain sites having higher or lower rate of spikes in the pre-ictal compared to post-ictal periods, with a classification accuracy of 87.4%. This seizure classification showed that seizures with increased pre-ictal spike rate and spatial extent compared to the post-ictal period were mostly (83%) clinical seizures, whereas no such statistically significant (α = 0.05) increase was observed peri-ictally in 93% of sub-clinical seizures. These consistent across patients results show the existence of a causal relation between spikes and clinical seizures, and imply resetting of the preceding spiking process by clinical seizures.
Figures


Similar articles
-
Spike patterns surrounding sleep and seizures localize the seizure-onset zone in focal epilepsy.Epilepsia. 2023 Mar;64(3):754-768. doi: 10.1111/epi.17482. Epub 2023 Jan 14. Epilepsia. 2023. PMID: 36484572 Free PMC article.
-
An analysis of clinical seizure patterns and their localizing value in frontal and temporal lobe epilepsies.Brain. 1996 Feb;119 ( Pt 1):17-40. doi: 10.1093/brain/119.1.17. Brain. 1996. PMID: 8624679
-
Temporo-spatial patterns of pre-ictal spike activity in human temporal lobe epilepsy.Electroencephalogr Clin Neurophysiol. 1983 Dec;56(6):543-55. doi: 10.1016/0013-4694(83)90022-6. Electroencephalogr Clin Neurophysiol. 1983. PMID: 6197273
-
Peri-ictal water drinking and other ictal vegetative symptoms: Localizing and lateralizing the epileptogenic zone in temporal lobe epilepsy? Two case reports and review of the literature.Rev Neurol (Paris). 2013 Nov;169(11):903-10. doi: 10.1016/j.neurol.2013.06.005. Epub 2013 Oct 15. Rev Neurol (Paris). 2013. PMID: 24138873 Review.
-
How can we identify ictal and interictal abnormal activity?Adv Exp Med Biol. 2014;813:3-23. doi: 10.1007/978-94-017-8914-1_1. Adv Exp Med Biol. 2014. PMID: 25012363 Free PMC article. Review.
Cited by
-
Multi-day rhythms modulate seizure risk in epilepsy.Nat Commun. 2018 Jan 8;9(1):88. doi: 10.1038/s41467-017-02577-y. Nat Commun. 2018. PMID: 29311566 Free PMC article.
-
Alterations of network synchrony after epileptic seizures: An analysis of post-ictal intracranial recordings in pediatric epilepsy patients.Epilepsy Res. 2018 Jul;143:41-49. doi: 10.1016/j.eplepsyres.2018.04.003. Epub 2018 Apr 5. Epilepsy Res. 2018. PMID: 29655171 Free PMC article.
-
Spatial distribution of interictal spikes fluctuates over time and localizes seizure onset.Brain. 2020 Feb 1;143(2):554-569. doi: 10.1093/brain/awz386. Brain. 2020. PMID: 31860064 Free PMC article.
-
A Feature Tensor-Based Epileptic Detection Model Based on Improved Edge Removal Approach for Directed Brain Networks.Front Neurosci. 2020 Dec 21;14:557095. doi: 10.3389/fnins.2020.557095. eCollection 2020. Front Neurosci. 2020. PMID: 33408603 Free PMC article.
-
Expert-Level Intracranial Electroencephalogram Ictal Pattern Detection by a Deep Learning Neural Network.Front Neurol. 2021 May 3;12:603868. doi: 10.3389/fneur.2021.603868. eCollection 2021. Front Neurol. 2021. PMID: 34012415 Free PMC article.
References
-
- Avoli M. Do interictal discharges promote or control seizures? Experimental evidence from an in vitro model of epileptiform discharge. Epilepsia. 2001;42(S3):2–4. - PubMed
-
- Chauviére L, Doublet T, Ghestem A, Siyoucef SS, Wendling F, Huys R, Jirsa V, Bartolomei F, Bernard C. Changes in interictal spike features precede the onset of temporal lobe epilepsy. Ann. Neurol. 2012;71(6):805–814. - PubMed
Publication types
MeSH terms
Grants and funding
LinkOut - more resources
Full Text Sources
Other Literature Sources
