

Cellular mechanisms for response heterogeneity among L2/3 pyramidal cells in whisker somatosensory cortex
- PMID: 24740854
- PMCID: PMC4064418
- DOI: 10.1152/jn.00848.2013
Cellular mechanisms for response heterogeneity among L2/3 pyramidal cells in whisker somatosensory cortex
Abstract
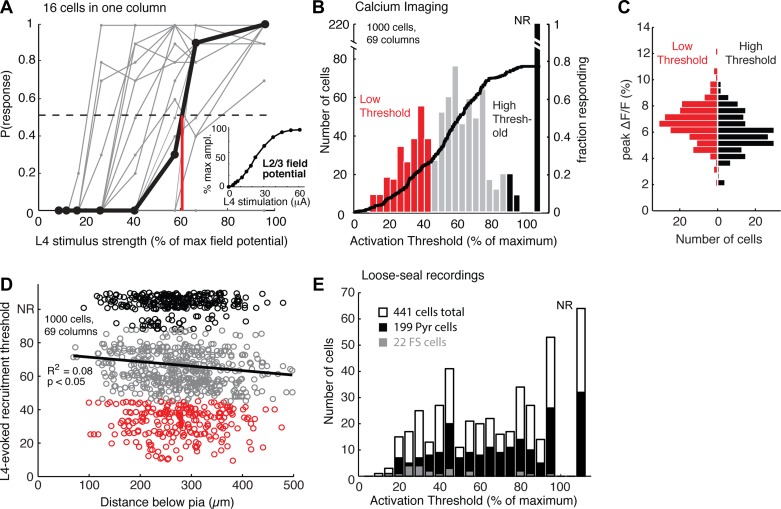
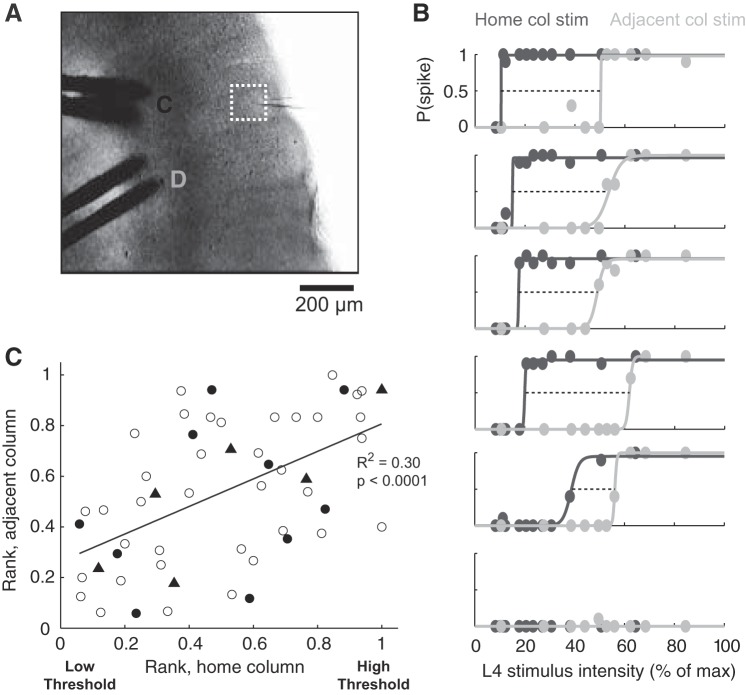
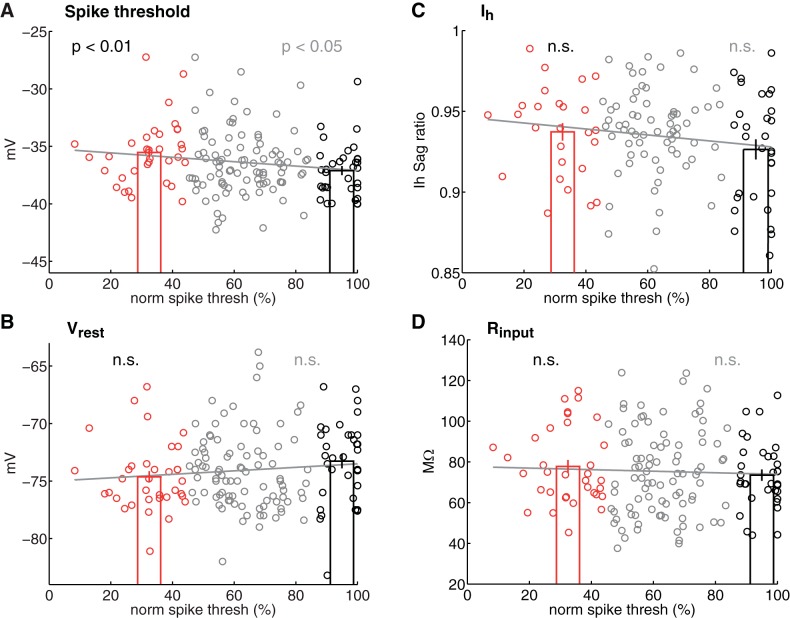
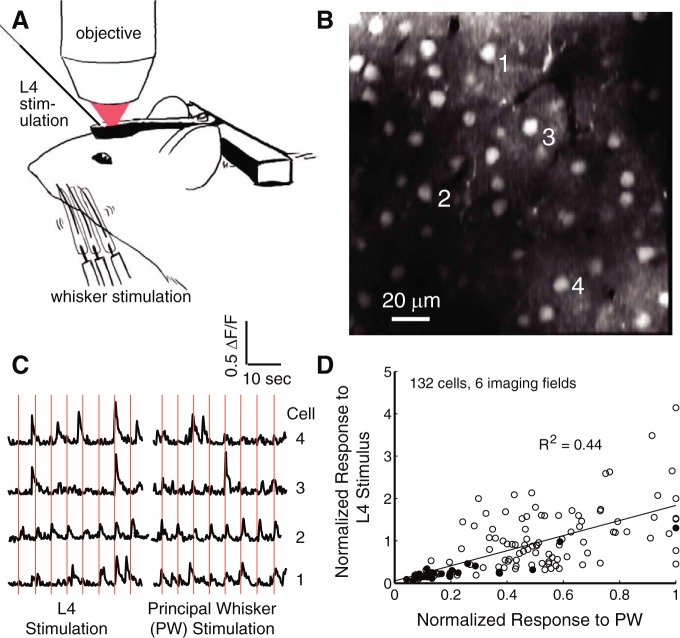
Whisker deflection evokes sparse, low-probability spiking among L2/3 pyramidal cells in rodent somatosensory cortex (S1), with spiking distributed nonuniformly between more and less responsive cells. The cellular and local circuit factors that determine whisker responsiveness across neurons are unclear. To identify these factors, we used two-photon calcium imaging and loose-seal recording to identify more and less responsive L2/3 neurons in S1 slices in vitro, during feedforward recruitment of the L2/3 network by L4 stimulation. We observed a broad gradient of spike recruitment thresholds within local L2/3 populations, with low- and high-threshold cells intermixed. This recruitment gradient was significantly correlated across different L4 stimulation sites, and between L4-evoked and whisker-evoked responses in vivo, indicating that a substantial component of responsiveness is independent of tuning to specific feedforward inputs. Low- and high-threshold L2/3 pyramidal cells differed in L4-evoked excitatory synaptic conductance and intrinsic excitability, including spike threshold and the likelihood of doublet spike bursts. A gradient of intrinsic excitability was observed across neurons. Cells that spiked most readily to L4 stimulation received the most synaptic excitation but had the lowest intrinsic excitability. Low- and high-threshold cells did not differ in dendritic morphology, passive membrane properties, or L4-evoked inhibitory conductance. Thus multiple gradients of physiological properties exist across L2/3 pyramidal cells, with excitatory synaptic input strength best predicting overall spiking responsiveness during network recruitment.
Keywords: cortex; map plasticity; somatosensory; synaptic mechanisms; vibrissa.
Copyright © 2014 the American Physiological Society.
Figures


Similar articles
-
Rapid Disinhibition by Adjustment of PV Intrinsic Excitability during Whisker Map Plasticity in Mouse S1.J Neurosci. 2018 May 16;38(20):4749-4761. doi: 10.1523/JNEUROSCI.3628-17.2018. Epub 2018 Apr 20. J Neurosci. 2018. PMID: 29678876 Free PMC article.
-
Synaptic basis for whisker deprivation-induced synaptic depression in rat somatosensory cortex.J Neurosci. 2006 Apr 19;26(16):4155-65. doi: 10.1523/JNEUROSCI.0175-06.2006. J Neurosci. 2006. PMID: 16624936 Free PMC article.
-
High-velocity stimulation evokes "dense" population response in layer 2/3 vibrissal cortex.J Neurophysiol. 2017 Mar 1;117(3):1218-1228. doi: 10.1152/jn.00815.2016. Epub 2016 Dec 21. J Neurophysiol. 2017. PMID: 28003414 Free PMC article.
-
Stimulus Feature-Specific Control of Layer 2/3 Subthreshold Whisker Responses by Layer 4 in the Mouse Primary Somatosensory Cortex.Cereb Cortex. 2022 Mar 30;32(7):1419-1436. doi: 10.1093/cercor/bhab297. Cereb Cortex. 2022. PMID: 34448808 Free PMC article.
-
Spatiotemporal dynamics of sensory responses in layer 2/3 of rat barrel cortex measured in vivo by voltage-sensitive dye imaging combined with whole-cell voltage recordings and neuron reconstructions.J Neurosci. 2003 Feb 15;23(4):1298-309. doi: 10.1523/JNEUROSCI.23-04-01298.2003. J Neurosci. 2003. PMID: 12598618 Free PMC article.
Cited by
-
A computational model elucidating mechanisms and variability in theta burst stimulation responses.J Comput Neurosci. 2024 Aug;52(3):183-196. doi: 10.1007/s10827-024-00875-1. Epub 2024 Aug 9. J Comput Neurosci. 2024. PMID: 39120822
-
Decoding thalamic afferent input using microcircuit spiking activity.J Neurophysiol. 2015 Apr 1;113(7):2921-33. doi: 10.1152/jn.00885.2014. Epub 2015 Feb 18. J Neurophysiol. 2015. PMID: 25695647 Free PMC article.
-
Inhibitory Circuits in Cortical Layer 5.Front Neural Circuits. 2016 May 6;10:35. doi: 10.3389/fncir.2016.00035. eCollection 2016. Front Neural Circuits. 2016. PMID: 27199675 Free PMC article. Review.
-
Transient enhancement of stimulus-evoked activity in neocortex during sensory learning.Learn Mem. 2024 Jul 2;31(6):a053870. doi: 10.1101/lm.053870.123. Print 2024 Jun. Learn Mem. 2024. PMID: 38955432 Free PMC article.
-
A latent pool of neurons silenced by sensory-evoked inhibition can be recruited to enhance perception.Neuron. 2024 Jul 17;112(14):2386-2403.e6. doi: 10.1016/j.neuron.2024.04.015. Epub 2024 May 9. Neuron. 2024. PMID: 38729150 Free PMC article.
References
-
- Abràmoff MD, Magalhães PJ, Ram SJ. Image processing with ImageJ. Biophotonics Int 11: 36–42, 2004.
-
- Agmon A, Connors BW. Thalamocortical responses of mouse somatosensory (barrel) cortex in vitro. Neuroscience 41: 365–379, 1991. - PubMed
-
- Andermann ML, Moore CI. A somatotopic map of vibrissa motion direction within a barrel column. Nat Neurosci 9: 543–551, 2006. - PubMed
-
- Barlow HB. Single units and sensation: a neuron doctrine for perceptual psychology? Perception 1: 371–394, 1972. - PubMed
Publication types
MeSH terms
Grants and funding
LinkOut - more resources
Full Text Sources
Other Literature Sources