. 2014 Apr 16;34(16):5431-46.
doi: 10.1523/JNEUROSCI.0511-14.2014.

Interaction of egocentric and world-centered reference frames in the rat posterior parietal cortex

Affiliations

Interaction of egocentric and world-centered reference frames in the rat posterior parietal cortex

Aaron A Wilber et al. J Neurosci. .

Abstract

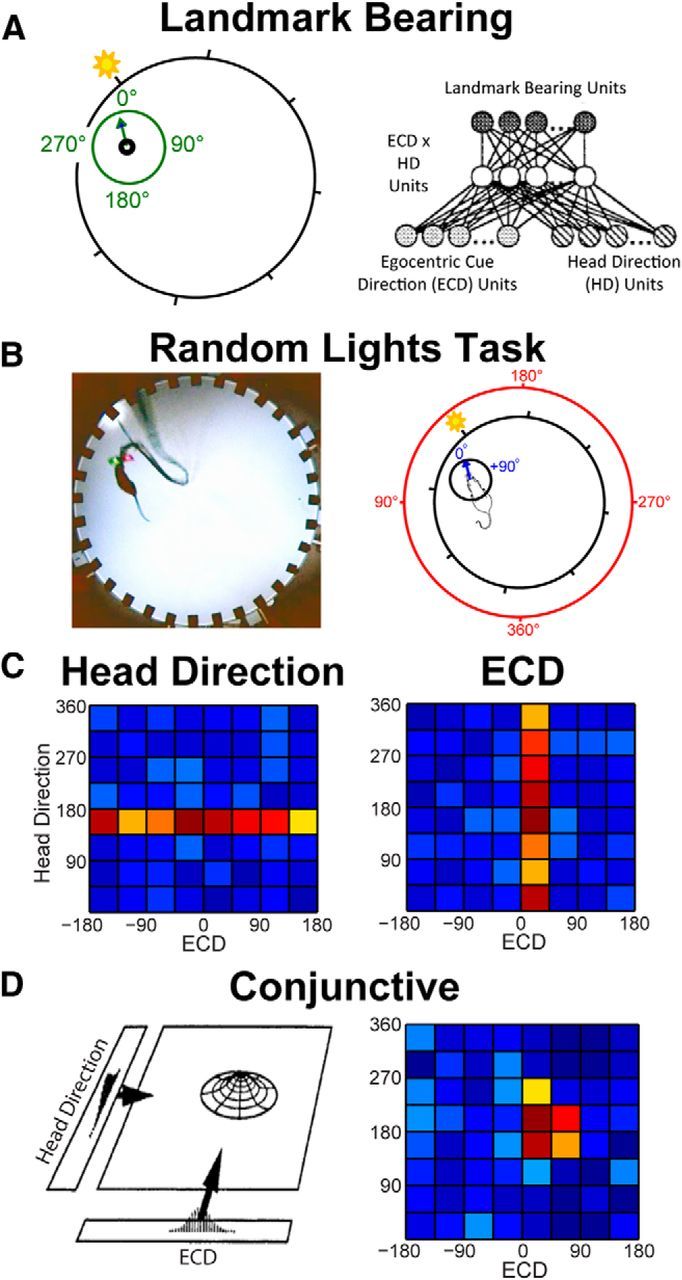
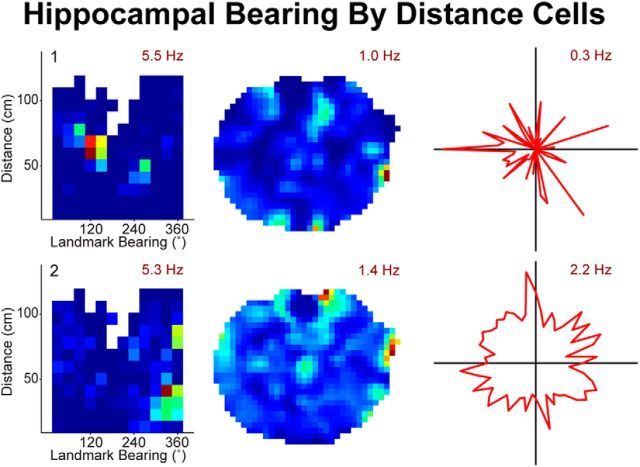
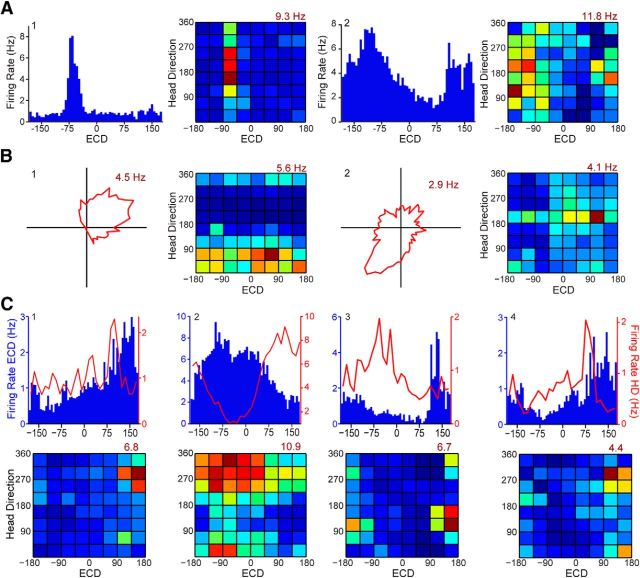
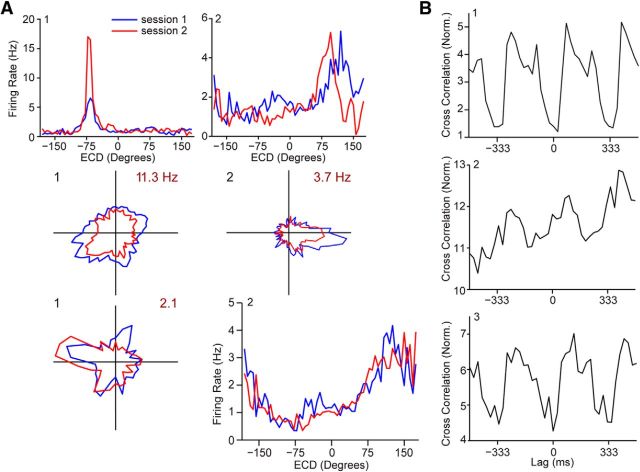
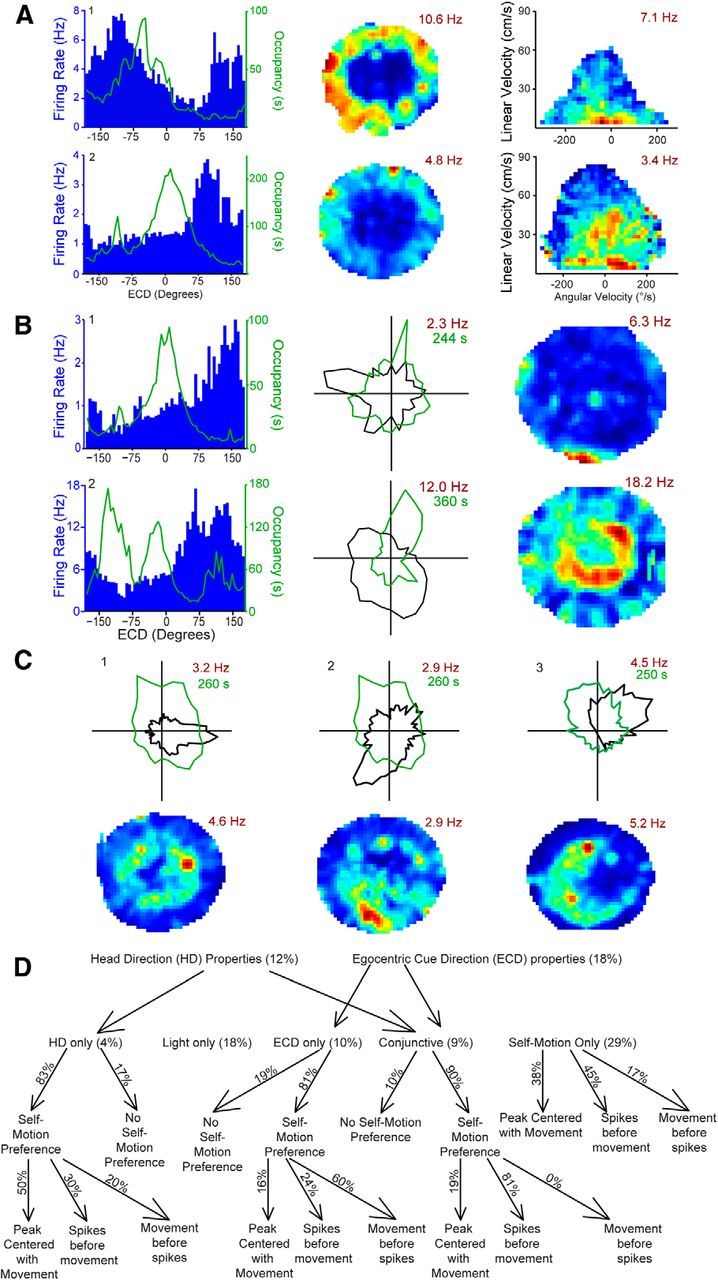
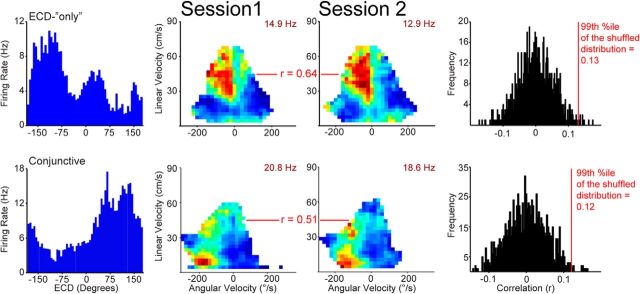
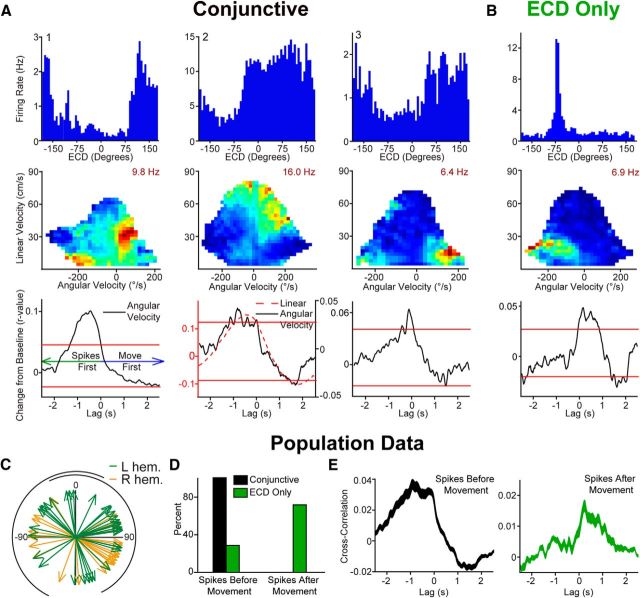
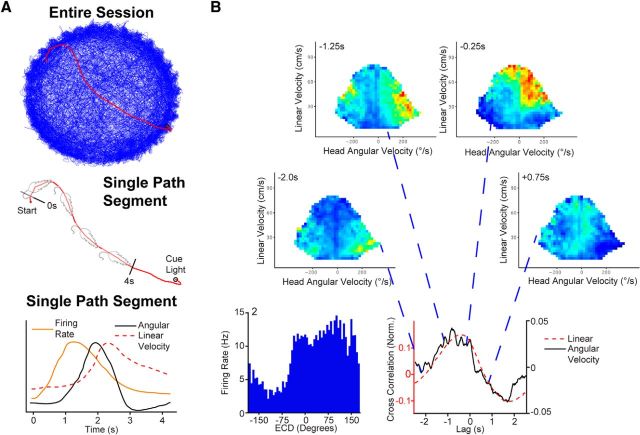
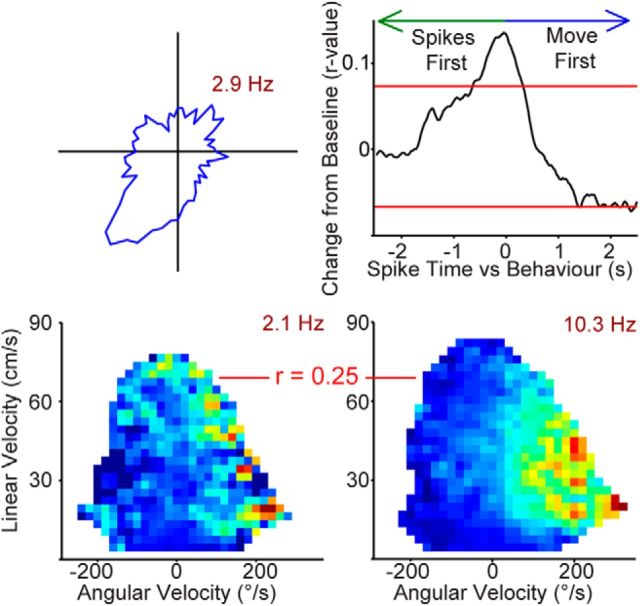
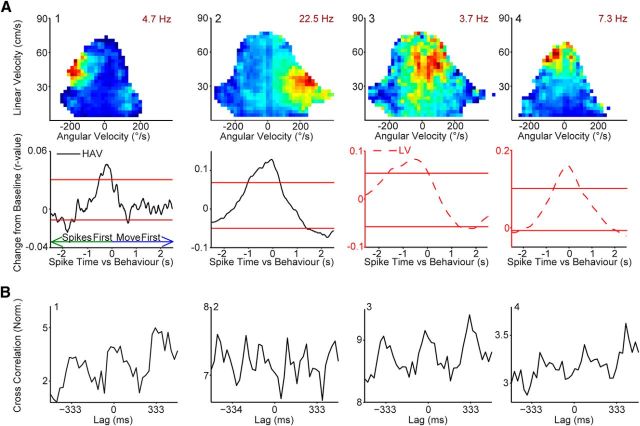
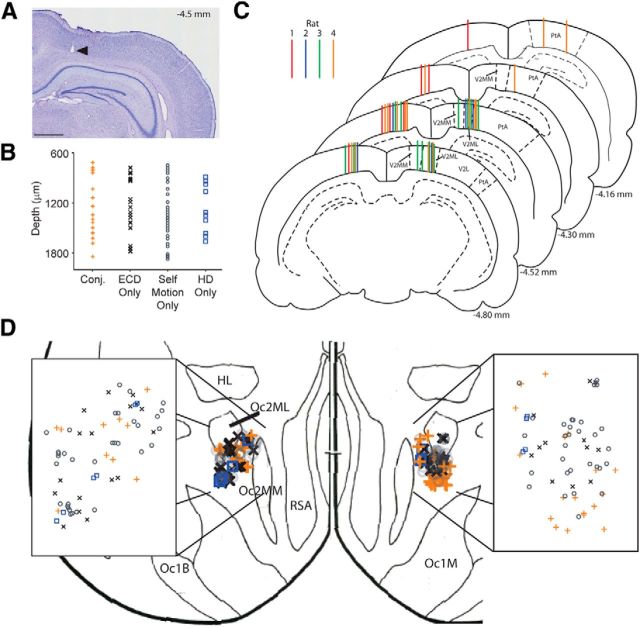
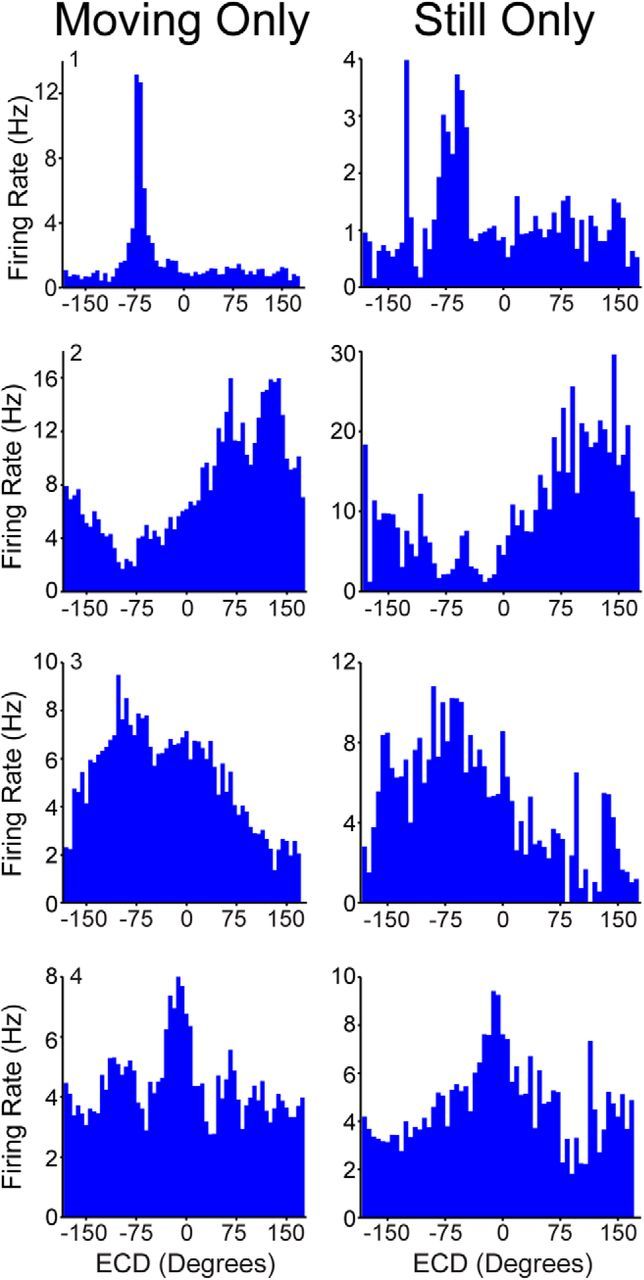
Navigation requires coordination of egocentric and allocentric spatial reference frames and may involve vectorial computations relative to landmarks. Creation of a representation of target heading relative to landmarks could be accomplished from neurons that encode the conjunction of egocentric landmark bearings with allocentric head direction. Landmark vector representations could then be created by combining these cells with distance encoding cells. Landmark vector cells have been identified in rodent hippocampus. Given remembered vectors at goal locations, it would be possible to use such cells to compute trajectories to hidden goals. To look for the first stage in this process, we assessed parietal cortical neural activity as a function of egocentric cue light location and allocentric head direction in rats running a random sequence to light locations around a circular platform. We identified cells that exhibit the predicted egocentric-by-allocentric conjunctive characteristics and anticipate orienting toward the goal.

Keywords: allocentric; head direction; landmark navigation; posterior parietal cortex; spatial navigation; spatial orientation.


Figures

Figure 1.
Figure 1.
Apparatus, reference frames, and hypothetical response profile for the ECD (egocentric cue direction), head direction, and conjunctive functional cell types. A, Left, Schematic of landmark bearing. Landmark bearing is derived from the position of the cue light with respect to a point in the center of the rat's head. In the video frame shown in B, the landmark bearing is ∼330°. Right, Wiring diagram illustrating hypothetical cell types that could produce landmark bearing units. The population of ECD × head direction cells would provide information about the current landmark ECD and head direction. A specific combination of ECD and head direction corresponds to a single landmark bearing. Thus, landmark bearing cells could “read out” the landmark bearing from the population of ECD × head direction cells. B, Left, Apparatus. Rats are trained to run a random spatial sequence to 32 light locations. This task requires the rat to cover the full range of headings and ECDs at a wide range of spatial locations. Right, Schematic of ECD and head direction for the same video frame. Head direction is derived from the position of the two colored domes, which are fixed with respect to the head. In this video frame, the ECD is approximately +10° and the head direction is ∼160°. C, Hypothetical conjunctive plots (firing rate per 45° of ECD and head direction) for an ideal head direction-only cell (left; horizontal band of high activity spans range of ECDs) and for an ideal ECD-only cell (right; band of high activity spanning range of head directions). D, Left, Head direction and ECD units could combine to produce units which, if thresholded appropriately, would encode a specific combination of both reference frames (adapted from McNaughton et al., 1995). Right, Hypothetical conjunctive plot. Conjunctive cells encode neither head direction nor ECD but a specific combination of these two reference frames.
Figure 2.
Figure 2.
Landmark bearing by distance conjunctive cells may originate from egocentric and head direction units in the PPC. Two examples of hippocampal landmark bearing by distance cells. The hippocampal (CA1) data shown here were collected while rats ran a random spatial sequence to 32 light locations (Fig. 1B). The task required the rat to cover a wide range of cue light bearings (i.e., direction of the cue light independent of head direction) and distances at a wide range of spatial locations. Hippocampal bearing by distance cells have been reported previously (Deshmukh and Knierim, 2013) and were recorded here in the CA1 field of the hippocampus of each of two rats. Hippocampal data were recorded simultaneously with the PPC data reported here. Left, Conjunctive plot (firing rate per 30° of cue light bearing and distance). Firing rate for cue light bearing and distance from the cue light (calculated in pixels and shown as centimeters for graphical purposes) suggests that these cells encode a specific combination of cue light distance and bearing. Middle, Place fields could confound a bearing by distance analysis (e.g., place field in the center of the maze); however, none of the landmark bearings by distance cells in our dataset had place fields. All colormaps range from 0 (dark blue) to the peak value indicated in maroon. Right, Head direction properties could be a confound for landmark bearing properties; however, none of the conjunctive bearings by distance cells in our dataset had head direction response properties. Smoothed spatial firing rate maps for the same cells. Firing rate per 6° of head direction (red polar plot). Peak firing rate is indicated in maroon.
Figure 3.
Figure 3.
ECD cells, head direction cells, and conjunctive cells in the rat PPC. A, Two ECD cells chosen to illustrate the breadth of tuning. Firing rate per 6° of ECD (blue bars) and corresponding conjunctive plots (colormaps). B, Two head direction cells chosen to illustrate the breadth of tuning that is observed across head direction cells. Firing rate per 6° of head direction (red polar plot) and corresponding conjunctive plots (colormaps). A, B, Conjunctive plots with vertical (ECD) and horizontal (head direction) bars of elevated activity confirm “only” classifications (based on our two-part Rayleigh and stability criteria). C, Four examples of conjunctive cells chosen to illustrate that there are both broadly and narrowly tuned conjunctive cells. Firing rate for ECD (blue bars; 6° bins) and head direction (HD; red line; 12° bins; top row). To be categorized as a conjunctive cell, the Rayleigh had to be significant for head direction, the Rayleigh had to be significant for ECD, the head direction had to be stable across behavioral sessions, and the ECD had to be stable across behavioral sessions. Corresponding conjunctive plots (bottom row) confirm these cells actually encode a specific combination of the two reference frames. All colormaps have an evenly spaced color range from 0 (dark blue) to peak indicated in maroon.
Figure 4.
Figure 4.
All cell types were required to be stable for inclusion and ECD cells are modulated by the blinking of the cue light. A, Top, Two ECD cells that met the two-part stability and Rayleigh criteria. Firing rate for ECD (6° bins) for individual sessions. Cells were classified as having ECD properties if they had a significant Rayleigh test for unimodal deviation from a uniform distribution and were stable (change in mean vector direction < 7 bins) across behavioral sessions. Middle, Two head direction cells that met the two-part stability and Rayleigh criteria. Firing rate for head direction (6° bins) for individual sessions. Cells were classified as having head direction properties if they had a significant Rayleigh test and were stable (change in peak vector direction of < 7 bins) across maze sessions. Bottom, Two conjunctive cells that met the four-part stability and Rayleigh criteria, i.e., conjunctive cells had to meet both the two-part ECD criteria and the two-part head direction criteria. Firing rate for head direction (left; polar plot; 12° bins) and ECD (right; 6° bins) for individual sessions. B, A substantially higher proportion of ECD cells were modulated by the blinking of the cue light (68%) compared with cells that did not fall into any category (18%; χ2(1) = 34.6, p < 0.0001). The actual proportion of cells with ECD properties modulated by the cue light is likely higher, since the modulation is probably linked to the cue direction receptive field. To have a large enough sample, cross-correlations are conducted for all times when the cue light is active, even when the cue is not in the ECD receptive field for the cell. Time stamps for the onset of each blink of the cue light (target) were cross-correlated with spike time stamps (reference). See Materials and Methods for a detailed description of the cross-correlation procedure and classification. We noticed that for both self-motion and ECD light-modulated cells sometimes light modulation was in phase and other times it was out of phase with the blinking of the light; however, we were unable to find any correspondence between this feature and any of the variables we assessed (e.g., anatomy, cell type).
Figure 5.
Figure 5.
ECD, head direction, and conjunctive cells are active across the space of the maze, and occupancy does not account for the observed effects. A, Left, Firing rate for ECDs (blue bars; 6° bins) with occupancy (green line, s) overlaid. The negative ECD-shifted occupancy is explained by the left turn preference of one rat. Middle, Smoothed spatial firing rate maps for the same cells. Note, the distinct spatial profile exhibited by many cells is likely explained by the relatively stereotyped nature of the task and the limited receptive field of cells with ECD properties. This appears to cause the cells to be active over a large but limited range of spatial locations. Right, Occupancy data and number of spikes are binned according to linear velocity (vertical axis) and head angular velocity (horizontal axis), then converted to firing rate. B, Left, Firing rate for ECDs (blue bars; 6° bins) with occupancy (green line, s) overlaid. Noncentered occupancy is explained by the tendency of one rat to sit for short periods at the end of each trial facing the previous zone (i.e., with the next cue light nearly behind the rat) during the earlier phases of training. Middle, Polar plots of firing rate for head direction (black line; 12° bins) for the same cells. Occupancy (green line, s) is overlaid. Right, Smoothed spatial firing rate maps for the same cells. C, Top, Polar plots of firing rate for head direction (black line; 6° bins) with occupancy (green line, s) overlaid. Bottom, Smoothed spatial firing rate maps for the same cells. A–C, For head direction plots and rate maps the peak firing rate is indicated in maroon. D, Cell-type categories. Despite the stringent two-part criteria for most categories, a majority of the cells could be classified (∼75%). Note that the number of cells is different for the first and second rows of this schematic because the analyses for some cell types further down the chart required more trials for sufficient occupancy and thus were conducted on a slightly smaller subset of cells. “Light only” cells showed cue light modulation but did not fall into any of the other cell types.
Figure 6.
Figure 6.
Most cells with ECD properties have a preferred orienting direction. Left column, ECD-only (top) and conjunctive (ECD × head direction; bottom) cell ECD plots (blue bars; firing rate/6° ECD). Middle two columns, Cells were classified as having a preferred self-motion state if the self-motion maps for two behavioral sessions were significantly positively correlated (99th percentile of random shuffled distribution). Self-motion maps from two behavioral sessions and corresponding correlation values are shown for one example cell from each functional type category. Occupancy data and number of spikes are binned according to linear velocity (vertical axis) and head angular velocity (horizontal axis; positive head angular velocity corresponds to a right turn), then converted to firing rate. Note, motion modulation and ECD encoding are sometimes apparent as two distinct peaks in ECD plots. For example, the ECD-only cell (top) has two peaks, one on the left (presumably the ECD receptive field for this cell) and a second peak in the middle (likely from the straight, forward linear motion-related activity). The cue light would be in front of the rat during forward motion and would create a second false ECD peak near 0°. Right column, The shuffled distribution and critical r value corresponding to the 99th percentile is shown for each example cell. For each cell, the map from the first behavioral session was shuffled 500 times and a correlation coefficient was computed between the shuffled and unshuffled maps. Then, this process was repeated to shuffle the map for the second session 500 times (total 1000 shuffles/cell) to calculate a critical r value for the 99th percentile (p < 0.01). See Materials and Methods for additional details.
Figure 7.
Figure 7.
Conjunctive cell activity anticipates movement toward the cue while ECD-only cells reflect the current position of the cue. A, Examples of three conjunctive cells illustrating that conjunctive cells typically anticipate movement with either long latency (nearly 1 s, left and middle columns) or short latency (175 ms; right column). Top, Firing rate for ECDs (blue bars; 6° bins). Middle, Occupancy data and number of spikes are binned according to linear velocity (vertical axis) and head angular velocity (horizontal axis), then converted to firing rate. Max firing rate ranges from 0 (dark blue) to the peak value indicated in maroon. Bottom, Cross-covariance between preferred self-motion (e.g., for a right turn cell like 1 or 3 firing rate was cross-correlated with angular velocity) and cell activity revealed that conjunctive cells anticipate movement. Red horizontal lines denote the 95% confidence interval for head angular velocity (not linear velocity) for the same cells. The confidence intervals were generated from jittering spike times a random amount between ±1.5 s, calculating the cross-covariance, repeating this process 1000 times, then collapsing across lags for the complete shuffled cross-covariance dataset and calculating the 95% confidence interval. B, Most ECD-only cells show the opposite pattern, turning precedes activity, suggesting turning into the ECD receptive field. C, Tuning for the population of cells with ECD properties is distributed to the sides of the rat (mean vector = 91°, p ≤ 0.01; left hemisphere green; right hemisphere orange). Black semicircles indicate approximate rat visual field (Adams and Forrester, 1968). Note, some cells with tuning toward the periphery of the visual field wrap to the opposite visual field so that the mean tuning direction is behind the rat and outside of the visual field (e.g., A # 3 and Fig. 3A # 2). D, Population data are consistent with examples shown in A and B. A significantly higher proportion of conjunctive cells were active before movement than ECD-only cells (χ2 (1) = 21.3, p < 0.0001). E, Mean (±SEM; shaded) cross-covariance for conjunctive cells that were active before movement (black; left) and ECD-only cells that were active after movement (green; middle). The population data confirms the single-cell examples illustrating that the population of conjunctive cells anticipates movement with either short or long latency (apparent as two bumps on the population plot at approximately −1 s and −175 ms) while turning tends to precede activity for ECD-only cells with short latency.
Figure 8.
Figure 8.
Conjunctive cells anticipate movement. A, Top, Path plot for a real day session (blue line). Middle, Single segment from the real complete path plot (also shown in red on complete path plot) from the session shown (top). Bottom, Hypothetical temporal relationship between firing rate, angular velocity, and linear velocity from a single segment where the behavior of the animal produced the conjunctive cue position and head direction necessary to activate this cell. If this pattern were repeated on other segments the cross-covariance plot for all segments shown in B would result. If there were no anticipation all three peaks would be aligned or the firing rate peak would follow peaks in velocity. B, Conjunctive cell 2 from Figure 7A, left. Firing rate for ECDs (blue bars; 6° bins). Right, Cross-covariance between preferred self-motion (i.e., left turn and forward linear velocity) and cell activity revealed that this conjunctive cell anticipates right turn movement and also anticipates linear movement. Top, To illustrate the cross-covariance, data shown in a time shift analysis was performed on the self-motion rate map. By shifting the spike time stamps by lags shown at the top of each frame (−2, − 1.25, − 0.25, and +0.75 s) it is possible to illustrate the angular then linear anticipation for this cell. For each frame occupancy, data and number of spikes are binned according to linear velocity (vertical axis) and head angular velocity (horizontal axis) and then converted to firing rate for the spike's data, which are time shifted by the lag listed at the top of the frame. Firing rate ranges from zero (dark blue) to 14 Hz (maroon). For illustrative purposes the self-motion firing rate maps were smoothed by convolving with a Gaussian function for the 2 × 2 bins surrounding each bin in the x and y, but not the z (time) dimension.
Figure 9.
Figure 9.
Most head direction-only cells also encode angular velocity (83%) and some anticipate movement. Top left, Polar plot (blue line; firing rate/6° head direction) for one example cell that is motion modulated. Bottom, Occupancy data and number of spikes are binned according to linear velocity (vertical axis) and head angular velocity (horizontal axis; positive head angular velocity corresponds to a right turn), then converted to firing rate. Cells were classified as having a preferred self-motion state if the self-motion maps for two behavioral sessions were significantly positively correlated (99th percentile of random shuffled distribution). Self-motion maps from two behavioral sessions and corresponding correlation values are shown for this example cell. Max firing rate is in maroon text. Top right, Some of the turn × head direction cells, including this example, also anticipate movement (30%). Cross-covariance between preferred self-motion and cell activity revealed that this head direction-only cell anticipates right turns. This cell had a right turn preferred self-motion state so angular velocity was used. The positive correlation before time 0 indicates anticipation of a right turn by ∼125 ms. Red horizontal lines denote the 95% confidence interval calculated from spike-jittered data for this same cell.
Figure 10.
Figure 10.
Self-motion-only cells are also modulated by the blinking of the cue light, suggesting that optic flow may be at least partially responsible for the activity of these cells. A, Four examples of self-motion-only cells (no cue or head direction properties) are shown. Top, Occupancy data and number of spikes are binned according to linear velocity (vertical axis) and head angular velocity (horizontal axis; positive head angular velocity corresponds to a right turn), then converted to firing rate. Cells were classified as having a preferred self-motion state if the self-motion maps for two behavioral sessions were significantly positively correlated (99th percentile of shuffled distribution). Max firing rate is in maroon. Bottom, Self-motion cells tended to be active either before the onset of movement (45%; e.g., columns 1–3) or simultaneously with the onset of movement (38%; e.g., column 4). Cross-covariance between preferred self-motion (e.g., for a forward motion cell like 3, linear velocity) and cell activity. HAV, head angular velocity; LV, linear velocity. Red horizontal lines denote the 95% confidence interval calculated from spike time-jittered cross-covariances for the same cell. B, Some cells with self-motion-only properties (31%) were modulated by the blinking of the cue light. This suggests that optic flow may be at least partially responsible for the activity of these cells. Four examples are shown of light-modulated, self-motion-only cells. We noticed that for both self-motion and ECD light-modulated cells (Fig. 4), sometimes light modulation is in phase and other times it is out of phase with the blinking of the light; however, we were unable to find any correspondence between this feature and any of the variables we assessed (e.g., anatomy, cell type).
Figure 11.
Figure 11.
Electrode and cell-type placement. A, Nissl-stained coronal sections showing the marking lesion from a tetrode in rat 3 (black arrowhead). This tetrode tract is an example of the most medial tetrode placement and demonstrates that recordings did not encroach on the retrosplenial cortex. Scale bar, 1 mm. B, Approximate tetrode depth (micrometers) from cortical surface at time of recording for conjunctive (Conj.; orange +), ECD-only (black x), self-motion-only (gray ○) cells, and head direction-only (HD) cells (blue □). C, Coronal sections throughout the anterior (top) to posterior (bottom) extent of the rat PPC (Paxinos and Watson, 1998) color coded by rat (7 tracts for rat 1 in red, 5 tracts for rat 2 in blue, 11 tracts for rat 3 in green, and 16 tracts for rat 4 in orange). Each tract indicates the profile for a tetrode that recorded at least one putative pyramidal cell in the PPC during the random lights task. Distance posterior to bregma is listed for each slice (lower right). V2L, secondary visual cortex, lateral area; V2ML, mediolateral area; V2MM, mediomedial area; PtA, parietal association cortex. D, Placement of conjunctive (orange +), ECD-only (black x), self-motion-only (gray ○), and head direction-only (blue □) cells shown on a surface view in the horizontal plane (outlines indicate the 95% confidence interval for each region; adapted from Zilles, 1985). Inset shows magnified region of recording locations from the right hemisphere and demonstrates that functional cell types are not segregated into different anatomical regions. Oc2MM, occipital cortex, area 2, mediomedial part; Oc2ML, occipital cortex, area 2, mediolateral part; Oc2L, occipital cortex, area 2, lateral part; Oc1M, occipital cortex, area 1, monocular part; RSA, agranular retrosplenial cortex; HL, hindlimb area.
Figure 12.
Figure 12.
ECD cells are not an artifact of motion-related firing. Firing rate for ECDs (blue bars; 6° bins) for four example cells with ECD properties. For ECD plots long relatively motionless periods were removed to prevent the influence of a confounding variable while the cue light remained in a similar position (left). However, since most cells with ECD properties are also modulated by specific motion states and our task has a stereotyped component, this suggested a possible confound. Specifically, the cells preferred self-motion state might tend to occur when the cue light was in the same position. In addition to the points described in the Discussion, to further rule out the possibility that self-motion-related firing produced spurious ECD profiles, we analyzed the data segments we had previously excluded, the long relatively still periods. Of the 60 cells with ECD properties 18 had occupancy in at least 90% of the bins for this still-only analysis. These 18 cells were collected from two rats, 7 were conjunctive cells, and 11 were ECD-only cells. Removing periods of movement had no effect on the ECD profiles (right). Further, the mean ECD (i.e., tuning) for the firing rate vector for all 18 cells that were included in this analysis was essentially identical for still only versus moving only data 7.7°±5.3° (mean shift in ECD tuning ± SD; range = 0.5° to 16.3°).

Similar articles

Cited by

References

    1. Adams AD, Forrester JM. The projection on the rats visual field on the cerebral cortex. Q J Exp Physiol. 1968;53:327–336. - PubMed
    1. Andersen RA, Essick GK, Siegel RM. Encoding of spatial location by posterior parietal neurons. Science. 1985;230:456–458. doi: 10.1126/science.4048942. - DOI - PubMed
    1. Berens P. CircStat: a MATLAB toolbox for circular statistics. J Stat Softw. 2009;31:1–21.
    1. Bower MR, Euston DR, McNaughton BL. Sequential-context-dependent hippocampal activity is not necessary to learn sequences with repeated elements. J Neurosci. 2005;25:1313–1323. doi: 10.1523/JNEUROSCI.2901-04.2005. - DOI - PMC - PubMed
    1. Bremner LR, Andersen RA. Coding of the reach vector in parietal area 5d. Neuron. 2012;75:342–351. doi: 10.1016/j.neuron.2012.03.041. - DOI - PMC - PubMed

Publication types