. 2014 Apr 16;34(16):5627-39.
doi: 10.1523/JNEUROSCI.2670-13.2014.

Mechanisms of coordination in distributed neural circuits: encoding coordinating information

Affiliations

Mechanisms of coordination in distributed neural circuits: encoding coordinating information

Carmen Smarandache-Wellmann et al. J Neurosci. .

Abstract

We describe synaptic connections through which information essential for encoding efference copies reaches two coordinating neurons in each of the microcircuits that controls limbs on abdominal segments of the crayfish, Pacifastacus leniusculus. In each microcircuit, these coordinating neurons fire bursts of spikes simultaneously with motor neurons. These bursts encode timing, duration, and strength of each motor burst. Using paired microelectrode recordings, we demonstrate that one class of nonspiking neurons in each microcircuit's pattern-generating kernel--IPS--directly inhibits the ASCE coordinating neuron that copies each burst in power-stroke (PS) motor neurons. This inhibitory synapse parallels IPS's inhibition of the same PS motor neurons. Using a disynaptic pathway to control its membrane potential, we demonstrate that a second type of nonspiking interneuron in the pattern-generating kernel--IRSh--inhibits the DSC coordinating neuron that copies each burst in return-stroke (RS) motor neurons. This inhibitory synapse parallels IRS's inhibition of the microcircuit's RS motor neurons. Experimental changes in the membrane potential of one IPS or one IRSh neuron simultaneously changed the strengths of motor bursts, durations, numbers of spikes, and spike frequency in the simultaneous ASCE and DSC bursts. ASCE and DSC coordinating neurons link the segmentally distributed microcircuits into a coordinated system that oscillates with the same period and with stable phase differences. The inhibitory synapses from different pattern-generating neurons that parallel their inhibition of different sets of motor neurons enable ASCE and DSC to encode details of each oscillation that are necessary for stable, adaptive synchronization of the system.

Keywords: central pattern generators; efference copy; locomotion; swimmeret rhythm; synaptic range.


Figures

Figure 1.
Figure 1.
Segmental organization of the swimmeret system of crayfish. A, The abdominal nerve cord and its ganglia A1 to A6 is part of the CNS. Only ganglia A2 to A5 innervate the four pairs of swimmerets in the crayfish, P. leniusculus. The system is bilaterally symmetric, and for these experiments, only information from the ipsilateral side was relevant. B, Each swimmeret is driven by its own local microcircuit (∼), represented by the large colored circle. The color scheme will be preserved throughout this paper to indicate the microcircuit from which recordings were made. From each segment, coordinating information leaves anteriorly (ASCE) and posteriorly (DSC, except A5), and projects to all the ganglia in the swimmeret system. C, The neuronal organization of one microcircuit and potential connections from the pattern-generating kernel of the microcircuit to the coordinating neurons ASCE and DSC. The intent of this investigation is to determine which of the two interneurons (IPS or IRS) directly tunes the activity of ASCE and DSC. All neurons active in phase are depicted by the same gray gradient. Filled black circle: inhibitory synapse; triangle: excitatory synapse. Size represents gradient of synaptic strength. Red connections are the possible connections from the pattern-generating kernel, IPS or IRS, to ASCE and DSC. CI1, Commissural Interneuron 1 or ComInt1. D, Boxplots of two cycles of the motor output from one module. A PS burst starts each cycle. RS bursts occur in antiphase. The timing of the coordinating neurons is correlated with this activity; ASCE is active in phase with PS while DSC is in phase with RS motor neurons.
Figure 2.
Figure 2.
A, Two whole-mount preparations of two different abdominal ganglia, seen from the dorsal side. Ai, IPS filled with dTR. Aii, One ASCE neuron filled with dTR. The soma of ASCE is posterior to the base of N1, and is located in the same region as the IPS soma. B, Schematic drawing of the placement of the sharp intracellular electrodes for IPS and ASCE. Alternatively, ASCE was recorded extracellularly with a suction electrode placed on the anterior MnT where ASCE's axon passes dorsally to the LG. C, Simultaneous extracellular recordings of PS and ASCE and intracellular recording of IPS, all from the same microcircuit, depicting the parameters (period, burst duration, and burst strength) measured in each experiment. PS burst strength was measured by rectifying and smoothing the extracellular recording, with the integral above a threshold representing the burst strength. IPS potential oscillated with the motor output, always hyperpolarizing during PS and ASCE bursts and depolarizing during the interburst interval. The “trough potential” was the most hyperpolarized potential during the oscillation, and the oscillation amplitude was measured from the trough potential to the peak of the oscillation.
Figure 3.
Figure 3.
Simultaneous intracellular recordings of ASCE and IPS neurons. A, Traces from top to bottom, Extracellular recording of PS in ganglion A3 (PS3) and A4 (PS4), intracellular recordings of ASCE and IPS, both in A4. Ai, ASCE depolarization and hyperpolarization, gray bar (±1.5 nA), affected only the target PS3, but not IPS or its own microcircuit. Aii, IPS depolarization and hyperpolarization, gray bar (±1.5 nA), affected the PS activity of its own microcircuit and changed ASCE activity. B, The 50 ms long current pulses injected into IPS affected the membrane potential of ASCE. Here, >50 traces were overlaid (gray), with the average potential superimposed in black. Bi, IPS depolarization (+1.5 nA) immediately (delay of 3.3 ± 0.3 ms) hyperpolarized the ASCE membrane potential. Bii, IPS hyperpolarization (−1.5 nA) immediately (delay of 3.2 ± 0.4 ms) depolarized the ASCE membrane potential. Biii, Comparison between the two responses in ASCE. C, Circuit diagram of one microcircuit. ASCE activity is controlled by direct inhibition from the IPS interneuron. Di, Plot of the ASCE input resistance (Rin) measured during an ongoing rhythm (normalized, N = 5 expts.). Gray bar represents the average PS burst duration. Rin maxima are found at the end of the PS burst, Rin minima at the beginning of the PS burst. Dii, Comparison of membrane potential oscillation of ASCE and IPS, recorded in two different experiments. Here 20 ASCE (red) and 20 IPS (gray) traces were superimposed while their cycle period was normalized (gray bar represents the average PS burst duration).
Figure 4.
Figure 4.
IPS potential controls ASCE activity. A, Extracellular recordings of ASCE4 and PS4 together with the intracellular recording of IPS in A4 (voltage and current trace). IPS was recorded in dSeVC mode and depolarized from the trough potential, − 56 mV (Ai), to −41 mV (Aii), and to −36 mV (Aiii). Each depolarizing step reduced the number of ASCE spikes per burst. Aiv, When IPS was hyperpolarized to −73 mV the number of ASCE spikes per burst increased. B, The normalized numbers of ASCE spikes per burst were plotted as functions of the IPS holding potential. In five of five experiments, IPS was recorded in DCC mode, and in three of these five experiments in dSeVC mode. ASCE spikes per burst in each experiment were smoothed with a robust Lowess protocol. In all experiments, the number of ASCE spikes per burst remained similar when IPS membrane potential was between −100 mV and the mean trough potential of −55.7 ± 4.5 mV. From approximately − 55 to −30 mV the numbers of spikes per burst decreased monotonically.
Figure 5.
Figure 5.
IPS membrane potential controls different ASCE parameters; IPS was recorded in dSeVC mode. Red dots, IPS was depolarized in 1 mV steps from the trough potential (−55 mV) to the maximal depolarized state (−30 mV). Blue dots, IPS was repolarized in 1 mV steps from the most depolarized membrane state (−30 mV) to the maximal hyperpolarized state (−100 mV). For each IPS potential the numbers of ASCE spikes per burst (Ai), burst duration (Bi), and spike frequency within bursts (Ci) were measured for at least 15 bursts. The means ± SD were plotted as functions of IPS potential. Monotonic changes in the numbers of ASCE spikes per burst (Aii) and burst duration (Bii) were observed in the expansions from −55 to −25 mV. Hysteresis between the depolarizing and repolarizing epochs of this experiment was also apparent. C, An abrupt change in spike frequency was observed during increasing depolarization (expanded in Cii).
Figure 6.
Figure 6.
Plot of the linear correlation between PS burst strength and ASCE burst strength in the same microcircuit (N = 3 expts.).
Figure 7.
Figure 7.
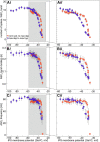
Changing IPS membrane potential in one segment influenced PS burst strength in its own microcircuit and in microcircuits in adjacent segments. Examples are from two different experiments (A, B). Colors mark the segment where recordings were made (as per Fig. 1). A, IPS was recorded in A4. Burst strengths of PS4, PS3 (anterior to perturbation), and PS5 (posterior to perturbation) were measured and plotted as functions of IPS potential in A4. B, IPS was recorded in A3. Burst strengths of PS3, PS2 (anterior to perturbation), and PS4 (posterior to perturbation) were measured and plotted as functions of the IPS holding potential in A3. Ai, Bi, IPS potential affected PS burst strength in the home segment in the same way that it affected ASCE activity (see inset). The strongest, monotonic change was observed when IPS was depolarized from −55 mV up to −30 mV. There was no change in PS burst strength when IPS was hyperpolarized beyond −55 mV. Aii, Bii, The microcircuit anterior to the clamped IPS neuron received altered ASCE information. The strengths of PS bursts in the anterior microcircuit plotted as functions of the IPS potential from the posterior ganglion followed a similar monotonic decline as the curves in Ai and Bi. Aiii, Biii, Microcircuits posterior to the clamped IPS neuron also changed the strengths of PS bursts, but in a different way. In these posterior microcircuits, PS burst strength remained steady from −100 to −65 mV of IPS potential in the anterior ganglion, but PS burst strength increased as IPS was depolarized above −65 mV.
Figure 8.
Figure 8.
IPS membrane potential also affects DSC activity. A, Whole mount of one abdominal hemiganglion, seen from the dorsal side. DSC is filled with dTR. B, Diagram of electrode placement in this experiment. IPS was recorded intracellularly with sharp microelectrodes in the LN, while DSC was recorded extracellularly with a suction electrode, placed on the posterior MnT where DSC's axon passes dorsally to the LG. C, Effect of IPS on DSC and PS activity in the same microcircuit. The three traces from top to bottom, Extracellular recordings of PS and DSC, and an intracellular recording of IPS. When IPS was hyperpolarized to −80 mV (current injection of −0.5 nA), the number of DSC spikes per burst dropped compared with the control (when no current was injected). During depolarization, DSC activity increased. The effect observed in Figure 7Aiii and Biii resulted from this change in the activity of the coordinating neuron DSC, which projects to posterior modules.
Figure 9.
Figure 9.
ComInt1 membrane potential influences DSC activity. A, Whole-mount preparations of one abdominal ganglion, seen from the dorsal side. ComInt1 is filled with dTR. B, Diagram of the placement of the electrodes for this experiment. ComInt1 (CI1) was recorded intracellularly with sharp microelectrodes at the midline, while DSC was recorded extracellularly with suction electrodes. Bi, Simultaneous extracellular recordings of PS and DSC and intracellular recording of ComInt1, all from the same microcircuit. Parameters measured: period, duration of the DSC burst, and number of spikes per DSC burst. C, Schematic drawing of the connection in one microcircuit. A new synapse is postulated, the inhibitory synapse from IRS to DSC. D, When ComInt1 was hyperpolarized (−2.25 nA, gray bar), DSC activity increased and PS bursts weakened, compared with no current injection into ComInt1. During ComInt1 depolarization (+2 nA), PS bursts strengthened and DSC bursts were shorter with fewer spikes per burst. Traces from top to bottom: Extracellular recordings of PS and DSC, and an intracellular recording of ComInt1. E, DSC parameters affected by different holding potentials of ComInt1 (DCC-mode recordings). Burst duration (Ei) and number of spikes in each DSC burst (Eii) decreased with depolarization of ComInt1 membrane potential. Eiii, DSC frequency was smallest during hyperpolarization of ComInt1, and increased with a depolarized membrane potential of ComInt1 (shown for N = 3 expts.).
Figure 10.
Figure 10.
The synaptic organization of the intersegmental circuit that coordinates swimmeret microcircuits in ganglia A2 to A5. In each microcircuit, the coordinating information in ASCE and DSC is driven via direct inhibitory connection from the microcircuits pattern-generating kernel. IPS shapes ASCE activity through a direct inhibitory connection and we have strong evidence that IRS also shapes DSC activity through an inhibitory synapse. This new information, combined with the recently published results that ComInt1 (CI1) transmits the coordinated information through an electrical synapse to an IRS neuron in the microcircuit's pattern-generating kernel, yields a new model of the system, depicted here. Symbols and colors are the same as Figure 1. Arrows indicate the direction of impulse traffic in coordinating axons and motor axons.

References

    1. Bagnall MW, McLean DL. Modular organization of axial microcircuits in zebrafish. Science. 2014;343:197–200. doi: 10.1126/science.1245629. - DOI - PMC - PubMed
    1. Bell CC. An efference copy which is modified by reafferent input. Science. 1981;214:450–453. doi: 10.1126/science.7291985. - DOI - PubMed
    1. Bicanski A, Ryczko D, Knuesal J, Harischandra N, Charrier V, Ekeberg Ö, Cabelguen JM, Ijspeert AJ. Decoding the mechanisms of gait generation in salamanders by combining neurobiology, modeling and robotics. Biol Cybern. 2013;107:545–564. doi: 10.1007/s00422-012-0543-1. - DOI - PubMed
    1. Burrows M. Synaptic potentials effect the release of transmitter from locust non-spiking interneurons. Science. 1979;204:81–83. doi: 10.1126/science.34878. - DOI - PubMed
    1. Büschges A, Borgmann A. Network modularity: back to the future in motor control. Curr Biol. 2013;23:R936–R938. doi: 10.1016/j.cub.2013.09.021. - DOI - PubMed

Publication types

LinkOut - more resources