. 2014 Jun 15;127(Pt 12):2627-38.
doi: 10.1242/jcs.134833. Epub 2014 Apr 16.

Cadherin-11 regulates both mesenchymal stem cell differentiation into smooth muscle cells and the development of contractile function in vivo

Affiliations

Cadherin-11 regulates both mesenchymal stem cell differentiation into smooth muscle cells and the development of contractile function in vivo

Stella Alimperti et al. J Cell Sci. .

Abstract

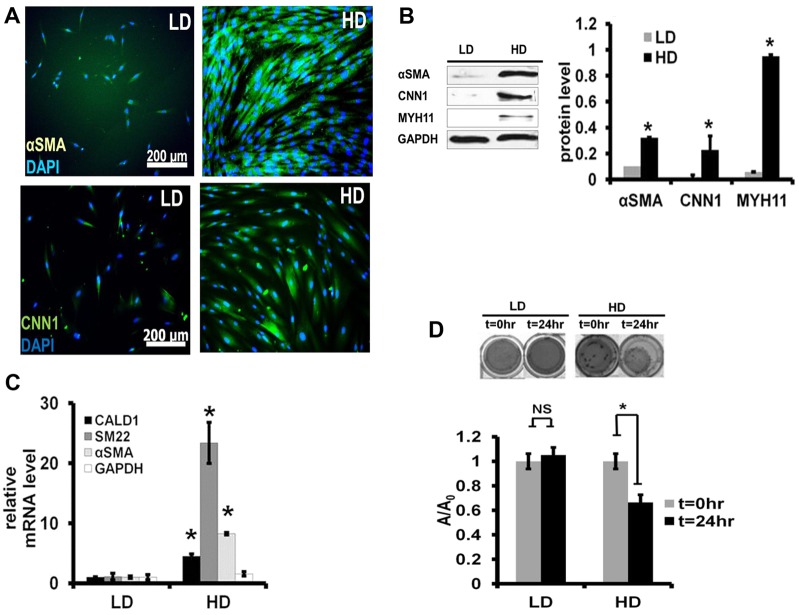
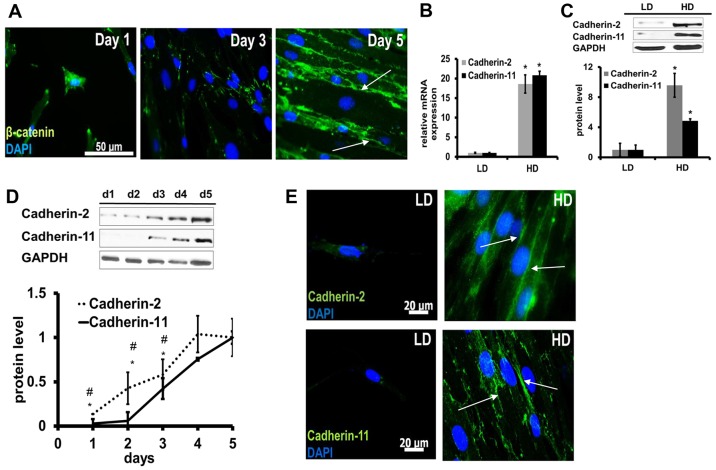
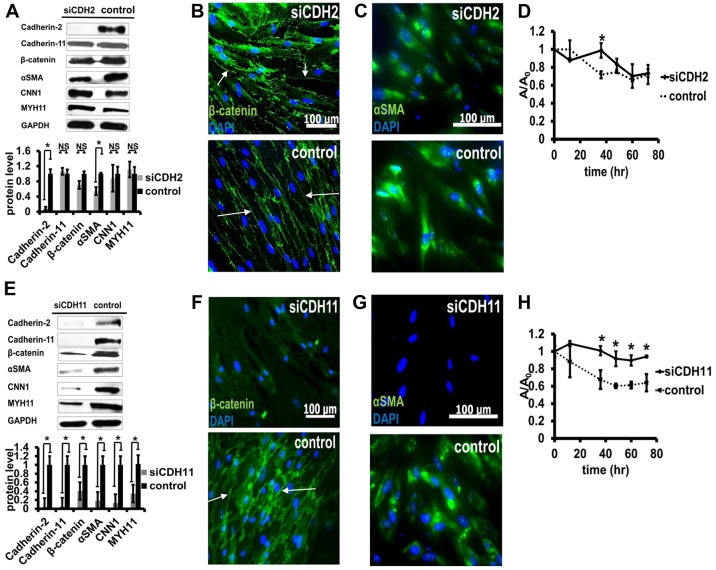
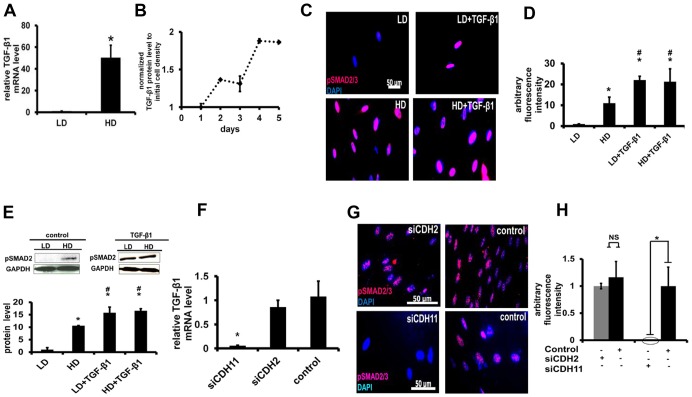
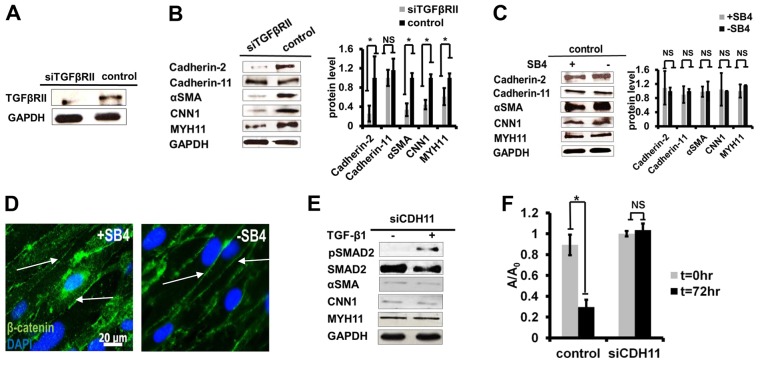
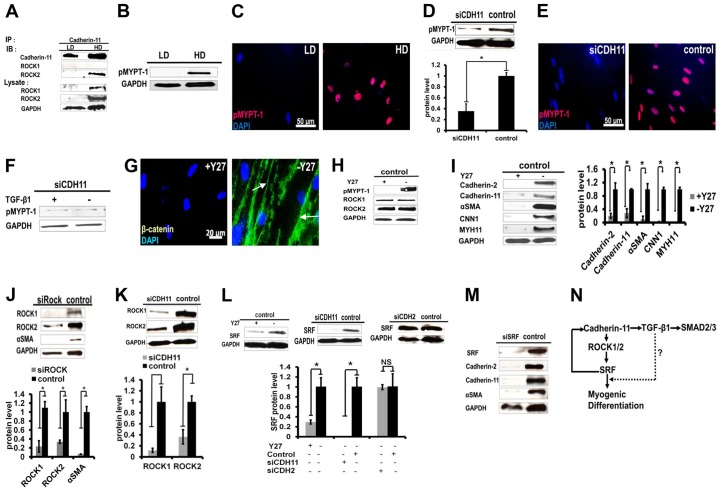
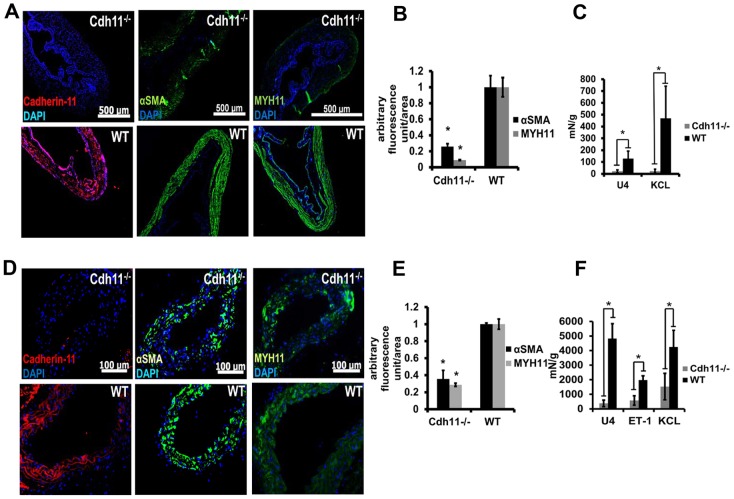
Although soluble factors, such as transforming growth factor β1 (TGF-β1), induce mesenchymal stem cell (MSC) differentiation towards the smooth muscle cell (SMC) lineage, the role of adherens junctions in this process is not well understood. In this study, we found that cadherin-11 but not cadherin-2 was necessary for MSC differentiation into SMCs. Cadherin-11 regulated the expression of TGF-β1 and affected SMC differentiation through a pathway that was dependent on TGF-β receptor II (TGFβRII) but independent of SMAD2 or SMAD3. In addition, cadherin-11 activated the expression of serum response factor (SRF) and SMC proteins through the Rho-associated protein kinase (ROCK) pathway. Engagement of cadherin-11 increased its own expression through SRF, indicative of the presence of an autoregulatory feedback loop that committed MSCs to the SMC fate. Notably, SMC-containing tissues (such as aorta and bladder) from cadherin-11-null (Cdh11(-/-)) mice showed significantly reduced levels of SMC proteins and exhibited diminished contractility compared with controls. This is the first report implicating cadherin-11 in SMC differentiation and contractile function in vitro as well as in vivo.

Keywords: Adherens junctions; Cell–cell adhesion; Differentiation; Mesenchymal stem cells; Smooth muscle cells; Vascular contractility.


Figures

Fig. 1.
Fig. 1.
Cell–cell contact promotes myogenic differentiation of HF-MSCs. HF-MSCs were seeded at 3×10³ (low density, LD) or 30×103 cells/cm2 (high density, HD) and, 5 days later, they were evaluated. (A) Immunostaining for αSMA (green, upper panels) or CNN1 (green, lower panels). Nuclei were counterstained with DAPI (blue). Scale bars: 200 µm. (B) Western blots for αSMA, CNN1 and MYH11 (left panel) were quantified to show relative protein levels (right panel). (C) qRT-PCR analysis of αSMA, CALD1 and SM22. Data show the mean±s.d.; *P<0.05 between high-density and low-density cells. (D) Fibrin hydrogel compaction. Cells were embedded in fibrin hydrogels (106 cells/ml) in the presence of growth medium. After polymerization, the gels were released from the walls and 24 h later the gels were photographed. The area of each gel (‘A’) was measured using ImageJ software and normalized to the initial area (A0). Data show the mean±s.d.; *P<0.05; NS, not significant.
Fig. 2.
Fig. 2.
Cell–cell contact increases cadherin-11 expression. (A) Kinetics of adherens junction formation. HF-MSCs were seeded at 2×10⁴ cells/cm2 and on day 1, 3 or 5 they were immunostained for β-catenin (green). Arrows indicate adherens junctions. Scale bar: 50 µm. (B,C) HF-MSCs were seeded at 3×10³ (low density, LD) or 30×103 cells/cm2 (high density, HD) and, 5 days later, they were evaluated. (B) qRT-PCR and (C) western blotting for cadherin-2 and cadherin-11. Data show the mean±s.d.; *P<0.05 between the high-density and low-density samples. (D) Kinetic profile of cadherin-2 or cadherin-11 proteins over a period of 5 days (seeding density of 2×10⁴ cells/cm2). Data show the mean±s.d.; *P<0.05 between the corresponding time-point and day 5 for cadherin-2; #P<0.05 between the corresponding time-point and day 5 for cadherin-11. (E) Immunostaining for cadherin-11 (green, lower panels) and cadherin-2 (green, upper panels) in high-density and low-density cultures. In A and E, nuclei were counterstained with DAPI (blue). Arrows indicate adherens junctions. Scale bars: 20 µm.
Fig. 3.
Fig. 3.
Cadherin-11 but not cadherin-2 is required for cell-density-induced myogenic differentiation. (A) Western blots of cadherin-2, cadherin-11, β-catenin, αSMA, CNN1 and MYH11 in siCDH2 and control HF-MSCs (upper panel) were quantified to show relative protein levels (lower panel). (B) Immunostaining for β-catenin (green) in siCDH2 and control HF-MSCs. Arrows indicate adherens junctions. (C) Immunostaining for αSMA (green) in siCDH2 and control HF-MSCs. (D) Kinetics of hydrogel compaction by siCDH2 or control HF-MSCs embedded in fibrin hydrogels (106 cells/ml). After polymerization, the gels were released from the walls and photographed at the indicated times. At each time-point, the area of each gel (‘A’) was measured using ImageJ software and normalized to the initial area (A0). (E) Western blots of cadherin-2, cadherin-11, β-catenin, αSMA, CNN1 and MYH11 in siCDH11 and control cells (upper panel) were quantified to show relative protein levels (lower panel). For A and E, data show the mean±s.d.; *P<0.05; NS, not significant. (F) Immunostaining for β-catenin (green) in siCDH11 and control cells. Arrows indicate adherens junctions. (G) Immunostaining for αSMA (green) in siCDH11 and control cells. In B, C, F and G, nuclei were counterstained with DAPI (blue). All scale bars: 100 µm. (H) Kinetics of fibrin hydrogel compaction by siCDH11 or control HF-MSC. For D and H, data show the mean±s.d.; *P<0.05 between the indicated sample and the corresponding control.
Fig. 4.
Fig. 4.
High cell density increases the expression of TGF-β1. HF-MSCs were seeded at 3×10³ (low density, LD) or 30×103 cells/cm2 (high density, HD). (A) qRT-PCR for TGF-β1 on day 5 post-seeding. *P<0.05 between high-density and low-density cells. (B) HF-MSCs were seeded at 2×10⁴ cells/cm2, and the concentration of TGF-β1 protein in the medium was measured by enzyme-linked immunosorbent assay (ELISA) over a period of 5 days. (C) Immunostaining on day 3 for pSMAD2/3 (pink). (D) Quantification of nuclear pSMAD2/3 fluorescence intensity per cell. (E) Western blots for pSMAD2 (upper panels) were quantified to show relative protein levels (lower panel). For D and E, *P<0.05 between the indicated samples and the low-density sample; #P<0.05 between the high-density sample and HD+TGF-β1 or LD+TGF-β1. (F) qRT-PCR for TGF-β1 in siCDH11, siCDH2 or control cells on day 5 post-seeding. *P<0.05 between siCDH11 and control cells. (G) Immunostaining for pSMAD2/3 (pink) in siCDH2 or siCDH11 cells. In C and G, nuclei were counterstained with DAPI (blue). Scale bars: 50 µm. (H) Quantification of the fluorescence intensity per cell using ImageJ. *P<0.05; NS, not significant. All quantitative data are shown as the mean±s.d.
Fig. 5.
Fig. 5.
High-density-induced SMC differentiation is dependent on TGFβRII signaling. (A,B) siTGFβRII cells were seeded at high-density and, 5 days later, they were lysed. (A) Western blot for TGFβRII. (B) Western blots for cadherin-2, cadherin-11, αSMA, CNN1 and MYH11 (left panel) were quantified to show relative protein levels (right panel). (C) HF-MSCs were seeded at 3×10⁴ cells/cm2 and were treated with SB4 (10 µM) for 5 days. Western blots for cadherin-2, cadherin-11, αSMA, CNN1 and MYH11 (left panel) were quantified to show relative protein levels (right panel). (D) Immunostaining for β-catenin (green). Nuclei were counterstained with DAPI (blue). Arrows indicate adherens junctions. Scale bar: 20 µm. (E) siCDH11 cells were treated with TGF-β1 for 3 days or remained untreated, and the indicated proteins were measured by western blotting. (F) Fibrin hydrogel compaction with siCDH11 or control cells in the presence of exogenous TGF-β1 (10 ng/ml). At each time-point, the area of each gel (‘A’) was measured using ImageJ software and normalized to the initial area (A0). All quantitative data are shown as the mean±s.d.; *P<0.05; NS, not significant.
Fig. 6.
Fig. 6.
Rock and SRF are activated downstream of cadherin-11 and are necessary for high-density-induced myogenic differentiation. HF-MSCs were seeded at 3×10³ (low density, LD) or 30×103 cells/cm2 (high density, HD). (A) Lysates were immunoprecipitated with antibody against cadherin-11. Immunoprecipitates (IP) and corresponding lysates were probed by western blotting (IB). (B) Western blot for pMYPT-1 in cells cultured at low or high density. (C) Immunostaining for pMYPT-1 (pink). Scale bar: 50 µm. (D) Western blot for pMYPT-1 in siCDH11 or control HF-MSCs (upper panel) was quantified to show relative protein levels (lower panel). (E) Immunostaining of siCDH11 or control cells for pMYPT-1 (pink). Scale bar: 50 µm. (F) siCDH11 cells were treated with TGF-β1 (10 ng/ml) and pMYPT-1 was detected by western blotting 3 days later. (G–I) HF-MSCs were seeded at 20×103 cells/cm2, and on day 3 they were treated with Y27 (20 µM) for 1 day. (G) Immunostaining for β-catenin (green). Arrows indicate adherens junctions. Scale bar: 50 µm. In C, E and G, nuclei were counterstained with DAPI (blue). (H) Western blots for pMYPT1, ROCK1 and ROCK2 in Y27-treated and untreated cells. (I) Western blots for cadherin-2, cadherin-11, αSMA, CNN1 and MYH11 (left panel) were quantified to show relative protein levels (right panel). (J) Western blots for the indicated proteins in siROCK cells (upper panel) were quantified to show relative protein levels (lower panel). (K) The level of ROCK1 and ROCK2 in control and siCDH11 cells (lower panel) was determined from western blots (upper panel). (L) HF-MSCs were seeded at 20×103 cells/cm2 and, on day 3, they were treated with Y27 (20 µM) for 1 day. Western blots for SRF in Y27-treated and non-treated cells, siCDH11 or siCDH2 cells (upper panel) were quantified to show relative protein levels (lower panel). All quantitative data in D and I–L show the mean±s.d.; *P<0.05; NS, not significant. (M) SRF was knocked down using shLVDP. Western blots for the indicated proteins in control and siSRF cells are shown. (N) Schematic illustrating the proposed mechanism of cadherin-11-mediated myogenic differentiation.
Fig. 7.
Fig. 7.
Cadherin-11 regulates SMC protein expression and the contractility of SMC-containing organs in vivo. Bladders (A–C) or aortas (D–F) were obtained from 10-week-old Cdh11−/− or wild-type (WT) male mice. (A) Immunostaining for cadherin-11 (red, left panels), αSMA (green, middle panels) and MYH11 (green, right panels) in bladder tissue from Cdh11−/− and wild-type mice. Nuclei were counterstained with DAPI (blue). Scale bars: 500 µm. (B) Quantification of the fluorescence intensity of αSMA and MYH11 per area of tissue. (C) Contractile force generated in response to the indicated agonists in Cdh11−/− and wild-type bladders. (D–F) The data are as described for A–C for mouse aortas instead of bladders. Scale bars: 100 µm. All quantitative data show the mean±s.d.; *P<0.05 between the Cdh11−/− and wild-type tissues.

References

    1. Alimperti S., Lei P., Tian J., Andreadis S. T. (2012). A novel lentivirus for quantitative assessment of gene knockdown in stem cell differentiation. Gene Ther. 19, 1123–1132 10.1038/gt.2011.208 - DOI - PubMed
    1. Bajpai V. K., Mistriotis P., Loh Y. H., Daley G. Q., Andreadis S. T. (2012). Functional vascular smooth muscle cells derived from human induced pluripotent stem cells via mesenchymal stem cell intermediates. Cardiovasc. Res. 96, 391–400 10.1093/cvr/cvs253 - DOI - PMC - PubMed
    1. Bohnenpoll T., Bettenhausen E., Weiss A. C., Foik A. B., Trowe M. O., Blank P., Airik R., Kispert A. (2013). Tbx18 expression demarcates multipotent precursor populations in the developing urogenital system but is exclusively required within the ureteric mesenchymal lineage to suppress a renal stromal fate. Dev. Biol. 380, 25–36 10.1016/j.ydbio.2013.04.036 - DOI - PubMed
    1. Buxboim A., Discher D. E. (2010). Stem cells feel the difference. Nat. Methods 7, 695–697 10.1038/nmeth0910--695 - DOI - PMC - PubMed
    1. Castellani L., Salvati E., Alemà S., Falcone G. (2006). Fine regulation of RhoA and Rock is required for skeletal muscle differentiation. J. Biol. Chem. 281, 15249–15257 10.1074/jbc.M601390200 - DOI - PubMed

Publication types

MeSH terms