Optimization of a Model Corrected Blood Input Function from Dynamic FDG-PET Images of Small Animal Heart In Vivo
- PMID: 24741130
- PMCID: PMC3985393
- DOI: 10.1109/TNS.2013.2269032
Optimization of a Model Corrected Blood Input Function from Dynamic FDG-PET Images of Small Animal Heart In Vivo
Abstract
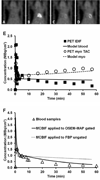
Quantitative evaluation of dynamic Positron Emission Tomography (PET) of mouse heart in vivo is challenging due to the small size of the heart and limited intrinsic spatial resolution of the PET scanner. Here, we optimized a compartment model which can simultaneously correct for spill over and partial volume effects for both blood pool and the myocardium, compute kinetic rate parameters and generate model corrected blood input function (MCBIF) from ordered subset expectation maximization - maximum a posteriori (OSEM-MAP) cardiac and respiratory gated 18F-FDG PET images of mouse heart with attenuation correction in vivo, without any invasive blood sampling. Arterial blood samples were collected from a single mouse to indicate the feasibility of the proposed method. In order to establish statistical significance, venous blood samples from n=6 mice were obtained at 2 late time points, when SP contamination from the tissue to the blood is maximum. We observed that correct bounds and initial guesses for the PV and SP coefficients accurately model the wash-in and wash-out dynamics of the tracer from mouse blood. The residual plot indicated an average difference of about 1.7% between the blood samples and MCBIF. The downstream rate of myocardial FDG influx constant, Ki (0.15±0.03 min-1), compared well with Ki obtained from arterial blood samples (P=0.716). In conclusion, the proposed methodology is not only quantitative but also reproducible.
Keywords: Blood Input Function; Cardiac and Respiratory Gating; FDG-PET; OSEM-MAP; Small Animals; Tracer Kinetic Modeling.
Figures


References
-
- Laforest R, Longford D, Siegel S, et al. Performance evaluation of the microPET (R) - FOCUS-F120. IEEE Trans Nucl Sci. 2007;54:42–49.
-
- Tai YC, Chatziioannou AF, Yang Y, et al. MicroPET II: design, development and initial performance of an improved microPET scanner for small-animal imaging. Phys Med Biol. 2003;48:1519–1537. - PubMed
-
- Laforest R, Sharp TL, Engelbach JA, et al. Measurement of input functions in rodents: challenges and solutions. Nucl Med Biol. 2005;32:679–685. - PubMed
-
- Wu HM, Sui G, Lee CC, Prins ML, Ladno W, et al. In vivo quantitation of glucose metabolism in mice using small-animal PET and a microfluidic device. J Nucl Med. 2007 May;48(5):837–845. - PubMed
Grants and funding
LinkOut - more resources
Full Text Sources
Other Literature Sources
Miscellaneous
