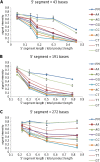
Influence of the length of target DNA overhang proximal to the array surface on discrimination of single-base mismatches on a 25-mer oligonucleotide array
- PMID: 24742004
- PMCID: PMC3997201
- DOI: 10.1186/1756-0500-7-251
Influence of the length of target DNA overhang proximal to the array surface on discrimination of single-base mismatches on a 25-mer oligonucleotide array
Abstract
Background: The performance of probes on an oligonucleotide microarray can be characterised in terms of hybridisation signal strength and the ability to discriminate sequence mismatches between the probe and the hybridising target strand, such as those resulting from SNPs. Various properties of the probe affect mismatch discrimination, such as probe length and the position of mismatched bases, and the effects of these factors have been well characterised in a variety of array formats.
Results: A low-density microarray was developed to systematically investigate the effect of a probe's position within hybridised target PCR products on the tolerance and discrimination of single-nucleotide mismatches between the probe and target. In line with previous reports, hybridisation signals were attenuated by different degrees depending on the identity of the mismatch, the position of the mismatch within the probe, and the length of the PCR product. However, the same mismatch caused different degrees of attenuation depending on the position of the probe within the hybridising product, such that improved mismatch discrimination was observed for PCR products where a greater proportion of the total length was proximal to the array surface.
Conclusions: These results suggest that the degree of mismatch discrimination can be influenced by the choice of PCR primers, providing a means by which array performance could be fine-tuned in addition to manipulation of the properties of the probes themselves.
Figures


Similar articles
-
Hybridization of glass-tethered oligonucleotide probes to target strands preannealed with labeled auxiliary oligonucleotides.Mol Biotechnol. 1999 Feb;11(1):1-12. doi: 10.1007/BF02789172. Mol Biotechnol. 1999. PMID: 10367278
-
Strong position-dependent effects of sequence mismatches on signal ratios measured using long oligonucleotide microarrays.BMC Genomics. 2008 Jul 3;9:317. doi: 10.1186/1471-2164-9-317. BMC Genomics. 2008. PMID: 18598341 Free PMC article.
-
Mutation detection by stacking hybridization on genosensor arrays.Mol Biotechnol. 1999 Feb;11(1):13-25. doi: 10.1007/BF02789173. Mol Biotechnol. 1999. PMID: 10367279
-
Molecular beacon: a multitask probe.J Appl Microbiol. 2005;99(3):435-42. doi: 10.1111/j.1365-2672.2005.02663.x. J Appl Microbiol. 2005. PMID: 16108784 Review. No abstract available.
-
Single nucleotide polymorphism genotyping using locked nucleic acid (LNA).Expert Rev Mol Diagn. 2003 Jan;3(1):27-38. doi: 10.1586/14737159.3.1.27. Expert Rev Mol Diagn. 2003. PMID: 12528362 Review.
Cited by
-
Strain discrimination of Yersinia pestis using a SERS-based electrochemically driven melting curve analysis of variable number tandem repeat sequences.Chem Sci. 2015 Mar 1;6(3):1846-1852. doi: 10.1039/c4sc03084b. Epub 2015 Jan 7. Chem Sci. 2015. PMID: 29449917 Free PMC article.
-
Tube-Wise Diagnostic Microarray for the Multiplex Characterization of the Complex Plant Pathogen Ralstonia solanacearum.Front Plant Sci. 2017 May 24;8:821. doi: 10.3389/fpls.2017.00821. eCollection 2017. Front Plant Sci. 2017. PMID: 28596774 Free PMC article.
-
Direct Detection and Discrimination of Nucleotide Polymorphisms Using Anthraquinone Labeled DNA Probes.Front Chem. 2020 May 12;8:381. doi: 10.3389/fchem.2020.00381. eCollection 2020. Front Chem. 2020. PMID: 32478035 Free PMC article.
References
-
- Cannon GA, Carr MJ, Yandle Z, Schaffer K, Kidney R, Hosny G, Doyle A, Ryan J, Gunson R, Collins T, Carman WF, Connell J, Hall WW. A low density oligonucleotide microarray for the detection of viral and atypical bacterial respiratory pathogens. J Virol Methods. 2010;163:17–24. doi: 10.1016/j.jviromet.2009.07.005. - DOI - PMC - PubMed
-
- Schmoock G, Ehricht R, Melzer F, Rassbach A, Scholz HC, Neubauer H, Sachse K, Mota RA, Saqib M, Elschner M. DNA microarray-based detection and identification of Burkholderia mallei, Burkholderia pseudomallei and Burkholderia spp. Mol Cell Probes. 2009;23:178–187. doi: 10.1016/j.mcp.2009.04.001. - DOI - PubMed
Publication types
MeSH terms
Substances
LinkOut - more resources
Full Text Sources
Other Literature Sources
Miscellaneous

