. 2014 Apr 17:15:217.
doi: 10.1186/1471-2164-15-217.

Identification of a strawberry flavor gene candidate using an integrated genetic-genomic-analytical chemistry approach

Affiliations

Identification of a strawberry flavor gene candidate using an integrated genetic-genomic-analytical chemistry approach

Alan H Chambers et al. BMC Genomics. .

Abstract

Background: There is interest in improving the flavor of commercial strawberry (Fragaria × ananassa) varieties. Fruit flavor is shaped by combinations of sugars, acids and volatile compounds. Many efforts seek to use genomics-based strategies to identify genes controlling flavor, and then designing durable molecular markers to follow these genes in breeding populations. In this report, fruit from two cultivars, varying for presence-absence of volatile compounds, along with segregating progeny, were analyzed using GC/MS and RNAseq. Expression data were bulked in silico according to presence/absence of a given volatile compound, in this case γ-decalactone, a compound conferring a peach flavor note to fruits.

Results: Computationally sorting reads in segregating progeny based on γ-decalactone presence eliminated transcripts not directly relevant to the volatile, revealing transcripts possibly imparting quantitative contributions. One candidate encodes an omega-6 fatty acid desaturase, an enzyme known to participate in lactone production in fungi, noted here as FaFAD1. This candidate was induced by ripening, was detected in certain harvests, and correlated with γ-decalactone presence. The FaFAD1 gene is present in every genotype where γ-decalactone has been detected, and it was invariably missing in non-producers. A functional, PCR-based molecular marker was developed that cosegregates with the phenotype in F1 and BC1 populations, as well as in many other cultivars and wild Fragaria accessions.

Conclusions: Genetic, genomic and analytical chemistry techniques were combined to identify FaFAD1, a gene likely controlling a key flavor volatile in strawberry. The same data may now be re-sorted based on presence/absence of any other volatile to identify other flavor-affecting candidates, leading to rapid generation of gene-specific markers.


Figures

Figure 1
Figure 1
Representative genotypes showing γ-decalactone stability over a single growing season. 35 out of 130 ‘Elyana’ x ‘Mara des Bois’ progeny produced fruit suitable for volatile analysis over three consecutive harvests. All progeny could be clustered into five classes based on γ-decalactone production as shown by five uniquely shaped graphs below. ‘Mara des Bois’ represents the class of non-producers, with ‘Elyana’ representing those lines that peaked mid-season. Other patters included the inverse of ‘Elyana’ with a “valley” pattern, a strong “decrease” after the earliest harvest, and one progeny that showed an increase as the season progressed. Counts in each category are shown in the attached legend. Data are from two technical replicates from one example genotype per class. Error bars represent standard deviations.
Figure 2
Figure 2
γ-Decalactone production in a selection of progeny from the ‘Elyana’ x ‘Mara des Bois’ cross. Total volatiles were analyzed by GC/MS. A number of progeny produced more γ-decalactone than ‘Elyana’ during the harvest shown. A subset of the progeny, along with the ‘Mara des Bois’ parent, never produced γ-decalactone above background levels. Ripe fruit samples from some of these genotypes were split between volatile analysis and RNA-seq transcriptome analysis. Data are from two technical replicates. Error bars represent standard deviations.
Figure 3
Figure 3
Differential transcript accumulation in parental genotypes. A. Unique transcripts detected in each parent as well as those shared between lines. The number of transcripts detected >5 fold is shown for each parent. B. MapMan distribution of differentially expressed transcripts separated by GO terms. C. Transcript accumulation from genes associated with “lipid” annotation in ‘Elyana’ (E), ‘Mara des Bois’ (M) and segregating progeny. The minus sign (-) indicates the inability to detect γ-decalactone in those lines.
Figure 4
Figure 4
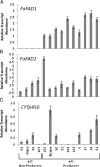
qRT-PCR results from three gene candidates correlated with the γ-decalactone phenotype. A single gene, FaFAD1 (gene24414), (A) encoding a putative ω-6-fatty acid desaturase was identified as differentially expressed between high and low γ–decalactone genotypes. Another putative fatty acid desaturase, FaFad2 (gene22642), was found in the F. vesca genome and is shown in (B). Reducing the stringency by reducing the number of progeny in each phenotypic pool resulted in another candidate (C)CYTp450 (gene29958), a putative cytochrome p450 monoxgenase, located in proximity to FaFAD1. qRT-PCR results are shown for each of these genes using ‘Elyana’ as the comparator against a subset of progeny. Data are from three technical replicates with error bars representing standard deviations.
Figure 5
Figure 5
qRT results for γ-decalactone gene candidates tested against an ‘Elyana’ developmental fruit series. Three stages of fruit were tested (green expanding, blushing, and full red, ripe). The γ-decalactone phenotype is only detectable in fully ripe fruit. Only comparisons between blushing and ripe developmental stages are shown. The FaFAD1 and CYTp450 genes show ~21-fold and ~11-fold (respectively) ripening induction in ‘Elyana’. Data are from three technical replicates with error bars representing standard deviations.
Figure 6
Figure 6
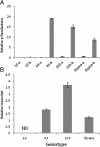
Presence of γ-decalactone in non-inductive and inductive environments, and their correlation with FaFAD1 transcript accumulation. Comparison of γ-decalcatone detected from environment ‘a’ (non-inductive) compared to environment ‘b’ (inductive) (A). Genotypes where FAD1 transcript is detected produce the volatile only in inductive environment ‘b’. Others tested (e.g. line 10) did not produce detectable γ-decalactone in either environment. (B) The relative FaFAD1 transcript accumulation for genotypes shown in (A).
Figure 7
Figure 7
FaFAD1 structure. The FaFAD1 gene, noted also as gene24414, is located in a region corresponding to linkage group 3 (LG3) in the F. vesca genome. Simple sequence repeat regions are noted by the large black arrows, and the small black arrows represent primers used to test for amplification within this region in parental lines and progeny. The letters A and B denote the primers used for marker amplification. The asterisk denotes a potential allele introducing a stop codon into the FaFAD1 sequence.
Figure 8
Figure 8
Co-segregation of the FaFAD1, PCR-based marker with the γ–decalactone phenotype. The FaFAD1-based PCR product is denoted by the single arrow and migrates at 500 bp by design. The dashed arrow denotes a positive PCR control (BFACT045) that is located in proximity of FaFAD1. Plus and minus signs represent the γ–decalactone phenotype for each genotype as determined by GC/MS. (A) The parental lines ‘Elyana’ x ‘Mara des Bois’ are shown with a subset of their progeny. (B) A series of wild octoploid materials representing one F. chiloensis and seven F. virginiana accessions (number = GRIN PI accession). (C) The correlation of the PCR product and γ–decalactone phenotype in cultivars unrelated to populations described in this work.
Figure 9
Figure 9
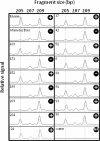
Cosegregation of the γ–decalactone phenotype and an SSR-based marker 11 kb upstream of FaFAD1. The parents and progeny were tested with primers corresponding to a microsatellite sequence located adjacent to the FaFAD1 gene. While all genotypes were monomorphic for a PCR product at 209 bp, the 205 bp product was only detected in the ‘Elyana’ parent and any genotype where γ–decalactone was detected, as designated by the “+”.

References

    1. Latrasse A. In: Volatile compounds in foods and beverages. Maarse H, editor. New York, NY: Marcel-Decker; 1991. Fruits; pp. 329–387.
    1. Olbricht K, Grafe C, Weiss K, Ulrich D. Inheritance of aroma compounds in a model population of Fragaria × ananassa Duch. Plant Breeding. 2008;15(1):87–93.
    1. Schieberle P, Hofmann T. Evaluation of the character impact odorants in fresh strawberry juice by quantitative measurements and sensory studies on model mixtures. J Agric Food Chem. 1997;15(1):227–232. doi: 10.1021/jf960366o. - DOI
    1. Carrasco B, Hancock J, Beaudry R, Retamales J. Chemical composition and inheritance patterns of aroma in Fragaria x ananassa and Fragaria virginiana progenies. Hort Sci. 2005;15(6):1649–1650.
    1. Bood KG, Zabetakis I. The biosynthesis of strawberry flavor (II): biosynthetic and molecular biology studies. J Food Sci. 2002;15(1):2–8. doi: 10.1111/j.1365-2621.2002.tb11349.x. - DOI

Publication types