

doi: 10.1021/nl5006349.
Epub 2014 Apr 21.
Scalable production of highly sensitive nanosensors based on graphene functionalized with a designed G protein-coupled receptor
Affiliations
- PMID: 24742304
- PMCID: PMC4025580
- DOI: 10.1021/nl5006349
Item in Clipboard
Scalable production of highly sensitive nanosensors based on graphene functionalized with a designed G protein-coupled receptor
Nano Lett.
.
Abstract
We have developed a novel, all-electronic biosensor for opioids that consists of an engineered μ-opioid receptor protein, with high binding affinity for opioids, chemically bonded to a graphene field-effect transistor to read out ligand binding. A variant of the receptor protein that provided chemical recognition was computationally redesigned to enhance its solubility and stability in an aqueous environment. A shadow mask process was developed to fabricate arrays of hundreds of graphene transistors with average mobility of ∼1500 cm(2) V(-1) s(-1) and yield exceeding 98%. The biosensor exhibits high sensitivity and selectivity for the target naltrexone, an opioid receptor antagonist, with a detection limit of 10 pg/mL.
Figures
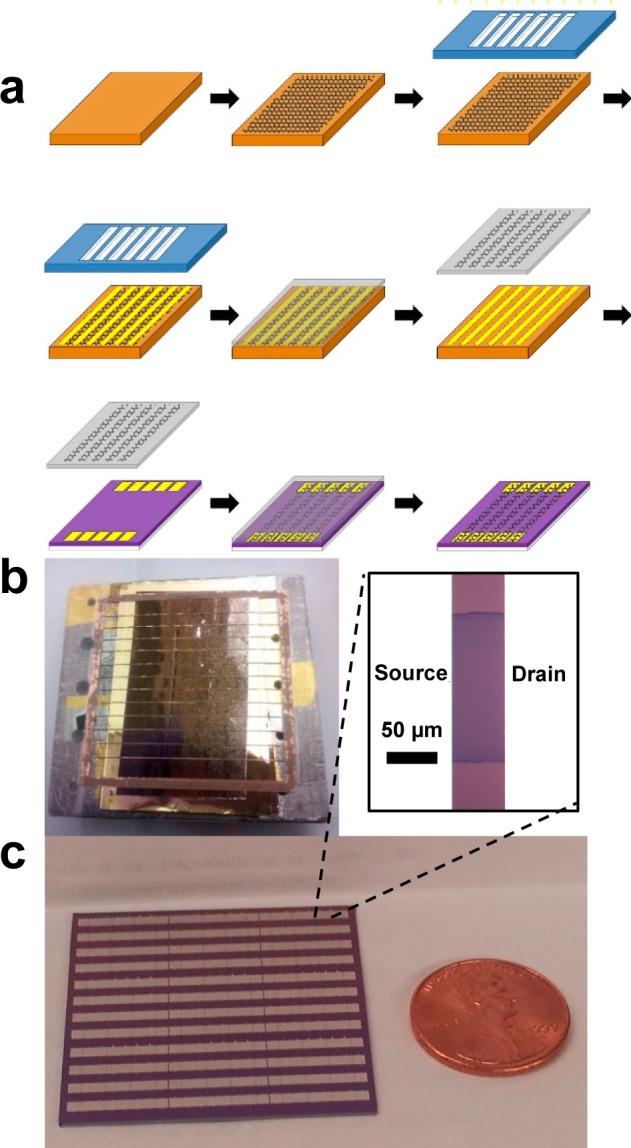
Fabrication process for high quality graphene field effect
transistors (GFETs). (a) Schematic of the fabrication process (see Methods and main text for description). (b) Copper
foil shadow mask placed in contact with graphene on catalytic copper
foil. Narrow regions of graphene protected by the mask are eventually
transferred onto source and drain contacts to form the transistor
channel. (c) Example of a GFET device made by transferring graphene
stripes onto prefabricated electrodes and photograph of an array of
192 GFET devices, with ∼99.5% device yield.
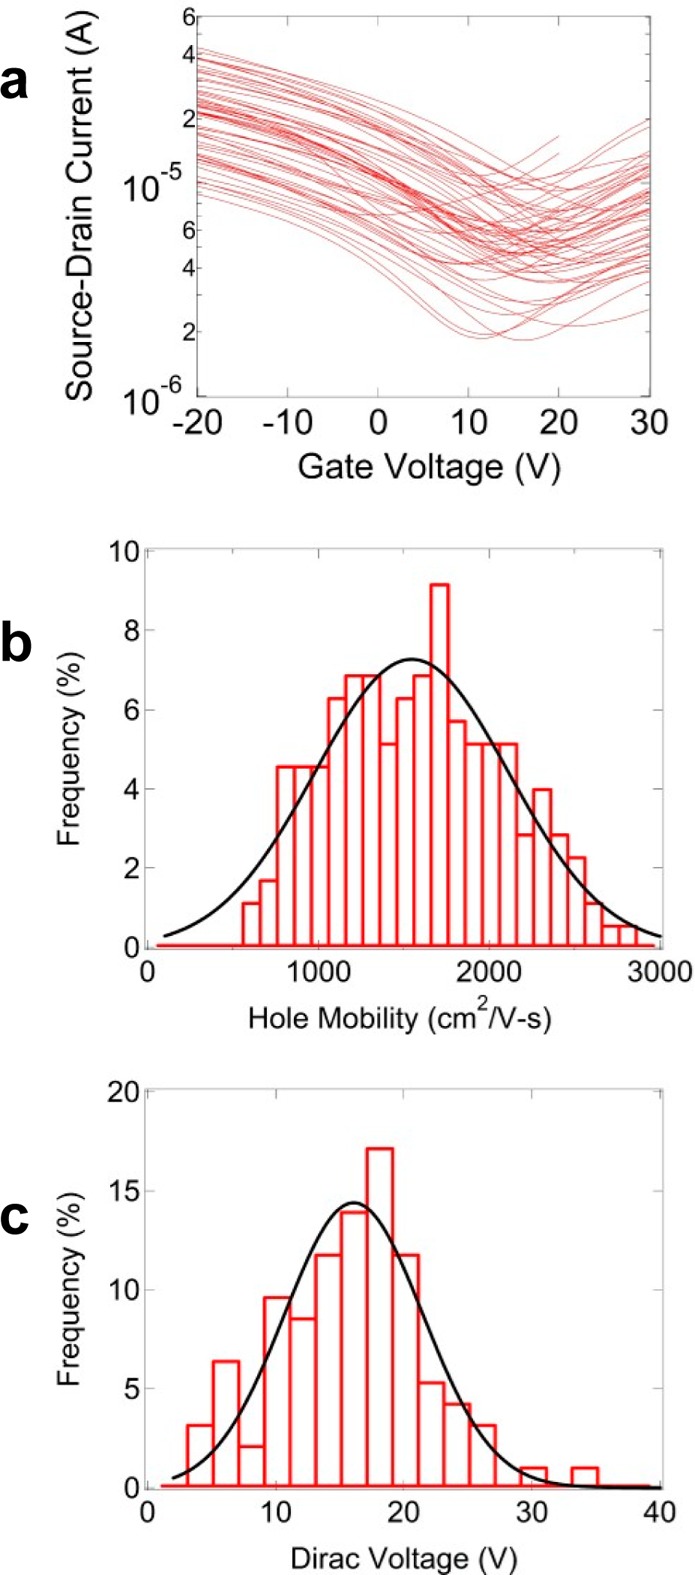
Performance characteristics of graphene field effect transistors
(GFETs). (a) Representative set of 50 I–Vg curves, demonstrating the uniformity of the
electrical characteristics. (b, c) Histograms of GFET mobility and
Dirac voltage along with Gaussian fits (black curves).

Results of characterization by Raman spectroscopy and atomic force
microscopy (AFM). (a) Raman spectrum of graphene before (red data)
and after (black data) exposure to diazonium salt solution. The strongly
enhanced D-band (near 1360 cm–1) after diazonium
treatment indicates the formation of carboxybenzene sites on the graphene
surface. (b) AFM image of soluble μ-receptor proteins (white
dots) decorating the graphene surface. The density of protein molecules
is approximately 10 times greater on the graphene as compared to the
SiO2 substrate. Scale bar is 2 μm. (c) Histogram
of the heights of proteins indicating that the 46 kDa μ-receptor
monomer is ∼4 nm tall on the surface, with dimers and trimers
of 8 and 12 nm, respectively.
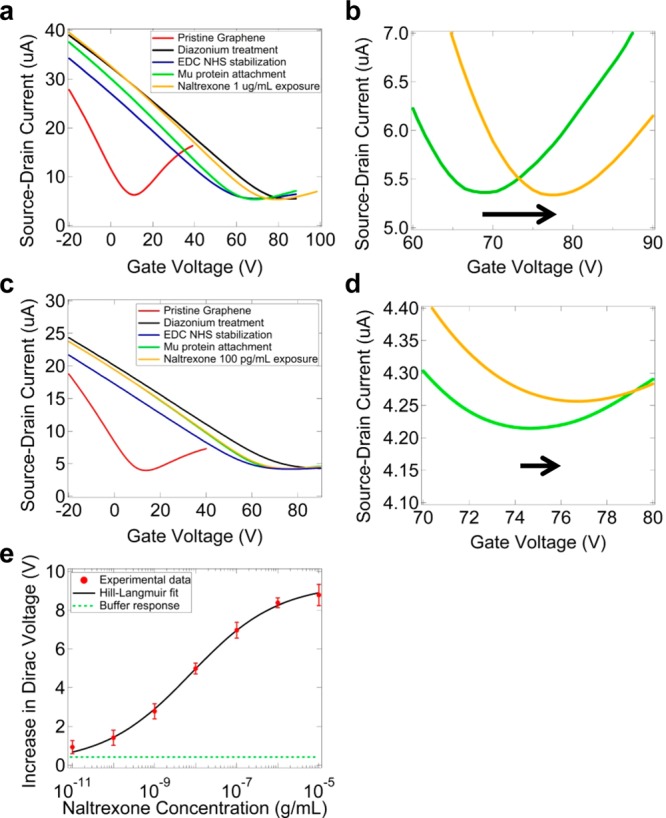
Current–gate voltage (I–VG) characteristic measurements
after chemical treatment and naltrexone exposure. (a) I–VG plots after successive functionalization
steps. After functionalization with the solubilized μ-receptor,
exposure to a solution of 1 μg/mL naltrexone in buffer leads
to an increase in the Dirac voltage of 8.5 V (green curve to orange
curve). (b) Magnified view of the Dirac voltage increase. (c) I–VG plots after successive
functionalization steps with the device now exposed to a solution
of 100 pg/mL naltrexone in buffer (green curve to orange curve). The
Dirac voltage increase is 1.8 V. (d) Magnified view of this shift
in the Dirac voltage. (e) Sensor response (increase in Dirac voltage)
as a function of naltrexone concentration. The signal is still discernible
from the bare buffer response at 10 pg/mL naltrexone. The data are
fit to a modified Hill–Langmuir equation (black curve; see
main text for details). The buffer response (green line) is defined
as the average response plus one standard error of 15 GFETs exposed
to pure buffer without protein.
Similar articles
-
Scalable Production of Molybdenum Disulfide Based Biosensors.ACS Nano. 2016 Jun 28;10(6):6173-9. doi: 10.1021/acsnano.6b02137. Epub 2016 Jun 15. ACS Nano. 2016. PMID: 27227361 Free PMC article.
-
All-Electronic Quantification of Neuropeptide-Receptor Interaction Using a Bias-Free Functionalized Graphene Microelectrode.ACS Nano. 2018 May 22;12(5):4218-4223. doi: 10.1021/acsnano.7b07474. Epub 2018 Apr 17. ACS Nano. 2018. PMID: 29634231 Free PMC article.
-
Scalable Arrays of Chemical Vapor Sensors Based on DNA-Decorated Graphene.Methods Mol Biol. 2019;2027:163-170. doi: 10.1007/978-1-4939-9616-2_13. Methods Mol Biol. 2019. PMID: 31309480
-
Printed organo-functionalized graphene for biosensing applications.Biosens Bioelectron. 2017 Jan 15;87:7-17. doi: 10.1016/j.bios.2016.07.116. Epub 2016 Aug 1. Biosens Bioelectron. 2017. PMID: 27504792 Review.
-
Interactions of DNA with graphene and sensing applications of graphene field-effect transistor devices: a review.Anal Chim Acta. 2015 Jan 1;853:127-142. doi: 10.1016/j.aca.2014.10.023. Epub 2014 Oct 18. Anal Chim Acta. 2015. PMID: 25467454 Review.
Cited by
-
Scalable graphene sensor array for real-time toxins monitoring in flowing water.Nat Commun. 2023 Jul 13;14(1):4184. doi: 10.1038/s41467-023-39701-0. Nat Commun. 2023. PMID: 37443127 Free PMC article.
-
Dielectrophoresis-Enhanced Graphene Field-Effect Transistors for Nano-Analyte Sensing.ACS Appl Mater Interfaces. 2025 Jun 4;17(22):32764-32772. doi: 10.1021/acsami.4c22829. Epub 2025 May 22. ACS Appl Mater Interfaces. 2025. PMID: 40401923 Free PMC article.
-
Scalable biomimetic sensing system with membrane receptor dual-monolayer probe and graphene transistor arrays.Sci Adv. 2023 Jul 21;9(29):eadf1402. doi: 10.1126/sciadv.adf1402. Epub 2023 Jul 21. Sci Adv. 2023. PMID: 37478177 Free PMC article.
-
Detection of an IL-6 Biomarker Using a GFET Platform Developed with a Facile Organic Solvent-Free Aptamer Immobilization Approach.Sensors (Basel). 2021 Feb 13;21(4):1335. doi: 10.3390/s21041335. Sensors (Basel). 2021. PMID: 33668579 Free PMC article.
-
Nanosensors for diagnosis with optical, electric and mechanical transducers.RSC Adv. 2019 Feb 27;9(12):6793-6803. doi: 10.1039/c8ra10144b. eCollection 2019 Feb 22. RSC Adv. 2019. PMID: 35518460 Free PMC article. Review.
References
-
- Chung C.; Kim Y.-K.; Shin D.; Ryoo S.-R.; Hong B. H.; Min D.-H. Biomedical Applications of Graphene and Graphene Oxide. Acc. Chem. Res. 2013, 46, 2211–2224. - PubMed
-
- Kuila T.; Bose S.; Khanra P.; Mishra A. K.; Kim N. H.; Lee J. H. Recent Advances in Graphene-Based Biosensors. Biosens. Bioelectron. 2011, 26, 4637–4648. - PubMed
-
- Lee Y.; Bae S.; Jang H.; Jang S.; Zhu S.-E.; Sim S. H.; Song Y. I.; Hong B. H.; Ahn J.-H. Wafer-Scale Synthesis and Transfer of Graphene Films. Nano Lett. 2010, 10, 490–493. - PubMed
-
- Levendorf M. P.; Ruiz-Vargas C. S.; Garg S.; Park J. Transfer-Free Batch Fabrication of Single Layer Graphene Transistors. Nano Lett. 2009, 9, 4479–4483. - PubMed
Publication types
MeSH terms
Substances
Grants and funding
LinkOut - more resources
Full Text Sources
Other Literature Sources
Research Materials
