. 2014 Apr 16;82(2):444-59.
doi: 10.1016/j.neuron.2014.03.021.

Structural and molecular remodeling of dendritic spine substructures during long-term potentiation

Affiliations

Structural and molecular remodeling of dendritic spine substructures during long-term potentiation

Miquel Bosch et al. Neuron. .

Abstract

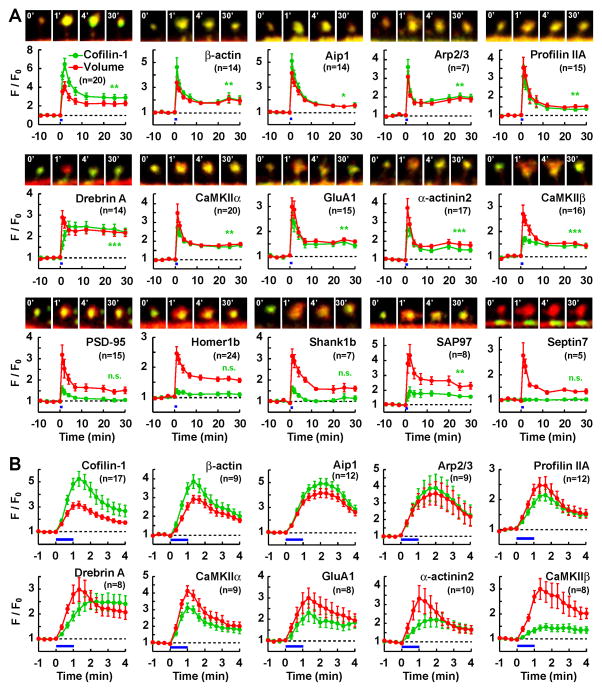
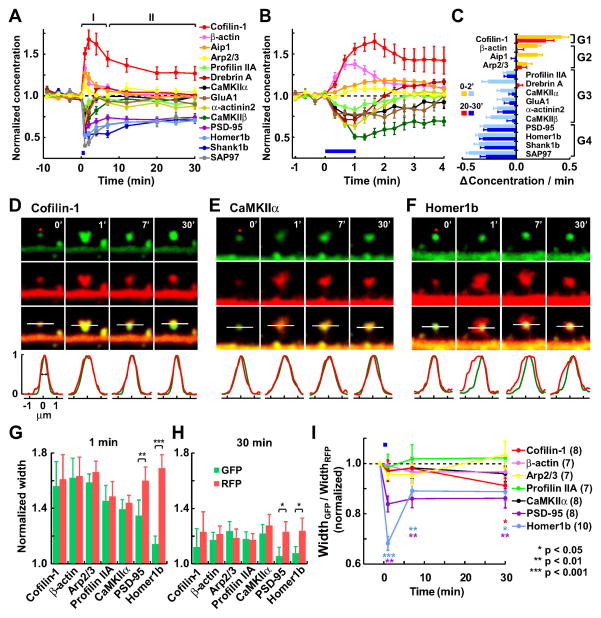
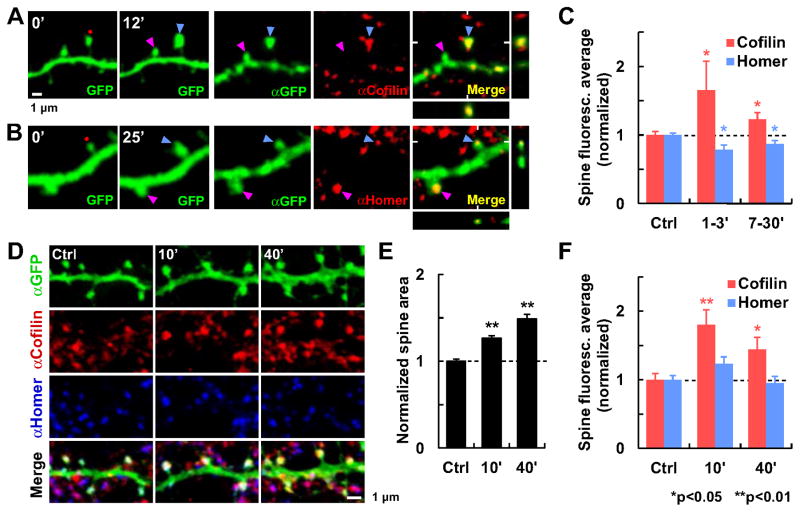
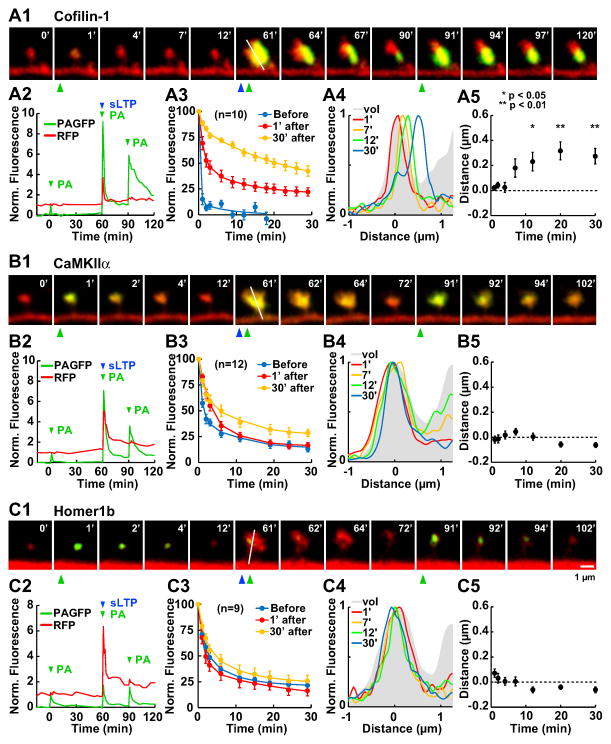
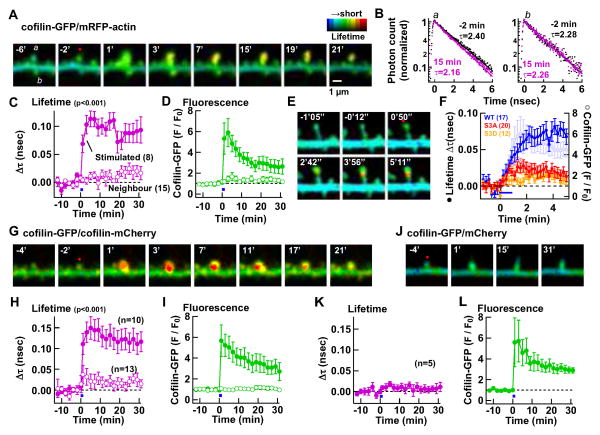
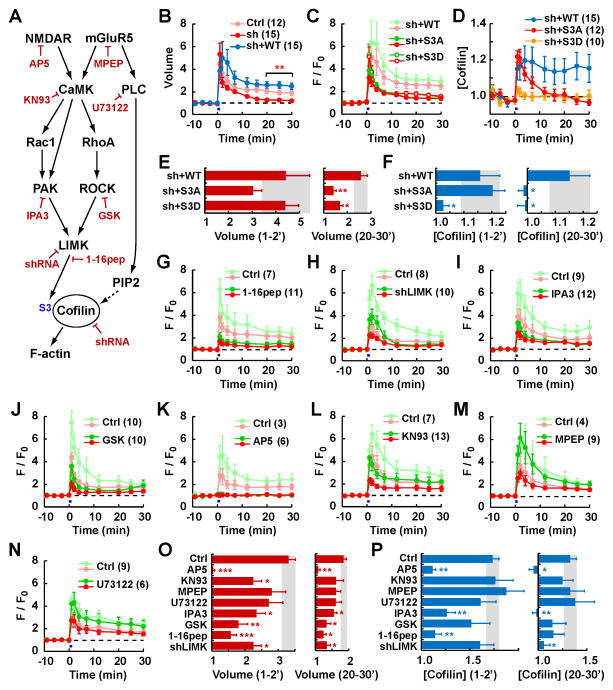
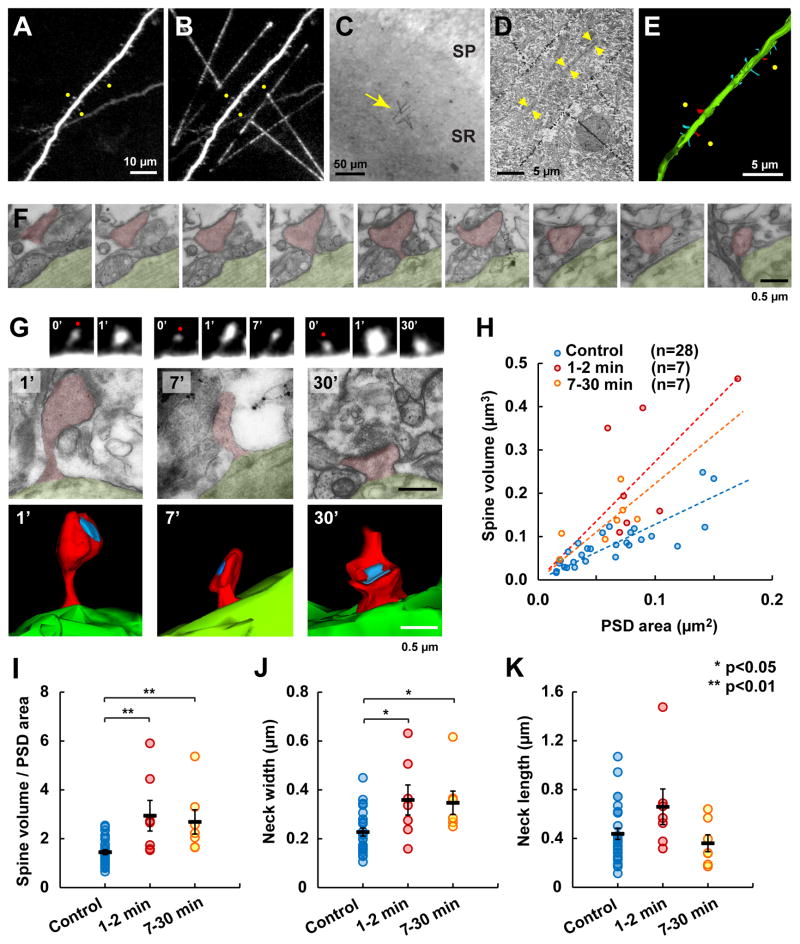
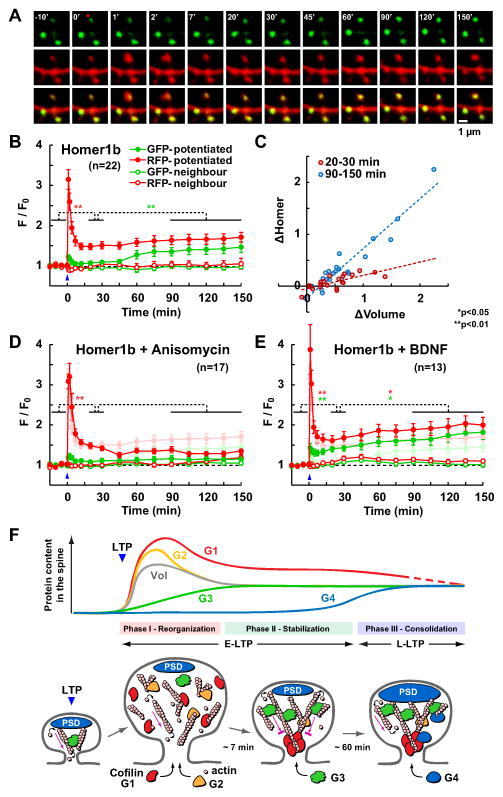
Synapses store information by long-lasting modifications of their structure and molecular composition, but the precise chronology of these changes has not been studied at single-synapse resolution in real time. Here we describe the spatiotemporal reorganization of postsynaptic substructures during long-term potentiation (LTP) at individual dendritic spines. Proteins translocated to the spine in four distinct patterns through three sequential phases. In the initial phase, the actin cytoskeleton was rapidly remodeled while active cofilin was massively transported to the spine. In the stabilization phase, cofilin formed a stable complex with F-actin, was persistently retained at the spine, and consolidated spine expansion. In contrast, the postsynaptic density (PSD) was independently remodeled, as PSD scaffolding proteins did not change their amount and localization until a late protein synthesis-dependent third phase. Our findings show how and when spine substructures are remodeled during LTP and explain why synaptic plasticity rules change over time.


Figures

Fig. 1
Fig. 1. Diverse temporal patterns of postsynaptic protein translocation to the dendritic spine during sLTP
GFP-tagged proteins were coexpressed with RFP in hippocampal CA1 pyramidal neurons. Single-spine sLTP was induced by 2P glutamate uncaging at 0–1 min (blue bars). Spine volume (RFP, red) and amount of GFP-protein in the spine (green) were quantified by measuring the total fluorescence intensity (F) relative to the averaged baseline fluorescence intensity (F0). (A) Spine volume and protein amount (mean ± SEM) were monitored for 30 min after sLTP induction. Merged images (3 μm wide; time stamp in min; green=GFP, red=RFP) of representative time-lapse experiments are shown. GluA1 was fused to SEP to detect the spine surface GluA1. Septin 7 was measured from the cluster in the dendritic shaft closest to the stimulated spine. * p < 0.05, ** p < 0.01, *** p < 0.001: significant differences in protein amount between the 20–30 min interval after sLTP induction and the 10 min baseline (n.s., not significant). Number of experiments in parenthesis. (B) Similar experiments as in A, at higher temporal resolution (20 sec interval) during the first 4 min after sLTP induction, for the 10 proteins that showed spine translocation. See Supplemental Experimental Procedures for statistical analyses. See also Fig. S1 and Table S1.
Fig. 2
Fig. 2. Changes in spine concentration and subspine distribution of postsynaptic proteins during sLTP
(A–B) Relative protein concentration in the spine calculated as the ratio between GFP (protein amount) and RFP (volume) fluorescence intensities (mean ± SEM), normalized to the baseline, during the 30 min (A) or 4 min (B) period after sLTP induction. Data obtained from Fig. 1. (C) Average change in protein concentration per minute during the first 2 min period (0–2′) and the last 10 min period (20–30′). Proteins are classified into 4 groups (G1–4) according to the direction (increase or decrease) and persistence (transient or persistent) of the change in concentration after sLTP induction (see text for detail). The transition from Phase I to Phase II (7 min) was set at the time point were all G2–G3 proteins were no longer significantly different with respect to the baseline in A (detailed statistics in Fig. S2J). (D–F) Spatial distribution of cofilin (D), CaMKIIα(E), and Homer1b (F) within the spine head during sLTP. Green and red fluorescence profiles from a line across the spine head (white line, parallel to the dendrite) were normalized to the peak value. Width was calculated as the full width at half-height from a Gaussian fitting curve. (G–H) Averaged green and red widths at 1 min (G) or 30 min (H) after sLTP induction, normalized to baseline levels. (I) Time course of changes in the relative distribution of the protein within the spine volume (ratio of green width and red width). * Significant difference compared with baseline, colored as the corresponding protein. Number of experiments in parenthesis. See also Fig. S2.
Fig. 3
Fig. 3. Redistribution of endogenous cofilin-1 and Homer1b during sLTP
Subcellular localization of endogenous cofilin-1 and Homer1b were detected by immunohistochemistry after two types of sLTP induction. (A–C) sLTP was induced in single spines by glutamate uncaging (red dot) in organotypic hippocampal slices. (A–B) Examples of stimulated (blue arrowhead) and unstimulated (pink arrowhead) spines monitored by time-lapse live 2P imaging of GFP up to 12 min (A) or 25 min (B)after sLTP induction. Slices were subsequently fixed and immunostained for GFP (αGFP) and (A) cofilin-1 (αCofilin) or (B)Homer1 (αHomer). XZ and YZ projections are also shown. (C) Quantification of the spine protein concentration measured as the average immunofluorescence (total intensity in the spine head divided by spine area; mean ± SEM) of potentiated spines at two time periods (1–3 min [cofilin, n=8; Homer, n=7] or 7–30 min after induction [cofilin, n=32; Homer, n=25]) normalized to unstimulated spines (Ctrl; cofilin, n=85; Homer, n=118) from the same optical section. (D–F) Chemical sLTP was induced by application of glycine to dissociated hippocampal cell cultures. (D) Examples of cultures fixed and immunostained for GFP, cofilin-1 and Homer1, before (Ctrl) or at different time points (10 or 40 min) after sLTP induction. (E) Quantification of the increase in spine area normalized to unstimulated spines (n=38 cells). (F) Quantification of the averaged immunofluorescence in the spine head in potentiated cultures at 10 min (n=23 cells) or 40 min (n=20) after stimulation, normalized to unstimulated cultures (Ctrl; n=22). * Significant difference with respect to Ctrl. See also Fig. S3.
Fig. 4
Fig. 4. Persistent changes in protein turnover after single spine sLTP induction
The effect of sLTP induction on protein turnover rate was visualized by measuring the fluorescence loss after photoactivation of PAGFP-tagged proteins in the same spine head, before, 1 min and 30 min after sLTP induction. (A1) Time-lapse images of a spine from a neuron expressing cofilin-PAGFP. Time of photoactivation (PA) is indicated by green arrowheads and glutamate uncaging (sLTP) by a blue arrowhead. (A2) Time course of green (normalized to the peak of the first PA) and red (normalized to the initial baseline) fluorescence intensities from the spine head in A1. (A3) Averaged fluorescence loss (mean ± SEM) from n (in parenthesis) experiments, normalized to the initial peak of each of the 3 PA time points. (A4) Fluorescence profiles of cofilin distribution (PAGFP) across a longitudinal axis in the spine head (white line in A1) at different time points after sLTP (normalized to the peak). Profiles are superimposed over the averaged RFP profiles at all time points (vol; grey). (A5) Average distance between the position of the green and red peaks, indicating how far the stable cofilin cluster is from the center of the spine volume. * Significant difference with respect to 1 min after sLTP. (B–C) Similar experiments to A, with PAGFP-CaMKIIα(B) and PAGFP-Homer1b (C).
Fig. 5
Fig. 5. Cofilin stably interacts with F-actin at a high stoichiometric ratio
(A–F) Interaction between cofilin and actin was monitored by FRET-FLIM between cofilin-GFP and mRFP-actin. (A) Representative time-lapse FLIM images. sLTP was induced in spine a (red dot) between 0–1 min. (B) Fluorescence lifetime (τ) of the stimulated spine a (left) and an unstimulated spine b (right) before (black) and 15 min after sLTP induction (pink). (C–D) Time course of averaged changes in lifetime (C) and amount of cofilin-GFP (D) in stimulated and neighboring spines (mean ± SEM). Number of spines in parenthesis. (E) Faster time course images where only one optical section was monitored. (F) Summary of data similar to E, showing time course of changes in lifetime (filled circles) and amount of cofilin-GFP (open circles) for WT-cofilin, S3A and S3D cofilin mutants. (G–I) A similar experiment to identify the proximity between cofilin molecules by detecting FRET-FLIM between cofilin-GFP and cofilin-mCherry. (J–L) A negative control experiment with cofilin-GFP and free mCherry. See also Fig. S4.
Fig. 6
Fig. 6. Role of cofilin in sLTP and mechanism of activity-dependent translocation and retention of cofilin into the spine
Pharmacological and genetic interventions to study the role that specific elements of the cofilin regulatory pathway play in sLTP and cofilin dynamics. (A) Schematic diagram of cofilin regulatory pathways showing the pharmacological and genetic tools used (in red). (B–F) shRNA-mediated knockdown of endogenous cofilin-1 and ADF (shCFL and shADF) and replacement by shRNA-resistant cofilin-GFP mutants. (B) Time course of spine volume (mean ± SEM) after sLTP in the presence of shRNAs (sh), empty shRNA vector (Ctrl) or rescue by WT-cofilin (sh+WT). Number of experiments in parenthesis.** p<0.01 with respect to Ctrl. (C) Time course of spine volume (red lines) and spine amount of cofilin-GFP mutants (green lines) in the presence of shRNAs. (D) Time course of spine concentration (GFP/RFP) of cofilin mutants in the presence of shRNAs. (E–F) Spine volume (E) and cofilin concentration (F) at the 1–2 min or 20–30 min interval after sLTP. * p<0.05, ** p<0.01 with respect to sh+WT. (G–N) Time course of spine volume (red lines) and spine amount of cofilin-GFP (green lines) under experimental (dark color) or control (faint color) conditions. (G) LIMK inhibitor 1–16 peptide (1–16pep). (H) shRNA-mediated knockdown of LIMK1 and LIMK2 (shLIMK). (I) PAK inhibitor IPA3. (J) ROCK inhibitor GSK429286 (GSK). (K) NMDAR inhibitor AP5 (L) CaMK inhibitor KN93. (M) mGluR5 inhibitor MPEP. (N) PLC inhibitor U73122. (O–P) Spine volume (O) and cofilin concentration (P) at the 1–2 min or 20–30 min interval after sLTP. * p<0.05, ** p<0.01, *** p<0.001 with respect to their respective controls. See also Fig. S5.
Fig. 7
Fig. 7. Correlated 2P and EM imaging shows that the PSD remains unaltered during the early phase of sLTP
(A–E) Photo-marking technique to relocalize in EM sections the same spines previously imaged and potentiated with the 2P microscope. (A) Three spines (yellow dots) were stimulated at different time points. (B) 2P laser-induced precipitation of DAB leaves landmarks flanking the dendrite or pointing to the potentiated spines. (C) Landmarks visualized in the hippocampal slice under bright field (arrow). SP: stratum pyramidale; SR: stratum radiatum. (D) Ultrathin EM section showing the same landmarks. Arrows point to the original dendrite. (E) Three dimensional reconstruction of the same dendrite from serial sections. Potentiated spines colored in red and naïve spines in blue. (F) An example of serial EM images at higher magnification. (G) Examples of spines potentiated at 1, 7 and 30 min before fixation. Fluorescence time-lapse images, EM images and three-dimensional reconstructions of the same spines are shown. Blue: PSD; red: spine; green: dendritic shaft. (H) Correlation between the spine volume and the PSD area in naïve control spines and spines at the 1–2 min or 7–30 min interval after sLTP induction. (I) Same data from H plotted as ratio between spine volume and PSD area. Black bars indicate mean ± SEM. (J–K) Width (J) and length (K) of the reconstructed spine neck.
Fig. 8
Fig. 8. Delayed synaptic delivery of Homer1b shares properties with L-LTP
Spines expressing Homer1b-GFP were imaged up to 150 min after the induction of sLTP. (A) Time-lapse images of a potentiated spine (red dot) and two unstimulated spines. (B) Time course of the amount of GFP-Homer1b in the spine head and the volume of the spine (RFP) after sLTP induction (mean ± SEM). (C) Correlation between changes in Homer1b amount versus changes in spine volume in the same set of spines at 20–30 min (red) and at 90–150 min (blue) after sLTP induction. (D–E) Similar experiments but in the presence of anisomycin (D) or BDNF (E). The no-drug data from B are shown in faint colors for comparison. (F) Proposed model for the reorganization of dendritic spine substructures during LTP (see Discussion) based on 4 patterns of protein dynamics (schematic evolution of the spine amount of G1–4 proteins; Vol: spine volume) and 3 temporal phases (IIII). Red arrow indicates actin treadmilling. See also Fig. S6.

Comment in

  • How to grow a synapse.
    Straub C, Sabatini BL. Straub C, et al. Neuron. 2014 Apr 16;82(2):256-7. doi: 10.1016/j.neuron.2014.03.033. Neuron. 2014. PMID: 24742454

References

    1. Andrianantoandro E, Pollard TD. Mechanism of actin filament turnover by severing and nucleation at different concentrations of ADF/cofilin. Mol Cell. 2006;24:13–23. - PubMed
    1. Bloodgood BL, Sabatini BL. Neuronal activity regulates diffusion across the neck of dendritic spines. Science. 2005;310:866–869. - PubMed
    1. Bosch M, Hayashi Y. Structural plasticity of dendritic spines. Curr Opin Neurobiol. 2012;22:383–388. - PMC - PubMed
    1. Chen LY, Rex CS, Casale MS, Gall CM, Lynch G. Changes in synaptic morphology accompany actin signaling during LTP. J Neurosci. 2007;27:5363–5372. - PMC - PubMed
    1. Cingolani LA, Goda Y. Actin in action: the interplay between the actin cytoskeleton and synaptic efficacy. Nat Rev Neurosci. 2008;9:344–356. - PubMed

Publication types

MeSH terms