. 2014 Apr 16;82(2):486-99.
doi: 10.1016/j.neuron.2014.02.029.

Emergent selectivity for task-relevant stimuli in higher-order auditory cortex

Affiliations

Emergent selectivity for task-relevant stimuli in higher-order auditory cortex

Serin Atiani et al. Neuron. .

Abstract

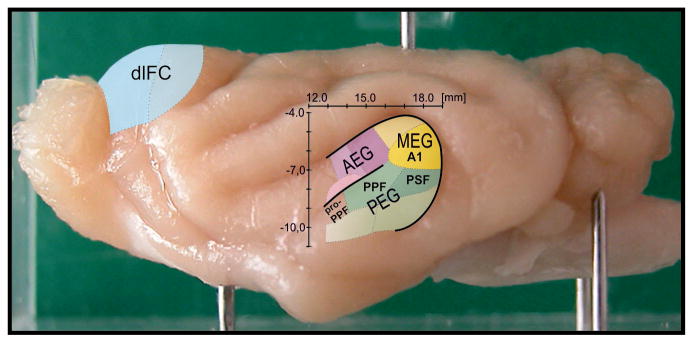
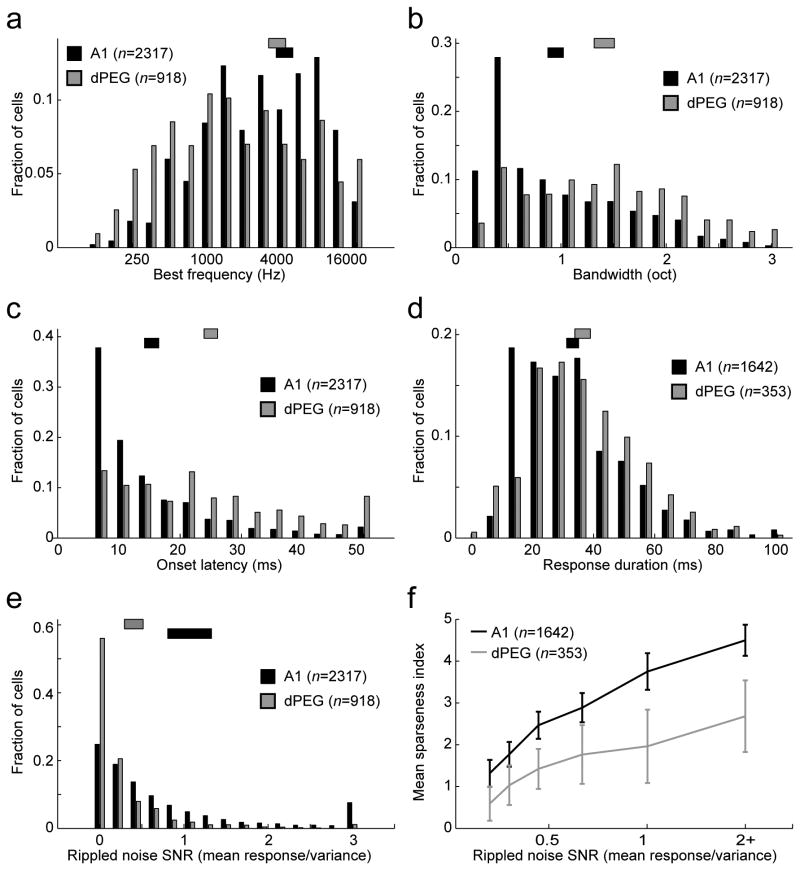
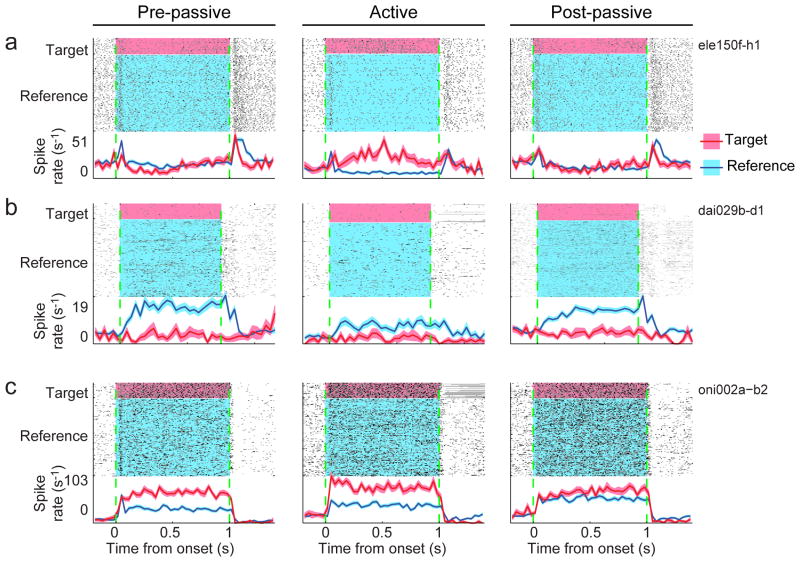
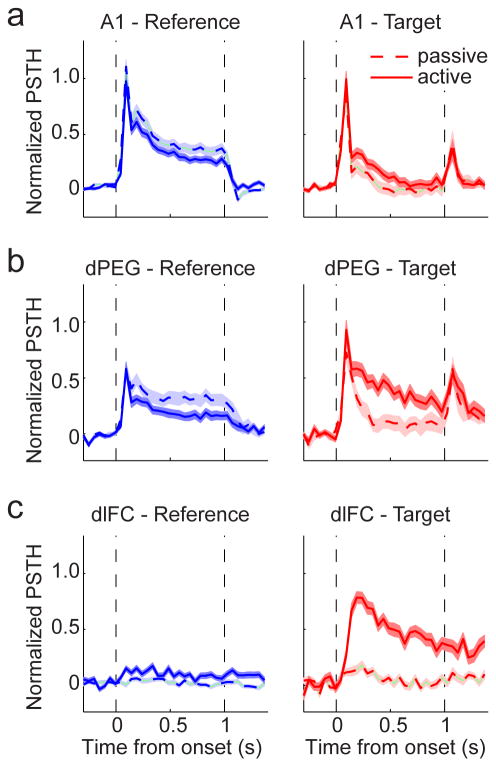
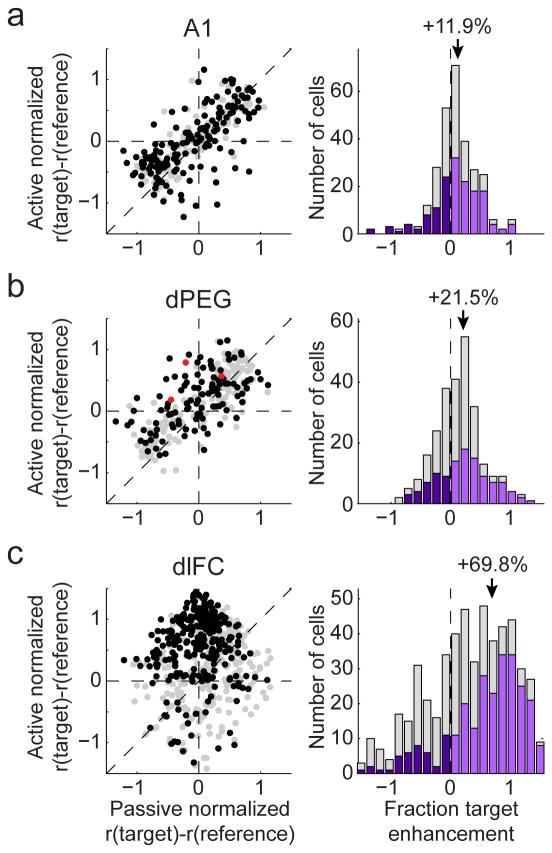
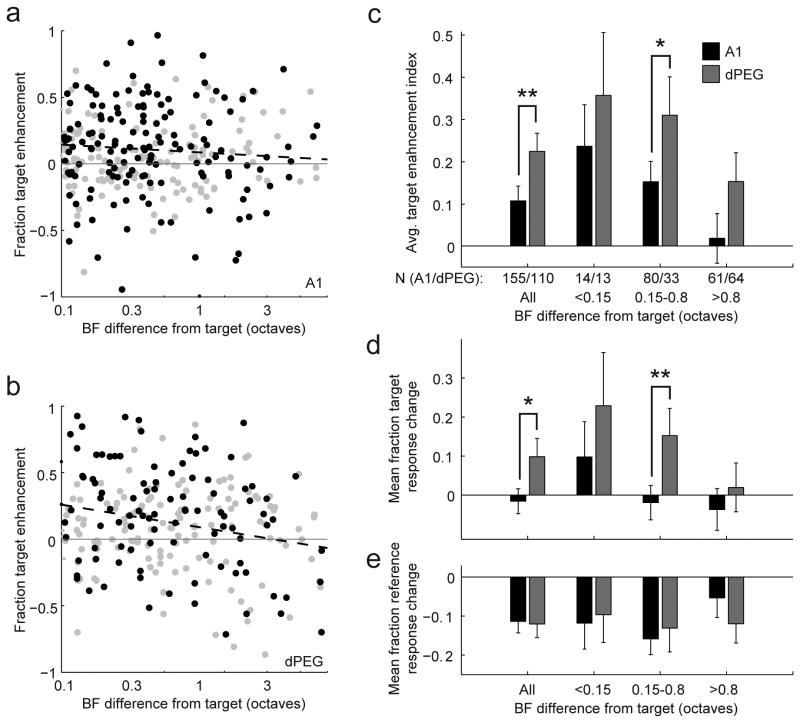
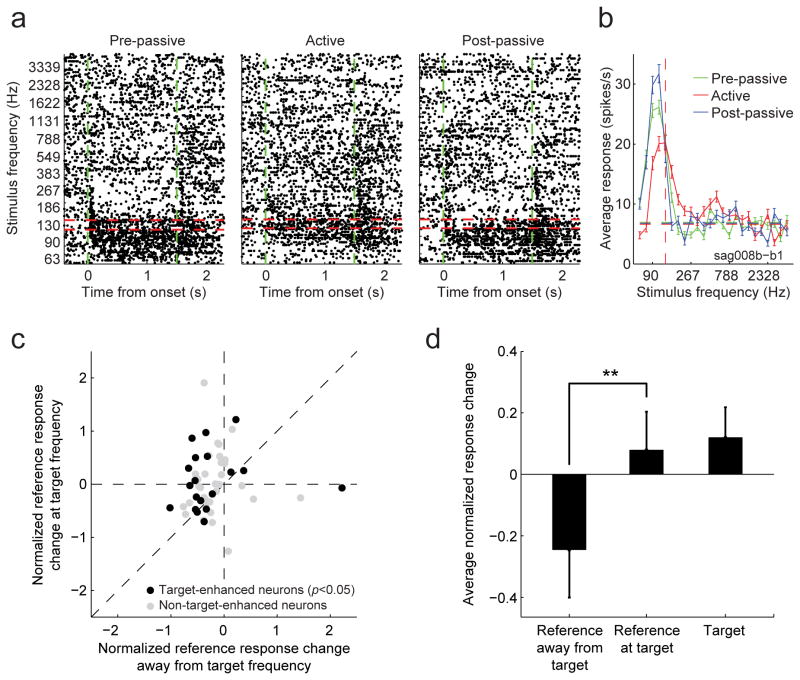
A variety of attention-related effects have been demonstrated in primary auditory cortex (A1). However, an understanding of the functional role of higher auditory cortical areas in guiding attention to acoustic stimuli has been elusive. We recorded from neurons in two tonotopic cortical belt areas in the dorsal posterior ectosylvian gyrus (dPEG) of ferrets trained on a simple auditory discrimination task. Neurons in dPEG showed similar basic auditory tuning properties to A1, but during behavior we observed marked differences between these areas. In the belt areas, changes in neuronal firing rate and response dynamics greatly enhanced responses to target stimuli relative to distractors, allowing for greater attentional selection during active listening. Consistent with existing anatomical evidence, the pattern of sensory tuning and behavioral modulation in auditory belt cortex links the spectrotemporal representation of the whole acoustic scene in A1 to a more abstracted representation of task-relevant stimuli observed in frontal cortex.


Figures

Figure 1
Figure 1
Ferret auditory and dorsolateral frontal cortex. Lateral view of the whole ferret (atlas) brain indicating location of dorsolateral frontal cortex (dlFC) and auditory cortex (AC) on the anterior, middle and posterior ectosylvian gyri (AEG, MEG and PEG). A1 is situated in posterior MEG, PPF and PSF are located in the dorsal PEG (dPEG), and pro-PPF neighbors PPF rostrally. Scales indicate stereotaxic rostrocaudal and dorsoventral position of AC in the brain. The whole ferret AC extends over ∼6 mm rostrocaudally and ∼7 mm dorsoventrally.
Figure 2
Figure 2
Comparison of basic auditory tuning properties in A1 and dPEG (pooled PPF and PSF). Each histogram plots the fraction of neurons with tuning at the value specified on the horizontal axis in A1 (black) and dPEG (gray). Bars at the top in corresponding shades indicate one standard error around the mean for each area. For subplots a-c and e, all neurons with measurable auditory evoked responses were included (A1: n=2317/2532, dPEG: n=918/1130, p<0.05, jackknifed t-test). For subplots d and f, only neurons with significant phase-locking to TORCs, as measured in e, were included (A1: n=1466, dPEG n=280, SNR>0.3) (a) Best frequency. Mean A1: 4330 Hz, dPEG: 3773 Hz, p>0.1, jackknifed t-test. (b) Frequency tuning bandwidth. Mean A1: 0.95 oct, dPEG: 1.41 oct, p<0.01. (c) Onset latency. Mean A1: 15 ms, dPEG: 25 ms, p<0.0001. (d) Response duration. Mean A1: 33 ms, dPEG: 36 ms, p>0.01. (e) Signal-to-noise ratio (SNR) measured as trial-to-trial phase-locking to broadband TORC stimuli. Mean A1: 1.07, dPEG: 0.40, p<0.01. (f) STRF sparseness index, reflecting the ratio of peak magnitude to average magnitude of the STRF. Low SNR can also decrease sparseness index values; thus mean sparseness values binned by SNR, as measured in e. Error bars indicate one standard error on the mean, measured by jackknifing. Mean A1: 2.98, dPEG: 1.41, p<0.0001.
Figure 3
Figure 3
Raster plot comparing target (red) and reference responses (blue) for three PEG neurons, before (left column, “pre-passive”), during (middle, “active”) and after behavior (right, “post-passive”). Dashed green lines indicate sound onset and offset. Curves below the rasters show the PSTH response averaged across all target or reference sounds and using 50 ms bins (shading indicates one standard error on the mean computed by jackknifing). Gray horizontal shading in rasters indicate incorrect trials where the artifact from the punishment period was removed. (a) In this example, the neuron gave a transient response to the target tone and a sustained response to the reference noise during passive listening. During behavior, the target response became sustained and increased in overall spike rate relative to the spontaneous baseline (77%) while the reference response decreased and became slightly suppressed after the initial transient (-15%). This resulted in an overall enhancement in the target response relative to the reference response. (b) This neuron produced a positive sustained response to reference sounds but was slightly suppressed by targets during passive listening. During behavior, the target response increased slightly, but the reference response decreased substantially across the entire period of stimulation by about 40%. (c) For a third neuron, reference and target sounds produced a strong response during passive listening. During behavior, the target response increased (18%) while the reference response was slightly suppressed (-3%).
Figure 4
Figure 4
(a) Average behavior-dependent change in reference and target responses in A1. Left panel plots pre-passive (dashed) versus active (solid) normalized PSTH response to reference noise across all neurons that underwent a significant change in evoked response during behavior (n=155 neurons significantly modulated during behavior). The average reference response decreases slightly in these neurons. Right panel compares the average PSTH response to target tones for the same set of A1 neurons. The average target response does not change significantly during behavior. (b) Target and reference PSTH comparison for dPEG, plotted as in a (n=110). In addition to a slightly larger decrease in reference response during behavior in dPEG (right panel) than observed in A1, the average target response also increases in dPEG. (c) Target and reference PSTH comparison for dlFC (n=266). Here both the sign and magnitude of responses has been normalized so that suppression of activity by target or reference, which occurs in about 40% of cells, is plotted as a positive modulation. In dlFC, neurons show consistently very little response during passive listening and respond only to the target during behavior.
Figure 5
Figure 5
(a) Average behavior-dependent change in reference and target responses in A1. Left panel compares the average target preference (i.e., target minus reference response) for each A1 neuron during passive listening (horizontal axis) and during behavior (vertical axis). Units that underwent significant changes in response during behavior are plotted in black (n=155/283, p<0.05, jackknifed t-test). Overlap of black and gray points reflects the fact that significance was tested by a z-score (i.e., change in mean firing rate normalized by the standard error on the mean) so that small absolute changes in firing rate can be significant if response variability is small. Right panel shows a histogram of the change in the relative target preference between passive and active conditions (i.e., distance from the diagonal in the left panel). Units with significant increases/decreases are plotted in light/dark purple. The average change in target preference during behavior in A1 was 11.9%, significantly greater than expected by chance (p<0.001, jackknifed t-test). (b) Task-dependent target versus reference changes in dPEG, plotted as in a (n=110/260 significantly modulated neurons). Together these changes lead to an overall average change in target preference of 21.5% during behavior (p<0.001, jackknifed t-test). (c) Task-dependent target versus reference changes in dlFC (n=266/530 significantly modulated neurons). Neurons in this areas undergo a much larger change, averaging a +69.8% change in target preference, reflecting the strong target-selective response that appears only during behavior (p<0.001, jackknifed t-test).
Figure 6
Figure 6
Influence of similarity between target frequency (TF) and neuronal best frequency (BF) on behavior effects. (a) Change in target preference for each A1 unit during behavior (vertical axis), plotted as a function of difference between the TF and the BF. Units that underwent significant changes in response during behavior are plotted in black (n=155/283). Smaller differences between TF and BF showed a weak trend toward greater increases in target preference (r=-0.08, p>0.05, jackknifed t-test). (b) Scatter plot of changes in dPEG, plotted as in a (n=110/260 significantly modulated neurons, r=-0.23, p<0.05, jackknifed t-test). (c) Average target enhancement index in A1 and dPEG for all neurons and after grouping according to the difference between BF and task target frequency. Error bars indicate one standard error on the mean, computed by jackknifing. In both areas, target enhancement was slightly larger for neurons with BF very similar to TF (<0.15 octave difference). Target enhancement was significantly stronger for neurons with BF-TF difference >0.15 octaves in dPEG (p<0.05) compared to A1. (d) Average fraction change in target responses for A1 and dPEG neurons, plotted as in c. Increases in target responses were greater in dPEG for the group of neurons with BF within 0.15-0.8 octaves of TF (p<0.01), suggesting that a larger pool of neurons participates in the target enhancement compared to A1. (e) Average fraction change in reference responses for A1 and dPEG neurons. Reference responses tended to decrease regardless of the BF-TF difference in both areas.
Figure 7
Figure 7
(a) An example neuron showing frequency tuning for pre-passive, active behavior, and post-passive states. In this example, reference stimuli were quarter-octave bandpass noise, centered at the frequencies shown on the y-axis. During behavior, responses were suppressed overall to the reference noise, but the suppression was weaker for noise centered at the target tone frequency. (b) Tuning curves, measured from the average firing rate response from each stimulus onset to offset, show a shift in the peak of the tuning curve toward the target frequency during behavior (red line). (c) Average reference response change between behavior and passive listening for each neuron at target frequency (vertical axis) versus average response change away from the target frequency (horizontal axis) shows a significant relative enhancement at the target frequency (p<0.02, jackknifed t-test). Black dots are cells (n=19/55) that show significant target versus reference enhancement (p<0.05, jackknifed t-test). (d) Average reference and target responses during passive listening and behavior for the 19 significant cells in c.

References

    1. Ahissar M, Nahum M, Nelken I, Hochstein S. Reverse hierarchies and sensory learning. Philos Trans R Soc Lond B Biol Sci. 2009;364:285–299. - PMC - PubMed
    1. Atiani S, Elhilali M, David SV, Fritz JB, Shamma SA. Task difficulty and performance induce diverse adaptive patterns in gain and shape of primary auditory cortical receptive fields. Neuron. 2009;61:467–480. - PMC - PubMed
    1. Bendor D, Wang X. Neural response properties of primary, rostral, and rostrotemporal core fields in the auditory cortex of marmoset monkeys. J Neurophysiol. 2008;100:888–906. - PMC - PubMed
    1. Bizley JK, Nodal FR, Nelken I, King AJ. Functional organization of ferret auditory cortex. Cereb Cortex. 2005;15:1637–1653. - PubMed
    1. Bizley JK, Nodal FR, Bajo VM, Nelken I, King AJ. Physiological and anatomical evidence for multisensory interactions in auditory cortex. Cereb Cortex. 2007;17:2172–2189. - PMC - PubMed

Publication types