. 2014 May 30;289(22):15374-83.
doi: 10.1074/jbc.M113.541003. Epub 2014 Apr 17.

Mint proteins are required for synaptic activity-dependent amyloid precursor protein (APP) trafficking and amyloid β generation

Affiliations

Mint proteins are required for synaptic activity-dependent amyloid precursor protein (APP) trafficking and amyloid β generation

Sarah E Sullivan et al. J Biol Chem. .

Abstract

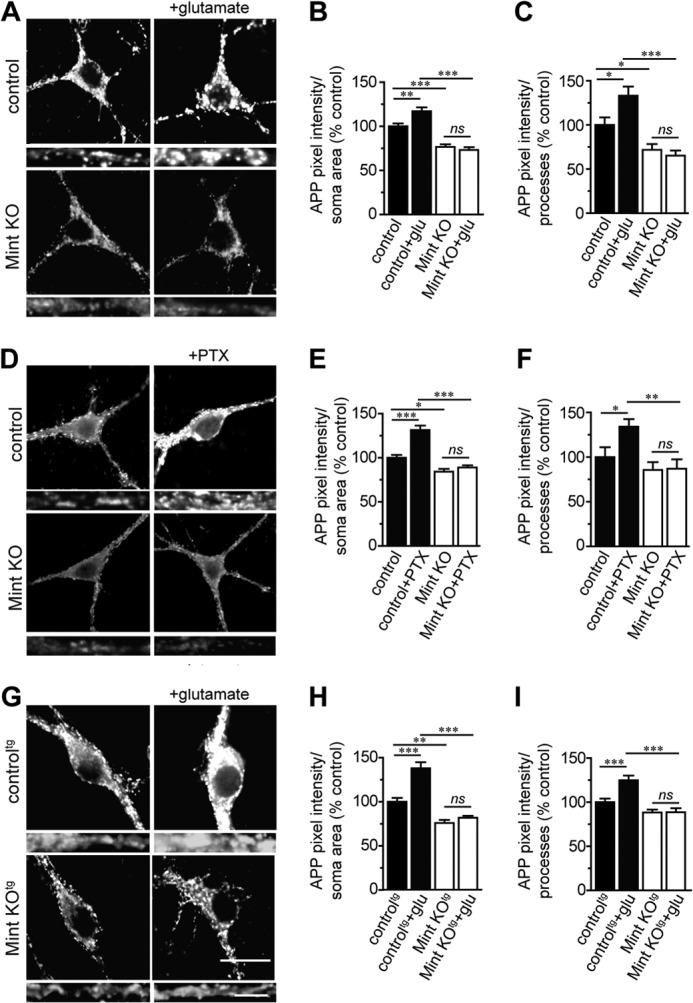
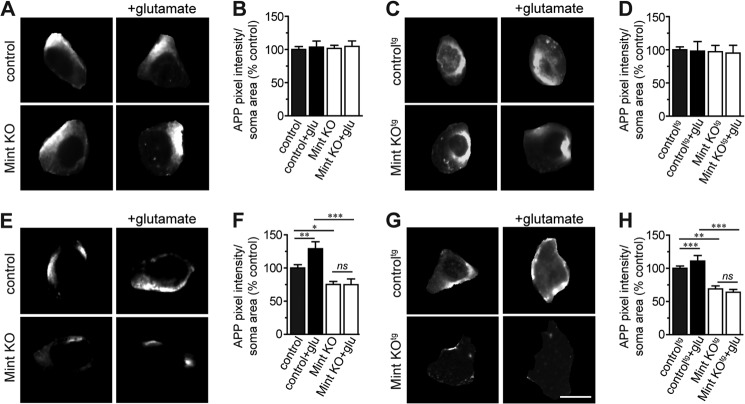
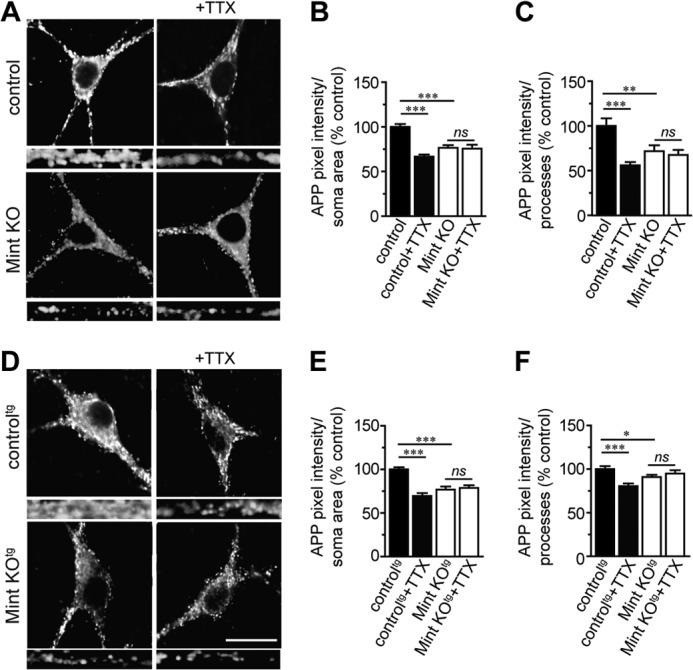
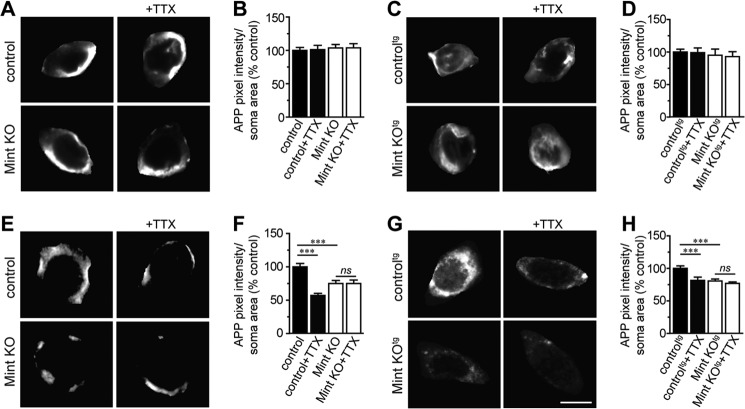
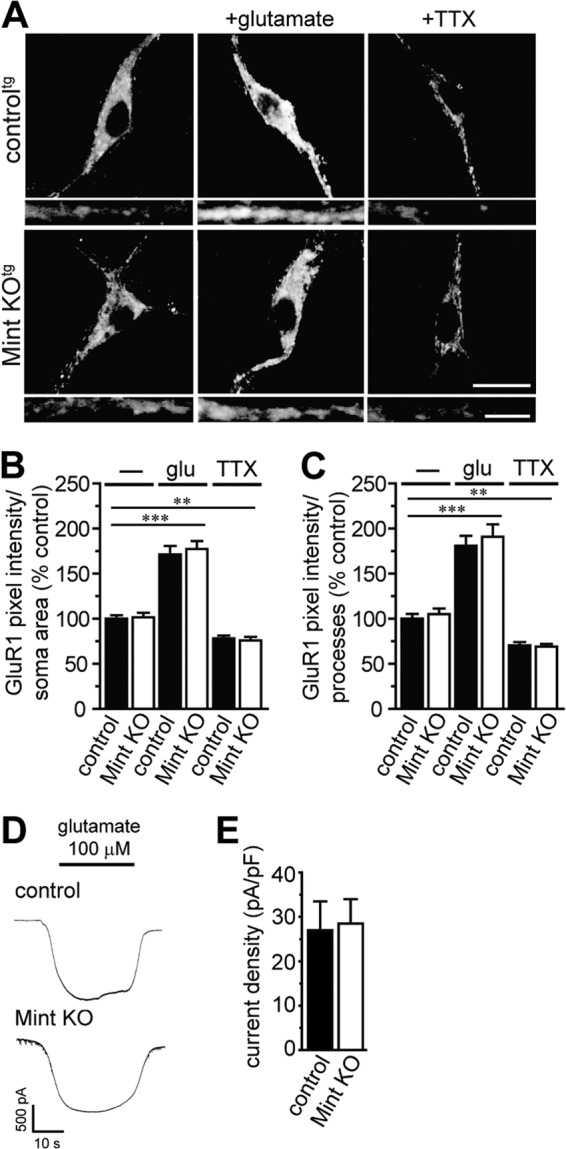
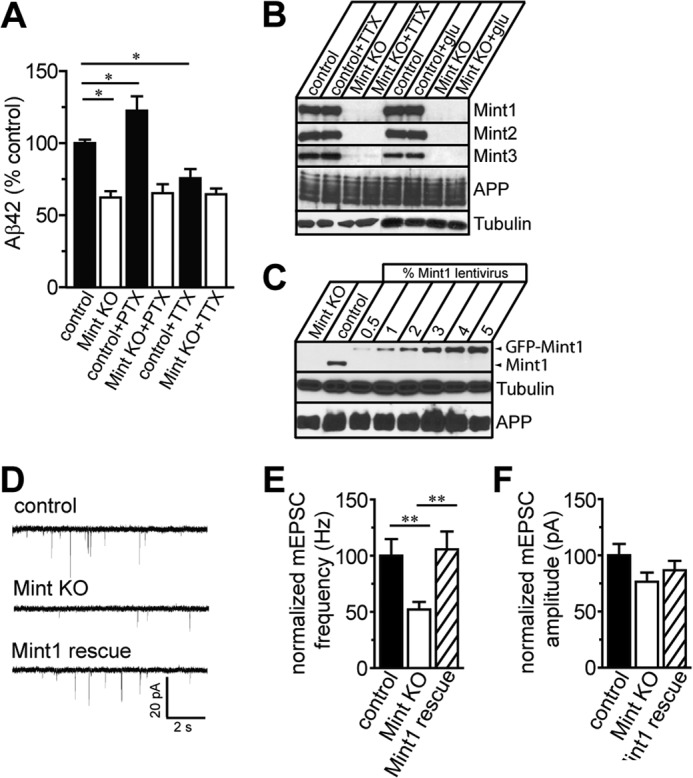
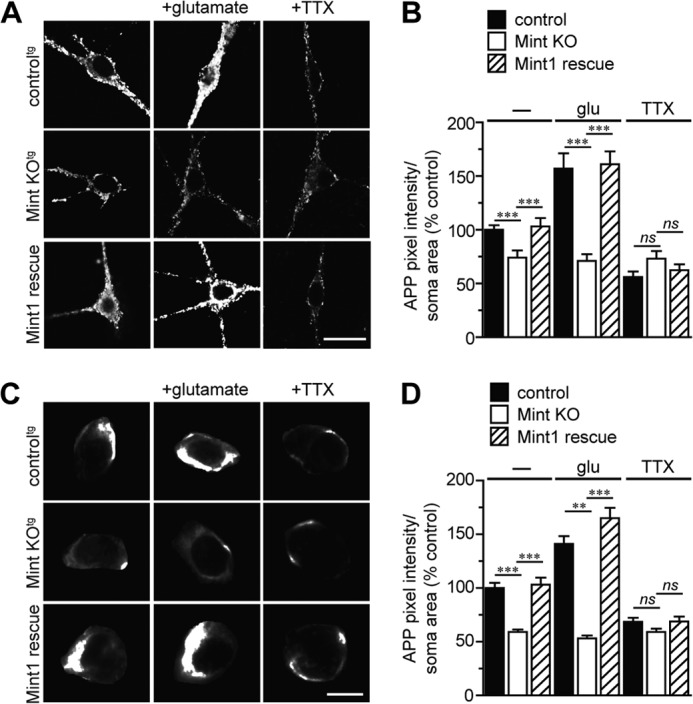
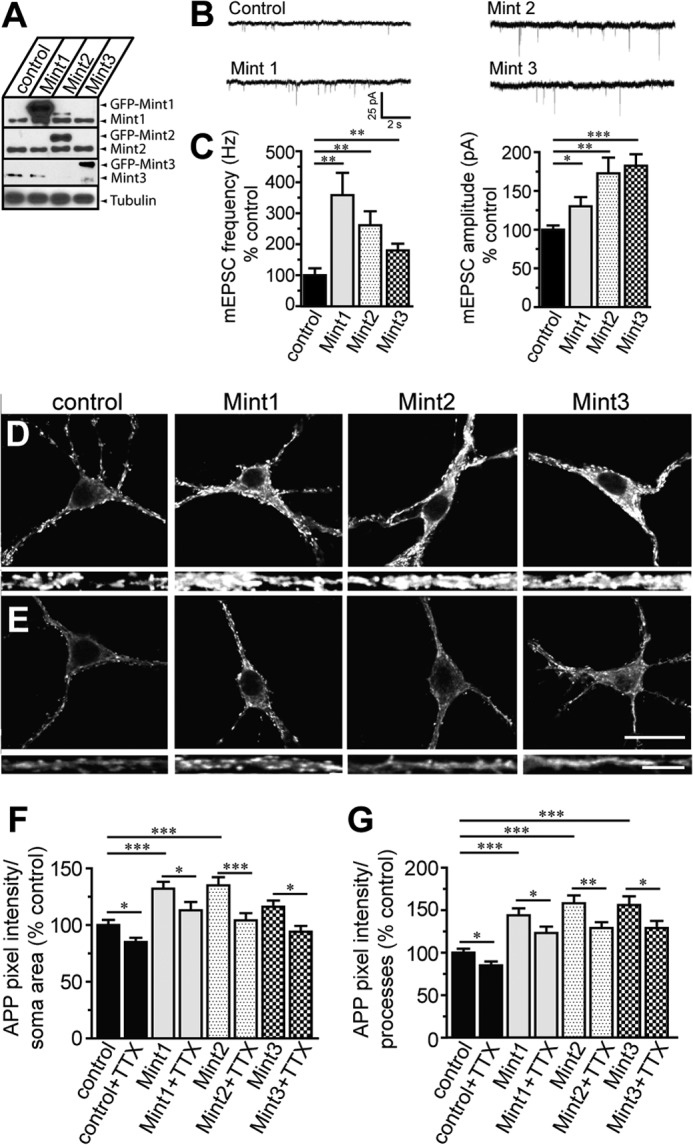
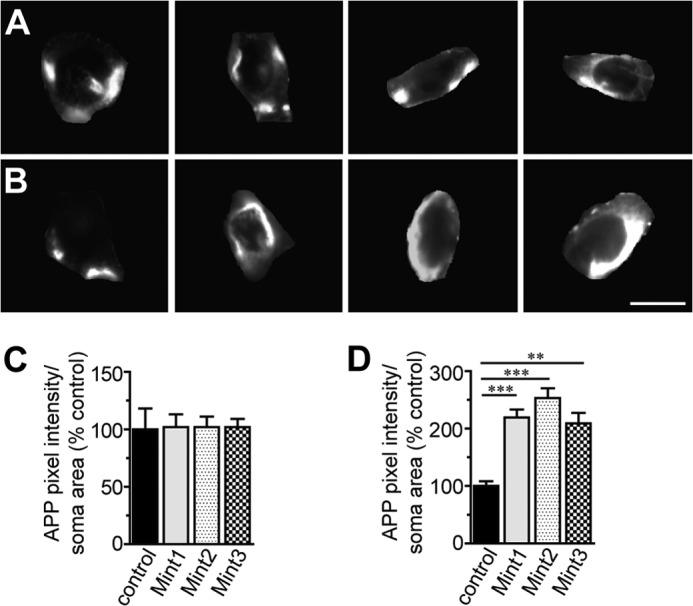
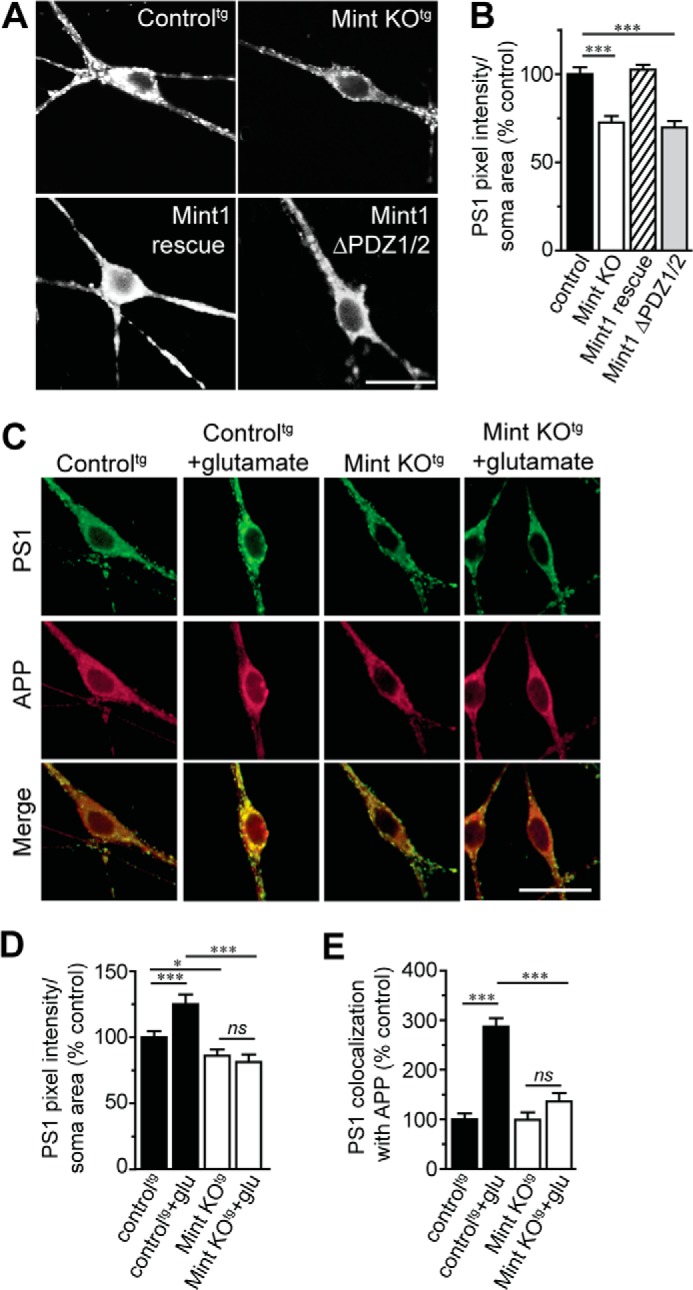
Aberrant amyloid β (Aβ) production plays a causal role in Alzheimer disease pathogenesis. A major cellular pathway for Aβ generation is the activity-dependent endocytosis and proteolytic cleavage of the amyloid precursor protein (APP). However, the molecules controlling activity-dependent APP trafficking in neurons are less defined. Mints are adaptor proteins that directly interact with the endocytic sorting motif of APP and are functionally important in regulating APP endocytosis and Aβ production. We analyzed neuronal cultures from control and Mint knockout neurons that were treated with either glutamate or tetrodotoxin to stimulate an increase or decrease in neuronal activity, respectively. We found that neuronal activation by glutamate increased APP endocytosis, followed by elevated APP insertion into the cell surface, stabilizing APP at the plasma membrane. Conversely, suppression of neuronal activity by tetrodotoxin decreased APP endocytosis and insertion. Interestingly, we found that activity-dependent APP trafficking and Aβ generation were blocked in Mint knockout neurons. We showed that wild-type Mint1 can rescue APP internalization and insertion in Mint knockout neurons. In addition, we found that Mint overexpression increased excitatory synaptic activity and that APP was internalized predominantly to endosomes associated with APP processing. We demonstrated that presenilin 1 (PS1) endocytosis requires interaction with the PDZ domains of Mint1 and that this interaction facilitates activity-dependent colocalization of APP and PS1. These findings demonstrate that Mints are necessary for activity-induced APP and PS1 trafficking and provide insight into the cellular fate of APP in endocytic pathways essential for Aβ production.

Keywords: Adaptor Protein; Alzheimer Disease; Amyloid; Amyloid Precursor Protein (APP); Mint/X11; Synaptic Activity; Trafficking.


Figures

FIGURE 1.
FIGURE 1.
Mint proteins regulate activity-dependent APP endocytosis. MTF and MTFtg neurons were infected with lentiviral inactive (control) or active cre recombinase to delete all Mint proteins (Mint KO). Live cell endocytosis assay of neurons were labeled with an extracellular N-terminal APP antibody (22C11) and treated with 25 μm glutamate (glu) for 5 min or 150 μm PTX for 1 h at 37 °C to depolarize neurons. Proteins were internalized for 15 min at 37 °C before stripping of excess surface antibody and fixation. A, representative images of MTF control and Mint KO neurons following glutamate treatment. Bottom panels, representative images of processes. B and C, internalized APP immunostaining was visualized by confocal microscopy and quantified as a measure of pixel intensity within defined somas or processes and expressed as percent control (n = 2/132 represents the number of independent experiments/total number of neurons assessed). D, representative images of MTF control and Mint KO neurons following PTX treatment. E and F, quantification of APP pixel intensity within defined somas or processes (n = 3/373). G, representative images of MTFtg control and Mint KO neurons following glutamate treatment. H and I, quantification of APP pixel intensity within defined somas or processes (n = 4/218). Scale bars = 20 μm (somas) and 5 μm (processes). *, p < 0.05; **, p < 0.01; ***, p < 0.001; ns, not significant.
FIGURE 2.
FIGURE 2.
Mints regulate activity-induced APP insertion at the plasma membrane. A–D, surface APP immunostaining following glutamate stimulation in control and Mint KO neurons. glu, glutamate. A and B, MTF control and Mint KO neurons and quantification of APP pixel intensity within defined somas (n = 2/65 represents the number of independent experiments/total number of neurons assessed). C and D, MTFtg control and Mint KO neurons and quantification of APP pixel intensity within defined somas (n = 3/74). E–H, live cell recycling assay following glutamate treatment in MTF and MTFtg neurons. After blocking existing cell surface APP with primary antibody (22C11) and cold (non-fluorescence-conjugated) secondary antibody, neurons were incubated at 37 °C for 15 min. Following fixation, newly inserted APPs were labeled with the same APP antibody, visualized using fluorescent-conjugated secondary antibody, and then APP pixel intensity was quantified within defined somas. E and F, MTF control and Mint KO neurons and quantification of APP pixel intensity within defined somas (n = 2/136). G and H, MTFtg control and Mint KO neurons and quantification of APP pixel intensity within defined somas (n = 2/120). Scale bars = 20 μm (somas) and 5 μm (processes). *, p < 0.05; **, p < 0.01; ***, p < 0.001; ns, not significant.
FIGURE 3.
FIGURE 3.
TTX failed to alter APP endocytosis in Mint knockout neurons. Neurons were treated with 2 μm TTX for 1 h to reduce synaptic activity prior to live cell immunostaining. A, representative images of MTF control and Mint KO neurons. Bottom panels, representative images of processes. B and C, internalized APP immunostaining was quantified as a measure of pixel intensity within defined somas or processes, respectively, and expressed as percent control (n = 2/118 represents the number of independent experiments/total number of neurons assessed). D, MTFtg control and Mint KO neurons. E and F, quantification of APP pixel intensity within defined somas or processes, respectively (n = 4/295). Scale bars = 20 μm (somas) and 5 μm (processes). *, p < 0.05; **, p < 0.01; ***, p < 0.001; ns, not significant.
FIGURE 4.
FIGURE 4.
APP insertion is decreased in TTX-treated neurons. A–D, surface APP immunostaining. A and B, MTF control and Mint KO neurons and quantification of APP pixel intensity within defined somas (n = 2/160 represents the number of independent experiments/total number of neurons assessed). C and D, MTFtg control and Mint KO neurons and quantification of APP pixel intensity within defined somas (n = 2/86). E–H, Live cell recycling assay. E and F, MTF control and Mint KO neurons and quantification of APP pixel intensity within defined somas (n = 2/52). G and H, MTFtg control and Mint KO neurons and quantification of APP pixel intensity within defined somas (n = 3/95). Scale bars = 20 μm (somas) and 5 μm (processes). *, p < 0.05; **, p < 0.01; ***, p < 0.001; ns, not significant.
FIGURE 5.
FIGURE 5.
Mints do not affect glutamate receptor trafficking and function. Shown is a live cell endocytosis assay of MTFtg neurons incubated with an extracellular N-terminal GluR1 antibody and subsequently treated with 25 μm glutamate (glu) for 5 min at 37 °C or with 2 μm TTX for 1 h prior to live cell immunostaining. A, representative images of MTFtg control and Mint KO neurons treated with glutamate and TTX. Bottom panels, representative images of processes. B and C, internalized GluR1 immunostaining was quantified as a measure of pixel intensity within defined somas or processes and expressed as percent control (n = 3/307 represents the number of independent experiments/total number of neurons assessed). D, whole-cell currents to exogenous glutamate application in MTFtg control and Mint KO neurons at a holding potential of −70 mV. E, no difference in current density was detected in glutamate-induced currents in control and Mint KO neurons. pA, picoamperes; pF, picofarad. Scale bars = 20 μm (somas) and 5 μm (processes). **, p < 0.01; ***, p < 0.001.
FIGURE 6.
FIGURE 6.
Mints are necessary for activity-dependent Aβ generation. A, Aβ42 ELISA measurement from conditioned medium of MTFtg control and Mint KO neurons following 1 h of PTX and TTX treatment at 37 °C. B, representative immunoblot analyses of lysates from MTFtg control and Mint KO neurons treated with TTX or glutamate (glu). Lysates probed for individual Mint proteins show efficient deletion of Mints 1–3 in Mint KO neurons. C, expression of Mint1 in MTFtg Mint KO neurons examined by immunoblotting of neurons treated with increasing percentages of GFP-Mint1 lentivirus. D–F, sample traces of mEPSC in MTF control, Mint KO, and Mint1 rescue neurons. The bar graphs indicate mEPSC frequency and mEPSC amplitude, respectively (n = 3/55 represents the number of independent experiments/total number of neurons assessed). *, p < 0.05; **, p < 0.01.
FIGURE 7.
FIGURE 7.
Mints are directly involved in activity-dependent APP trafficking. A and B, live cell endocytosis assay. MTFtg control, Mint KO, and Mint1 rescue neurons were treated with glutamate (glu) or TTX. Internalized APP immunostaining was quantified as a measure of pixel intensity within defined somas and expressed as percent control (n = 4/664). C and D, live cell recycling assay. Shown are representative images and quantification of APP pixel intensity within defined somas (n = 2/337). Scale bars = 20 μm. **, p < 0.01; ***, p < 0.001; ns, not significant.
FIGURE 8.
FIGURE 8.
Mint overexpression increases excitatory synaptic transmission and regulates APP endocytosis. A, representative immunoblot analyses of lysates from wild-type neurons infected with lentiviral GFP-Mint 1, 2, or 3. Lysates probed for individual Mint proteins show expression of endogenous and overexpressed Mint proteins. B, sample traces showing mEPSCs of neurons infected with individual Mint proteins in wild-type neurons. C, bar graphs of mEPSC frequency and amplitude, respectively (n = 3/77 represents the number of independent experiments/total number of neurons assessed). D, live cell endocytosis assay. Representative images of wild-type control and Mint1-, 2-, and 3-overexpressing neurons. Bottom panels, representative images of processes. E, wild-type control and Mint1-, 2-, and 3-overexpressing neurons treated with TTX for 1 h prior to live cell immunostaining. Bottom panel, representative images of processes. F and G, internalized APP immunostaining was quantified as a measure of pixel intensity within defined somas or processes and expressed as percent control (n = 2/343). Scale bars represent 20 μm for somas and 5 μm for processes. Scale bars = 20 μm (somas) and 5 μm (processes). *, p < 0.05; **, p < 0.01; ***, p < 0.001.
FIGURE 9.
FIGURE 9.
Mint-overexpressing neurons increases APP insertion. A and C, surface APP immunostaining. Shown are wild-type control and Mint1-, 2-, and 3-overexpressing neurons and quantification of APP pixel intensity within defined somas (n = 3/87 represents the number of independent experiments/total number of neurons assessed). B and D, live cell recycling assay. Shown are wild type control and Mint1-, 2-, and 3-overexpressing neurons and quantification of APP pixel intensity within defined somas (n = 2/102). Scale bars = 20 μm (somas) and 5 μm (processes). **, p < 0.01; ***, p < 0.001.
FIGURE 10.
FIGURE 10.
Mints are required for PS1 internalization and activity-dependent colocalization with APP. A and B, live cell endocytosis assay of MTFtg control, Mint KO, Mint 1 rescue, and Mint1 truncated PDZ1/2 (Mint1ΔPDZ1/2) mutant neurons labeled with an extracellular PS1 antibody. Internalized PS1 immunostaining was quantified as a measure of pixel intensity within defined somas and expressed as percent control (n = 2/199 represents the number of independent experiments/total number of neurons assessed). C, representative images of live cell PS1 endocytosis assay and immunostaining with APP following glutamate application. glu, glutamate. D, PS1 immunostaining was quantified as a measure of pixel intensity within defined somas and expressed as percent control (n = 2/87). E, colocalization of internalized PS1 with APP quantified within defined somas using Mander's coefficient (n = 2/168). Scale bars = 20 μm (somas). *, p < 0.05; ***, p < 0.001; ns, not significant.

References

    1. Kamenetz F., Tomita T., Hsieh H., Seabrook G., Borchelt D., Iwatsubo T., Sisodia S., Malinow R. (2003) APP processing and synaptic function. Neuron 37, 925–937 - PubMed
    1. Cirrito J. R., Deane R., Fagan A. M., Spinner M. L., Parsadanian M., Finn M. B., Jiang H., Prior J. L., Sagare A., Bales K. R., Paul S. M., Zlokovic B. V., Piwnica-Worms D., Holtzman D. M. (2005) P-glycoprotein deficiency at the blood-brain barrier increases amyloid-β deposition in an Alzheimer disease mouse model. J. Clin. Invest. 115, 3285–3290 - PMC - PubMed
    1. Cirrito J. R., Yamada K. A., Finn M. B., Sloviter R. S., Bales K. R., May P. C., Schoepp D. D., Paul S. M., Mennerick S., Holtzman D. M. (2005) Synaptic activity regulates interstitial fluid amyloid-β levels in vivo. Neuron 48, 913–922 - PubMed
    1. Groemer T. W., Thiel C. S., Holt M., Riedel D., Hua Y., Hüve J., Wilhelm B. G., Klingauf J. (2011) Amyloid precursor protein is trafficked and secreted via synaptic vesicles. PLoS ONE 6, e18754. - PMC - PubMed
    1. Haass C., Hung A. Y., Selkoe D. J., Teplow D. B. (1994) Mutations associated with a locus for familial Alzheimer's disease result in alternative processing of amyloid β-protein precursor. J. Biol. Chem. 269, 17741–17748 - PubMed

Publication types

MeSH terms

LinkOut - more resources