. 2014 Jun 1;306(11):G1002-10.
doi: 10.1152/ajpgi.00389.2013. Epub 2014 Apr 17.

Acute murine colitis reduces colonic 5-aminosalicylic acid metabolism by regulation of N-acetyltransferase-2

Affiliations

Acute murine colitis reduces colonic 5-aminosalicylic acid metabolism by regulation of N-acetyltransferase-2

Verónica Ramírez-Alcántara et al. Am J Physiol Gastrointest Liver Physiol. .

Abstract

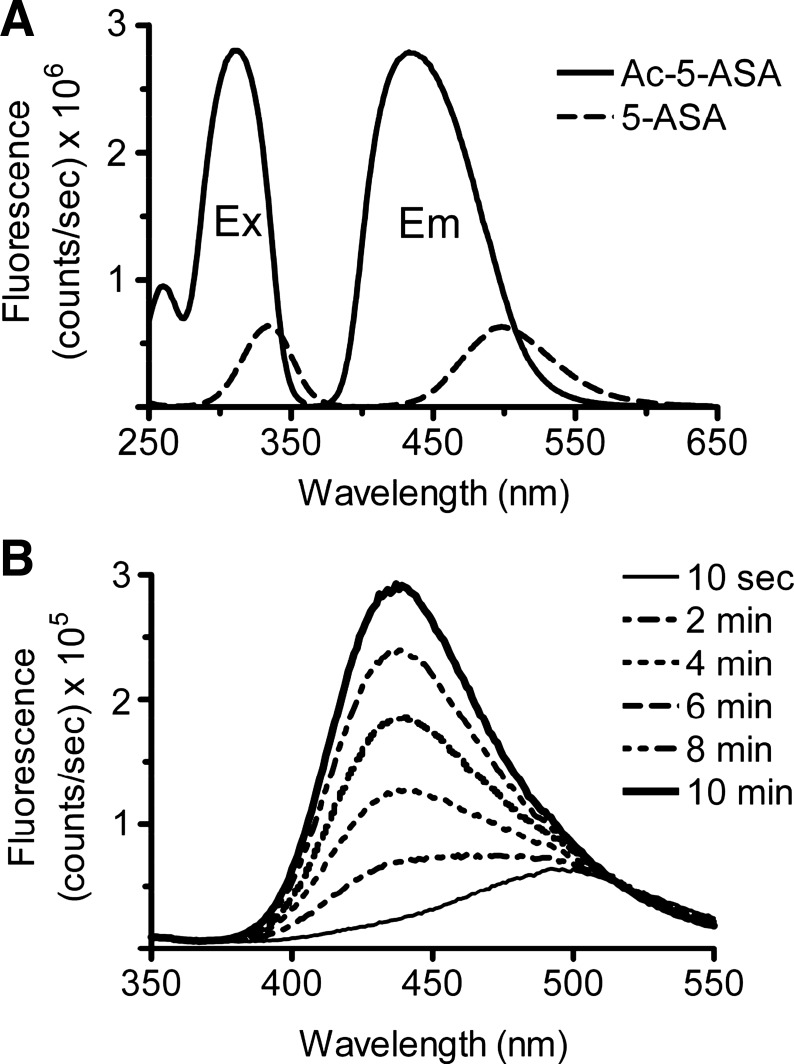
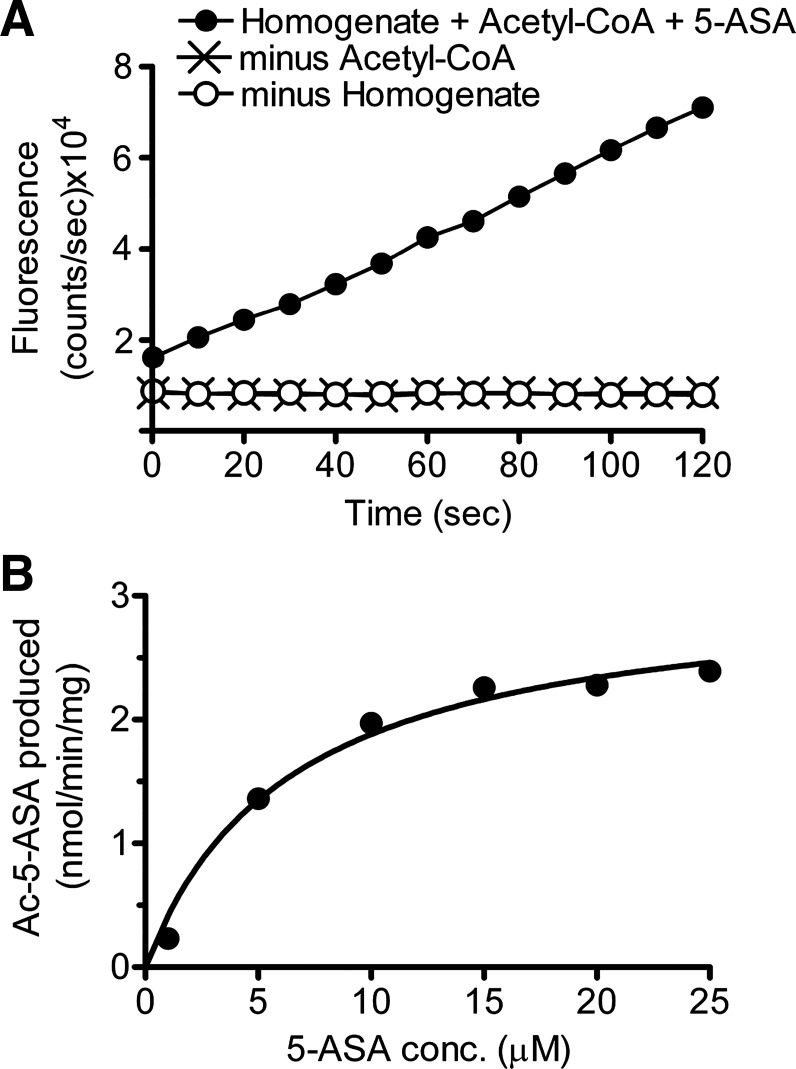
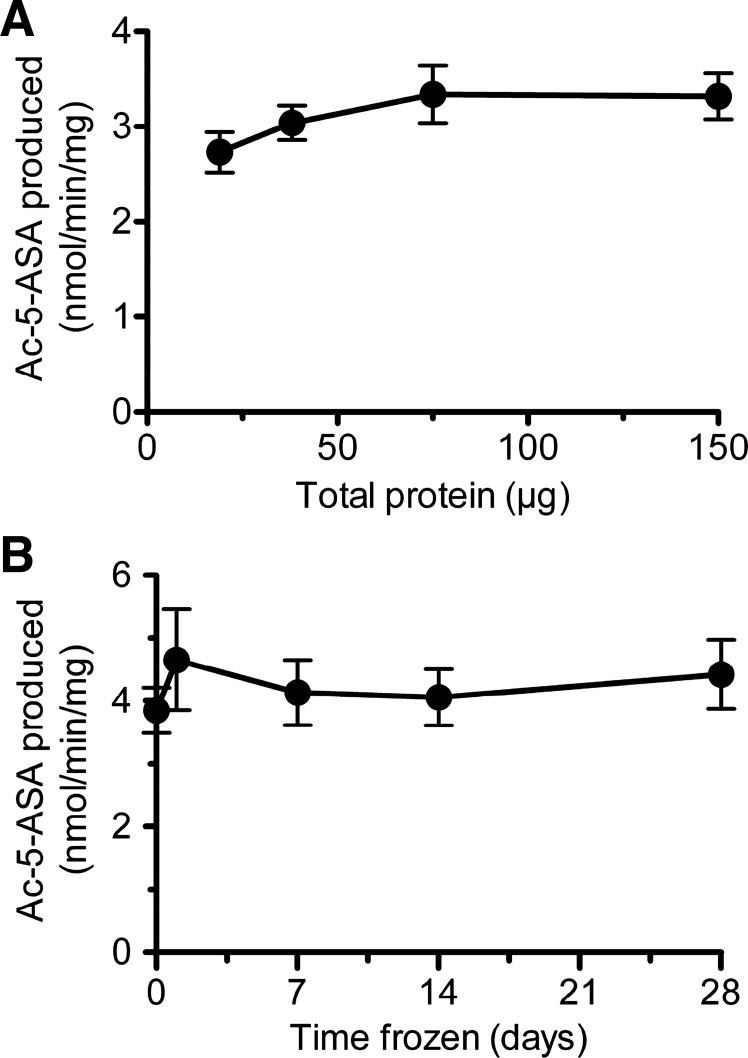
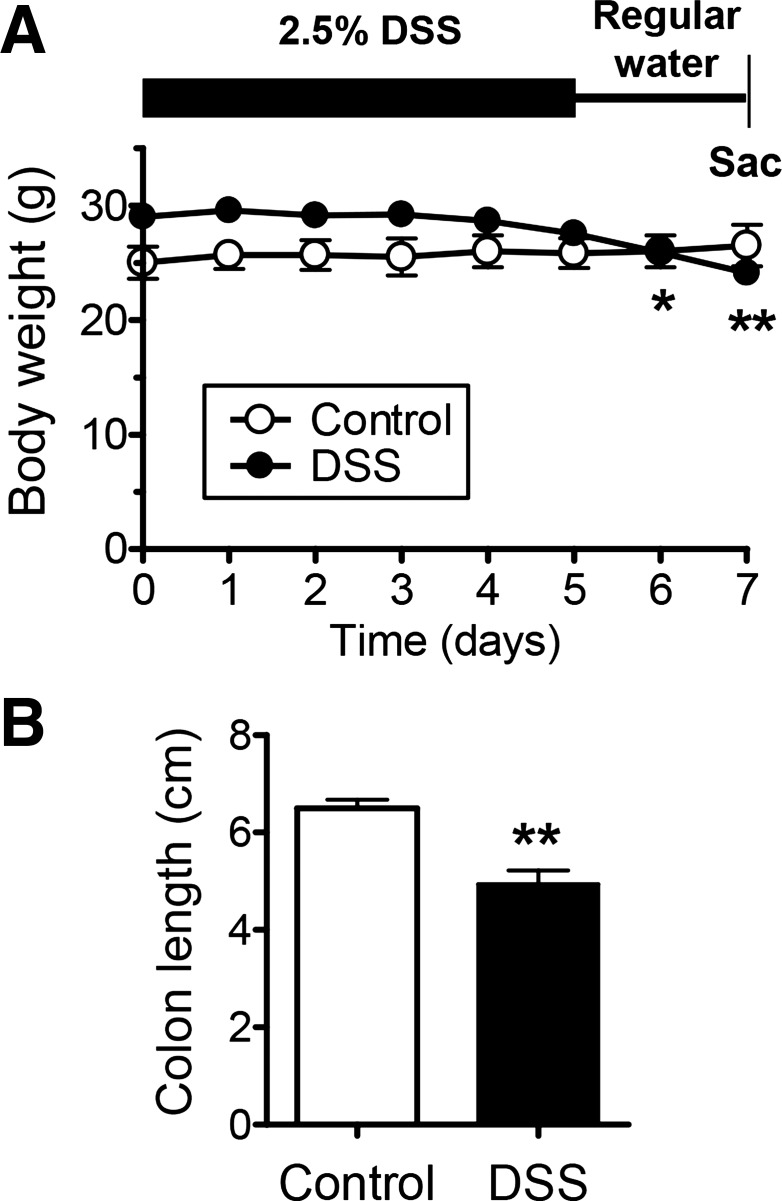
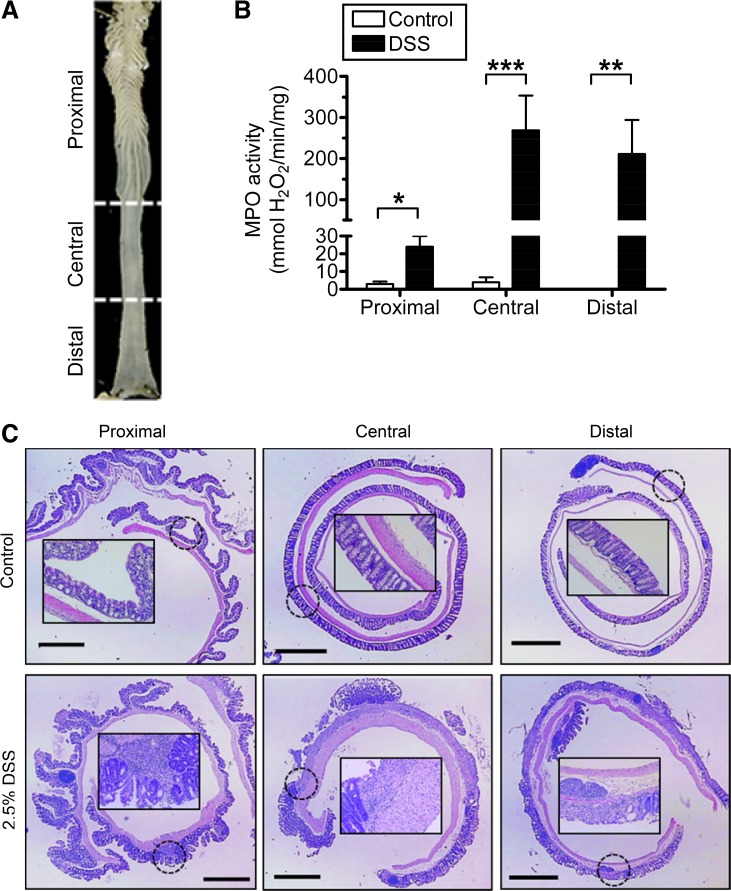
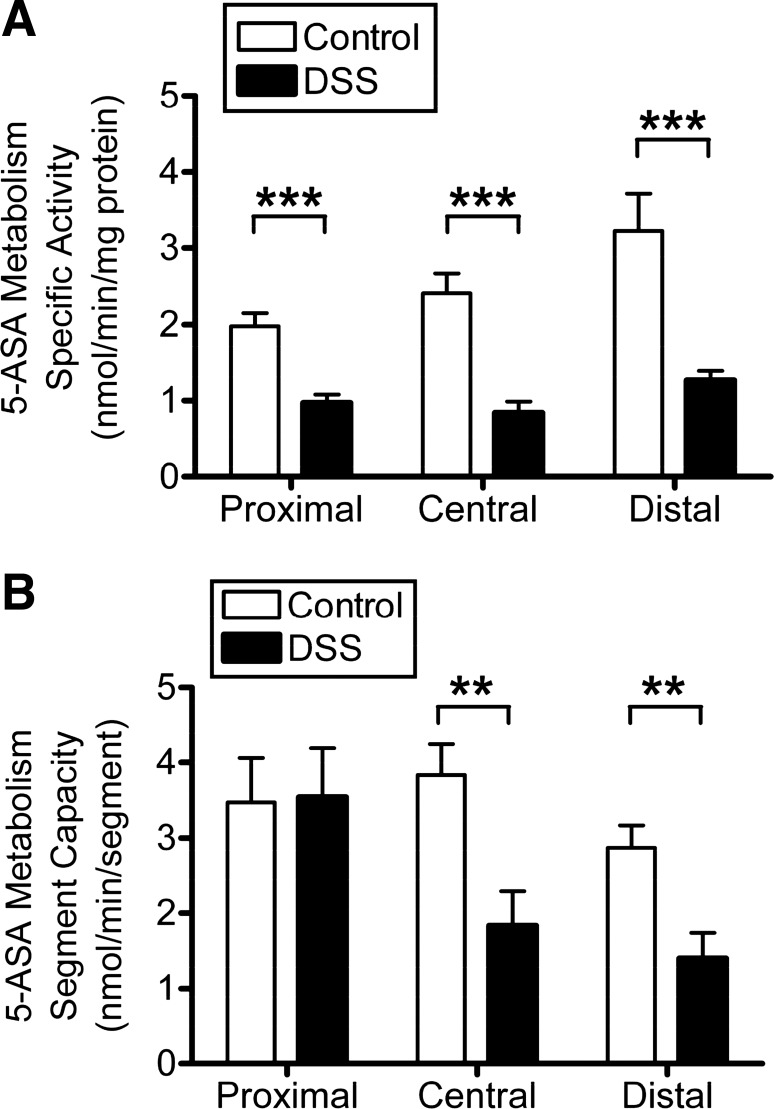
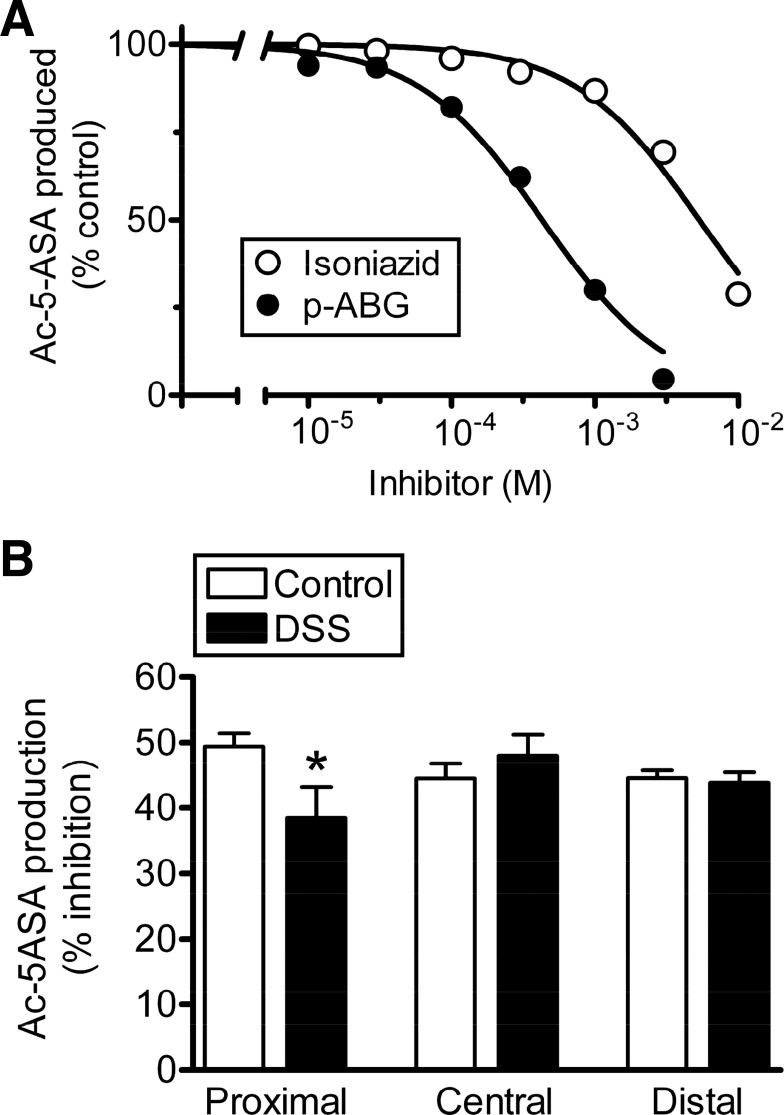
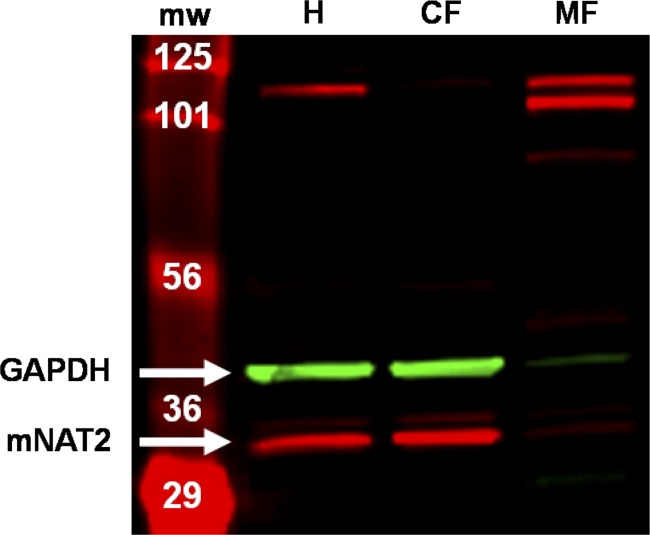
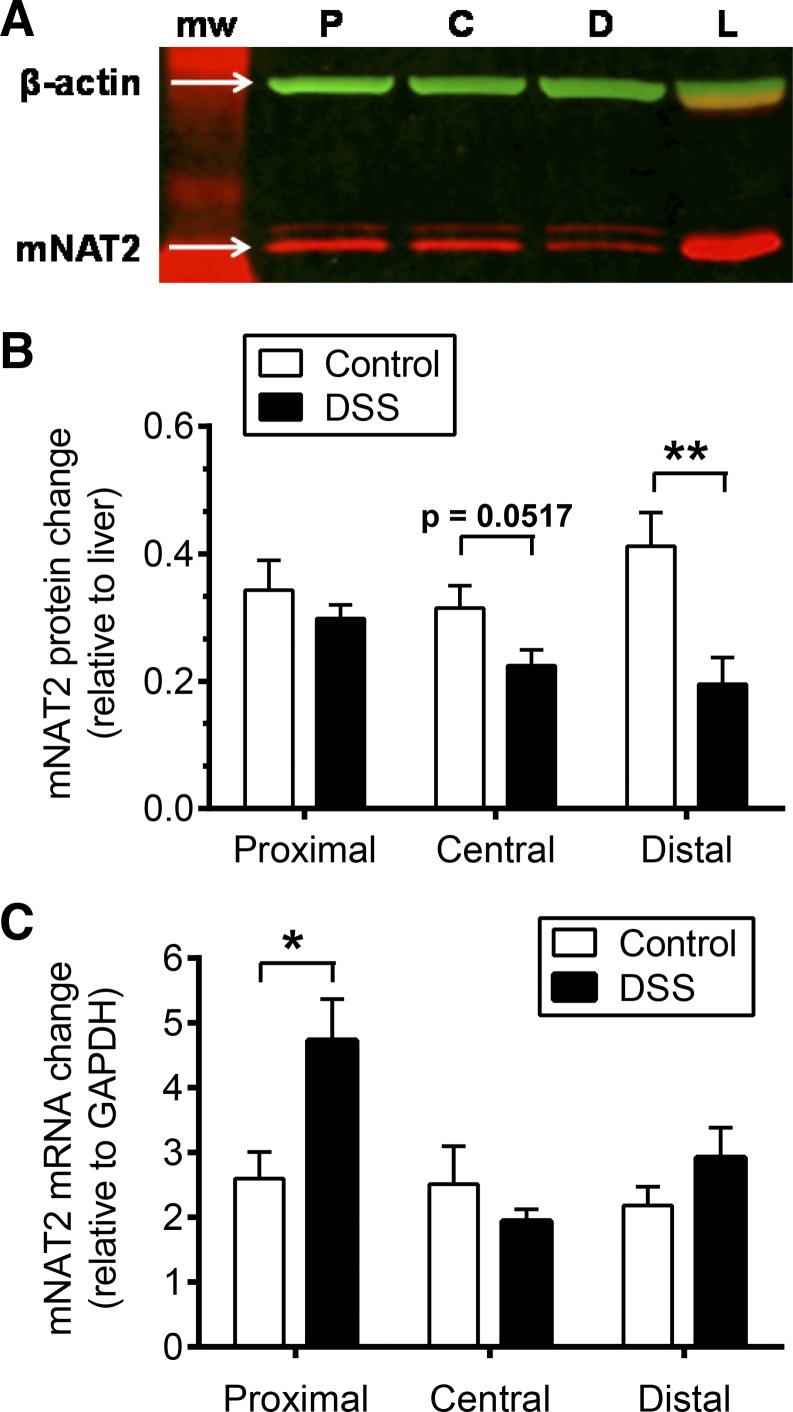
Pharmacotherapy based on 5-aminosalicylic acid (5-ASA) is a preferred treatment for ulcerative colitis, but variable patient response to this therapy is observed. Inflammation can affect therapeutic outcomes by regulating the expression and activity of drug-metabolizing enzymes; its effect on 5-ASA metabolism by the colonic arylamine N-acetyltransferase (NAT) enzyme isoforms is not firmly established. We examined if inflammation affects the capacity for colonic 5-ASA metabolism and NAT enzyme expression. 5-ASA metabolism by colonic mucosal homogenates was directly measured with a novel fluorimetric rate assay. 5-ASA metabolism reported by the assay was dependent on Ac-CoA, inhibited by alternative NAT substrates (isoniazid, p-aminobenzoylglutamate), and saturable with Km (5-ASA) = 5.8 μM. A mouse model of acute dextran sulfate sodium (DSS) colitis caused pronounced inflammation in central and distal colon, and modest inflammation of proximal colon, defined by myeloperoxidase activity and histology. DSS colitis reduced capacity for 5-ASA metabolism in central and distal colon segments by 52 and 51%, respectively. Use of selective substrates of NAT isoforms to inhibit 5-ASA metabolism suggested that mNAT2 mediated 5-ASA metabolism in normal and colitis conditions. Western blot and real-time RT-PCR identified that proximal and distal mucosa had a decreased mNAT2 protein-to-mRNA ratio after DSS. In conclusion, an acute colonic inflammation impairs the expression and function of mNAT2 enzyme, thereby diminishing the capacity for 5-ASA metabolism by colonic mucosa.

Keywords: dextran sulfate sodium; drug metabolism; enzymatic assay; enzyme isoform; fluorescence; inflammatory bowel disease; kinetics; myeloperoxidase.


Figures

Fig. 1.
Fig. 1.
Fluorescence detection of acetyl-5-aminosalicylic acid (Ac-5-ASA). Representative traces of fluorescence intensity vs. wavelength, recorded in a fluorometer cuvette as described in materials and methods. A: fluorescence excitation (Ex) and emission (Em) spectra of 100 μM Ac-5-ASA (solid line, peak excitation 312 nm, peak emission 437 nm) or 100 μM 5-aminosalicylic acid (5-ASA, broken line, peak excitation 335 nm, peak emission 500 nm). Excitation spectra were recorded with 437 nm emission, and emission spectra were recorded with 312 nm excitation. Results show relative efficiency for detecting Ac-5-ASA metabolite vs. 5-ASA substrate. B: fluorescence produced over time by in vitro enzymatic reaction in the presence of 25 μM 5-ASA, 0.4 mM acetyl-coenzyme A (Ac-CoA), and whole colon mucosal homogenate. Ac-CoA was added at time 0, and emission spectra were collected at the indicated time.
Fig. 2.
Fig. 2.
In vitro Ac-5-ASA production is via N-acetyltransferase (NAT) enzyme. A: representative time course of fluorigenic reaction when 25 μM 5-ASA is added at time 0 to mixtures that contain whole colon mucosal homogenate plus the NAT cofactor Ac-CoA (0.4 mM) (●), or incomplete mixtures missing either Ac-CoA (x) or colon homogenate (○). B: representative experiment showing calculated Ac-5-ASA production as a function of 5-ASA concentration added to the fluorigenic reaction at time 0 (in the presence of Ac-CoA and whole colon homogenate). Solid line is nonlinear regression fit to Michaelis-Menten kinetics of this individual experiment (Km = 6.4 μM, Vmax = 3.1 nmol·min−1·mg protein−1), with compiled outcomes from multiple experiments presented in results.
Fig. 3.
Fig. 3.
Sensitivity and stability of 5-ASA metabolism measurement. A: metabolic conversion of 5-ASA to Ac-5-ASA is measured in response to varying amounts of whole colon homogenate. Means ± SE, n = 5 mice. B: 5-ASA metabolism measured in fresh homogenates (day 0), or in the same homogenates thawed one time after the indicated time frozen at −80°C. Means ± SE, n = 4 mice.
Fig. 4.
Fig. 4.
Confirmation and characterization of dextran sulfate sodium (DSS)-induced colitis. Colitis was induced by replacing regular drinking water with 2.5% DSS for 5 days and then returning to regular drinking water for 2 days before animal death. A: daily weight record of mice getting regular water (control) or 2.5% DSS (DSS) as described above. *P < 0.05 and **P < 0.01 vs. day 0 using one-way ANOVA with Dunnett's posttest. B: measured length of excised colon. **P < 0.01 vs. control group. Means ± SE, n = 6 (control) or n = 9 (DSS).
Fig. 5.
Fig. 5.
Segmental evaluation of granulocyte infiltration and histopathology after DSS. A: excised mouse colon, with markings and text to indicate the three colon sections used to evaluate longitudinal heterogeneity of colitis and 5-ASA metabolism. B: myeloperoxidase (MPO) activity in mucosal homogenates from different colon segments. Control mice (white bars) were given normal drinking water. Acute colitis (black bars) was induced by addition of 2.5% DSS to drinking water for 5 days as described in materials and methods. Values are means ± SE for n = 6 (control) or n = 9 (DSS) mice. *P < 0.05, **P < 0.01, and ***P < 0.001 comparing DSS treatment vs. corresponding colon segment control. C: representative images of each colon section stained with hematoxylin and eosin showing histological alterations after colitis protocol; original magnifications ×20. The inset (×200) magnifies the general area indicated by the dotted circle. Bar = 1 mm.
Fig. 6.
Fig. 6.
Effect of DSS colitis on 5-ASA metabolism. Fluorimetric NAT activity assay compares mucosal enzyme activity in control mice (white bars) vs. those exposed to DSS (black bars). Excised colon was divided into proximal, central, and distal segments (see Fig. 5A), and their mucosa homogenate was analyzed separately. Means ± SE for n = 6 (control) or n = 9 (DSS). **P < 0.01 and ***P < 0.001 comparing DSS treatment vs. corresponding colon segment control. A: NAT metabolism of 5-ASA normalized to the homogenate protein used in the assay. B: NAT metabolism of 5-ASA summed to estimate the total enzyme activity within a given segment, based on the total amount of protein extracted from each colon segment.
Fig. 7.
Fig. 7.
Potency of isoform-specific NAT substrates to block 5-ASA metabolism in healthy and inflamed colonic mucosa. A: Ac-5-ASA production was measured in the presence of the indicated concentration of a selective substrate for mNAT1 (isoniazid, ○) or mNAT2 [p-aminobenzoylglutamate (p-ABG), ●] as a competitive inhibitor. For each homogenate, results were normalized to the values of Ac-5-ASA production observed in the absence of any inhibitory substance (control). Curves are nonlinear regression fits to a one-site competition binding model, with best-fit values of the inhibitor concentration giving 50% inhibition presented in Table 1. Means ± SE (error bars are smaller than symbols), n = 4 homogenates for each compound. B: Ac-5-ASA production measured in the absence (control) vs. presence of 436 μM p-ABG, and the percent inhibition calculated for homogenates made from healthy colon (white bars) or those exposed to DSS (black bars). Results were measured separately for proximal, central, and distal colon segments as indicated. Means ± SE, n = 6–7 (control) or n = 4–6 (DSS). *P < 0.05 comparing DSS treatment vs. corresponding control.
Fig. 8.
Fig. 8.
Detection of mNAT2 protein in cellular fractions. Representative Western blot membrane visualized on a Li-Cor Odyssey Infrared Imager showing mNAT2 protein (lower predominant red band) and GAPDH (green band) detected on separated proteins of total homogenate (H) and cellular fractions (CF, cytosolic; MF, membrane) from distal colon mucosa of a healthy mouse. NAT2 protein was detected with antisera 195 (kindly provided by Dr. E. Sim, University of Oxford, Oxford, UK). MW, molecular weight marker.
Fig. 9.
Fig. 9.
Effect of DSS colitis on mNAT2 protein and mRNA levels. A: representative Western blot showing mNAT2 protein (red band) and β-actin (green band) detected on proximal (P), central (C), and distal (D) colon mucosa homogenates from a mouse with DSS colitis. mNAT2 protein was detected with antisera 195, previously validated in mouse tissues (12). L, liver homogenate. B and C: mucosal colonic tissue from healthy animals (control, white bars) was compared with those with DSS colitis (DSS, black bars) with separate analysis of proximal, central, and distal colon segments as indicated. *P < 0.05 and **P < 0.01 comparing DSS treatment vs. corresponding colon segment control. B: Western blot analyses. β-Actin was used as loading control, and liver homogenate was used as a standard for comparison between blots. Means ± SE, n = 6 (control) or n = 9 (DSS). C: real-time RT-PCR measured mnat2 mRNA of colonic mucosa. For quantification, internal control (GAPDH) and positive control (liver) were used, and data were analyzed by the ΔΔCt method. Means ± SE, n = 4 (control) or n = 7 (DSS).

References

    1. Ahnfelt-Ronne I, Nielsen OH. The antiinflammatory moiety of sulfasalazine, 5-aminosalicylic acid, is a radical scavenger. Agents Actions 21: 191–194, 1987 - PubMed
    1. Allgayer H, Ahnfelt NO, Kruis W, Klotz U, Frank-Holmberg K, Soderberg HN, Paumgartner G. Colonic N-acetylation of 5-aminosalicylic acid in inflammatory bowel disease. Gastroenterology 97: 38–41, 1989 - PubMed
    1. Allgayer H, Hofer P, Schmidt M, Bohne P, Kruis W, Gugler R. Superoxide, hydroxyl and fatty acid radical scavenging by aminosalicylates. Direct evaluation with electron spin resonance spectroscopy. Biochem Pharmacol 43: 259–262, 1992 - PubMed
    1. Allgayer H, Rang S, Klotz U, Bohne P, Retey J, Kruis W, Gugler R. Superoxide inhibition following different stimuli of respiratory burst and metabolism of aminosalicylates in neutrophils. Dig Dis Sci 39: 145–151, 1994 - PubMed
    1. Allgayer H, Stenson WF. A comparison of effects of sulfasalazine and its metabolites on the metabolism of endogenous vs. exogenous arachidonic acid. Immunopharmacology 15: 39–46, 1988 - PubMed

Publication types