

The influence of spatiotemporal structure of noisy stimuli in decision making
- PMID: 24743140
- PMCID: PMC3990472
- DOI: 10.1371/journal.pcbi.1003492
The influence of spatiotemporal structure of noisy stimuli in decision making
Abstract
Decision making is a process of utmost importance in our daily lives, the study of which has been receiving notable attention for decades. Nevertheless, the neural mechanisms underlying decision making are still not fully understood. Computational modeling has revealed itself as a valuable asset to address some of the fundamental questions. Biophysically plausible models, in particular, are useful in bridging the different levels of description that experimental studies provide, from the neural spiking activity recorded at the cellular level to the performance reported at the behavioral level. In this article, we have reviewed some of the recent progress made in the understanding of the neural mechanisms that underlie decision making. We have performed a critical evaluation of the available results and address, from a computational perspective, aspects of both experimentation and modeling that so far have eluded comprehension. To guide the discussion, we have selected a central theme which revolves around the following question: how does the spatiotemporal structure of sensory stimuli affect the perceptual decision-making process? This question is a timely one as several issues that still remain unresolved stem from this central theme. These include: (i) the role of spatiotemporal input fluctuations in perceptual decision making, (ii) how to extend the current results and models derived from two-alternative choice studies to scenarios with multiple competing evidences, and (iii) to establish whether different types of spatiotemporal input fluctuations affect decision-making outcomes in distinctive ways. And although we have restricted our discussion mostly to visual decisions, our main conclusions are arguably generalizable; hence, their possible extension to other sensory modalities is one of the points in our discussion.
Conflict of interest statement
The authors have declared no competing interests exist.
Figures

 and bottom panels E and F for
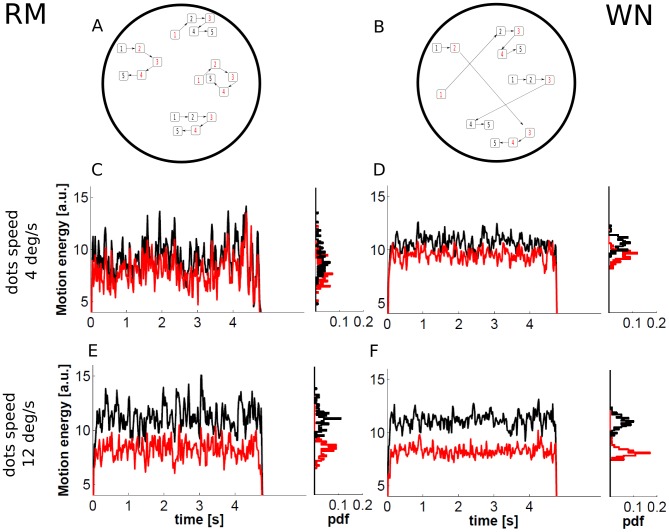
  . In particular, 2AFC RDM stimuli with motion in two opposite directions and a single coherent component with a coherence level
  are considered. The black and red curves correspond to the preferred and null direction, respectively. The four histograms show the probability distribution function (pdf) of the average motion energy in a 50 ms time window. In our implementation, the movement of the points was updated every frame (as in [22], [23]), in contrast to every three frames as is common in other studies (e.g., [25], [64], [73]).
Similar articles
-
Spatiotemporal dynamics of random stimuli account for trial-to-trial variability in perceptual decision making.Sci Rep. 2016 Jan 11;6:18832. doi: 10.1038/srep18832. Sci Rep. 2016. PMID: 26752272 Free PMC article.
-
Predicting Perceptual Decisions Using Visual Cortical Population Responses and Choice History.J Neurosci. 2019 Aug 21;39(34):6714-6727. doi: 10.1523/JNEUROSCI.0035-19.2019. Epub 2019 Jun 24. J Neurosci. 2019. PMID: 31235648 Free PMC article.
-
The interplay between multisensory integration and perceptual decision making.Neuroimage. 2020 Nov 15;222:116970. doi: 10.1016/j.neuroimage.2020.116970. Epub 2020 May 23. Neuroimage. 2020. PMID: 32454204
-
[Neural mechanisms of decision making].Brain Nerve. 2008 Sep;60(9):1017-27. Brain Nerve. 2008. PMID: 18807936 Review. Japanese.
-
Models, movements, and minds: bridging the gap between decision making and action.Ann N Y Acad Sci. 2020 Mar;1464(1):30-51. doi: 10.1111/nyas.13973. Epub 2018 Oct 12. Ann N Y Acad Sci. 2020. PMID: 30312476 Review.
Cited by
-
Vacillation, indecision and hesitation in moment-by-moment decoding of monkey motor cortex.Elife. 2015 May 5;4:e04677. doi: 10.7554/eLife.04677. Elife. 2015. PMID: 25942352 Free PMC article.
-
Stochastic Motion Stimuli Influence Perceptual Choices in Human Participants.Front Neurosci. 2022 Mar 2;15:749728. doi: 10.3389/fnins.2021.749728. eCollection 2021. Front Neurosci. 2022. PMID: 35309084 Free PMC article.
-
Irregular spiking of pyramidal neurons organizes as scale-invariant neuronal avalanches in the awake state.Elife. 2015 Jul 7;4:e07224. doi: 10.7554/eLife.07224. Elife. 2015. PMID: 26151674 Free PMC article.
-
Maximally informative foraging by Caenorhabditis elegans.Elife. 2014 Dec 9;3:e04220. doi: 10.7554/eLife.04220. Elife. 2014. PMID: 25490069 Free PMC article.
-
Detecting changes in dynamic and complex acoustic environments.Elife. 2017 Mar 6;6:e24910. doi: 10.7554/eLife.24910. Elife. 2017. PMID: 28262095 Free PMC article.
References
-
- Werner G, Mountcastle VB (1965) Neural activity in mechanoreceptive cutaneous afferents: Stimulus-response relations, Weber functions, and information transmission. J Neurophysiol 28: 359–397. - PubMed
-
- Mountcastle VB, Talbot WH, Darian-Smith I, Kornhuber HH (1967) Neural basis of the sense of flutter-vibration. Science 155: 597–600. - PubMed
-
- Talbot WH, Darian-Smith I, Kornhuber HH, Mountcastle VB (1968) The sense of flutter-vibration: Comparison of the human capacity with response patterns of mechanoreceptive afferents from the monkey hand1. J Neurophysiol 31: 301–304. - PubMed
Publication types
MeSH terms
LinkOut - more resources
Full Text Sources
Other Literature Sources
Medical
