. 2014 Apr 17;10(4):e1004261.
doi: 10.1371/journal.pgen.1004261. eCollection 2014 Apr.

Analysis of the genome and transcriptome of Cryptococcus neoformans var. grubii reveals complex RNA expression and microevolution leading to virulence attenuation

Affiliations

Analysis of the genome and transcriptome of Cryptococcus neoformans var. grubii reveals complex RNA expression and microevolution leading to virulence attenuation

Guilhem Janbon et al. PLoS Genet. .

Abstract

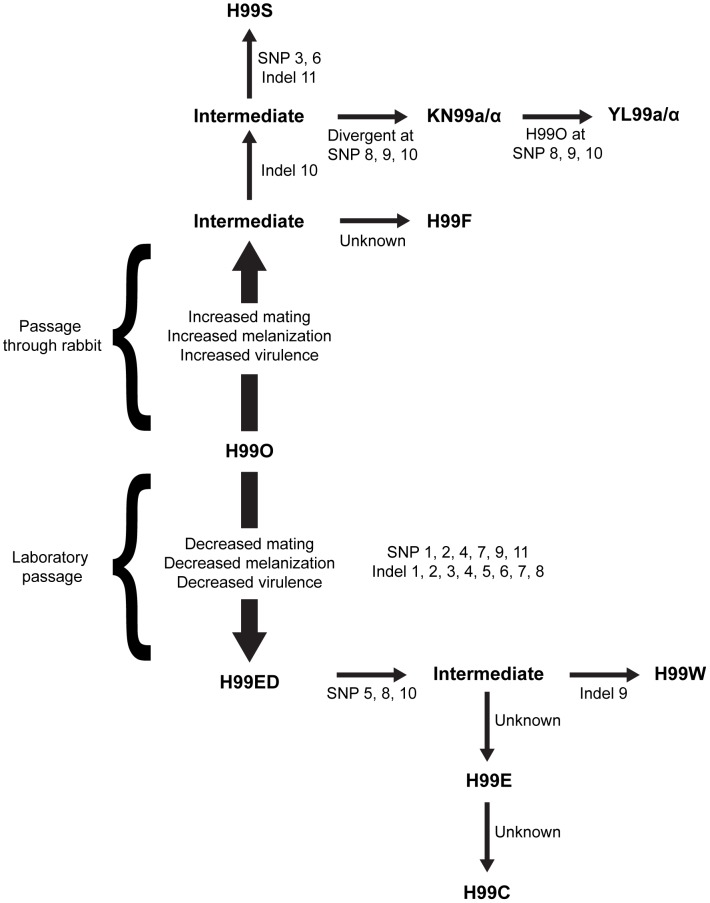
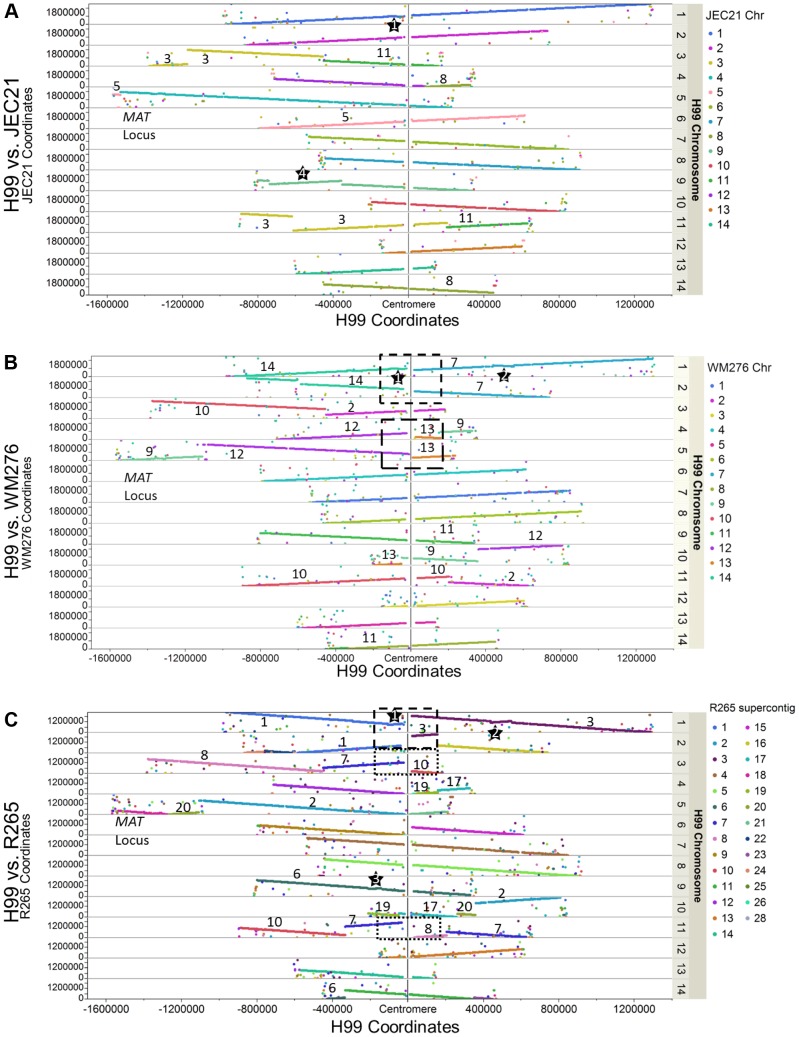
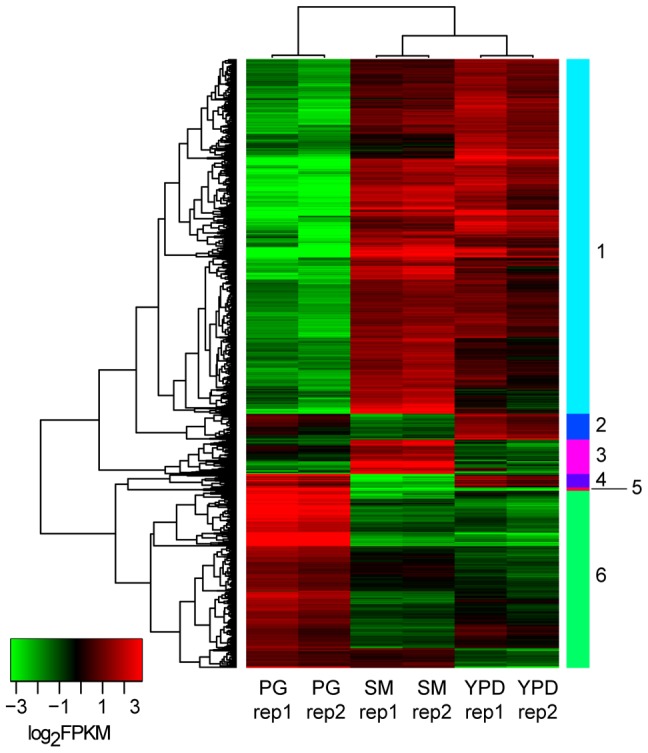
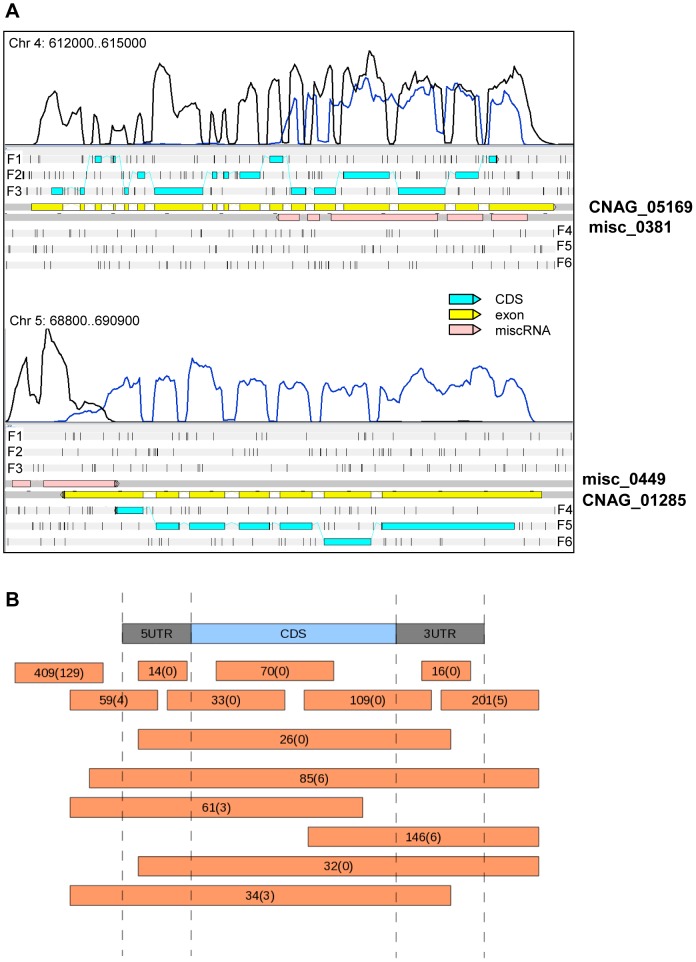
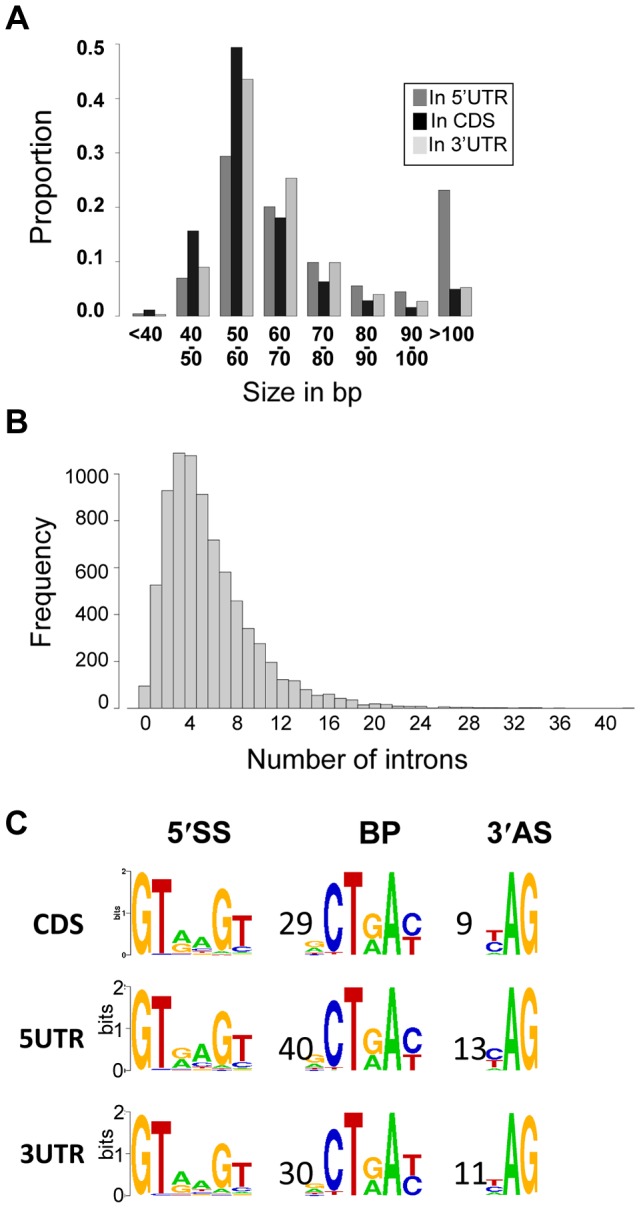
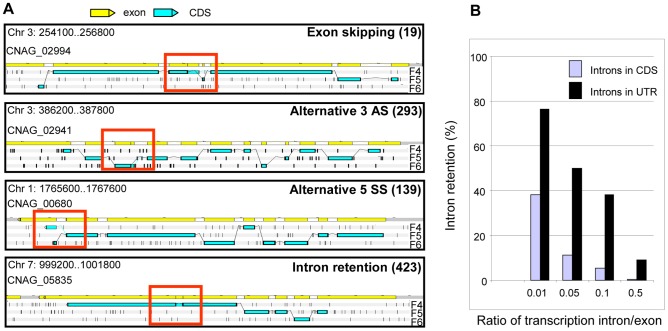
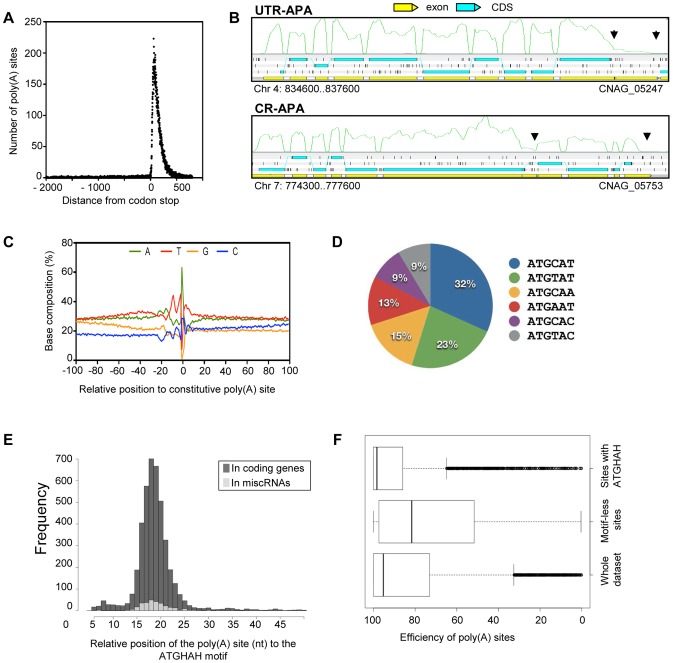
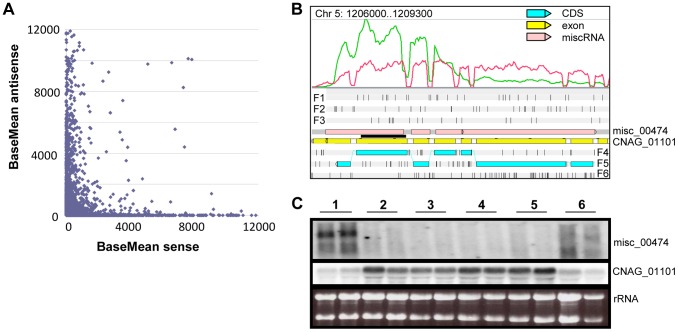
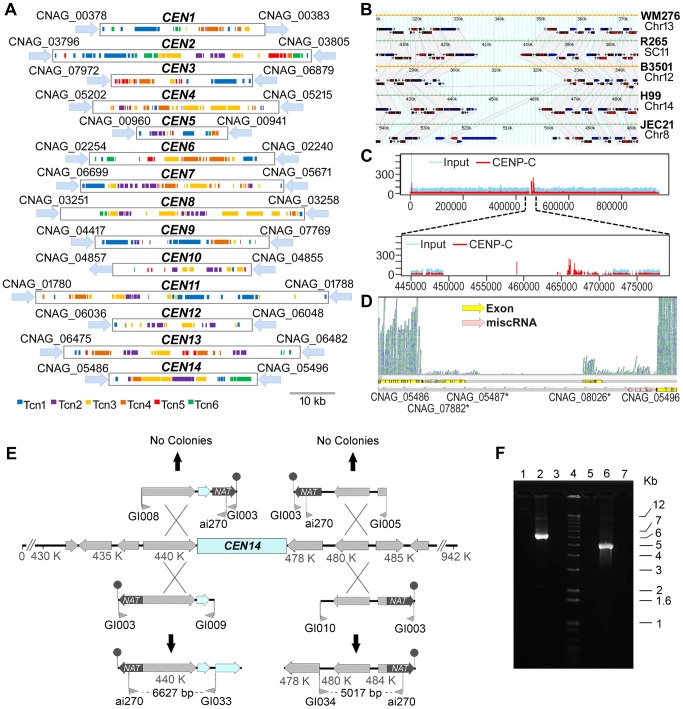
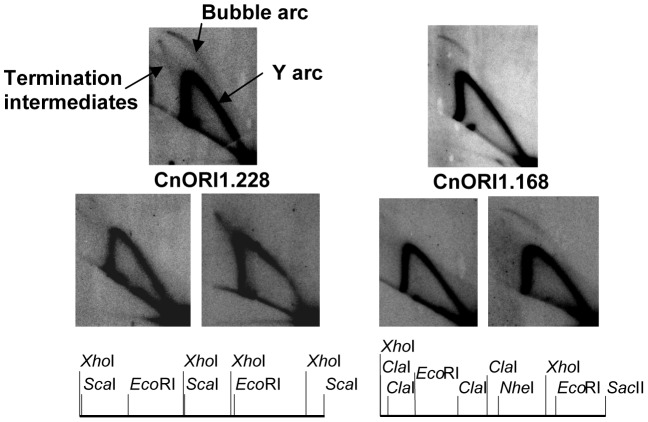
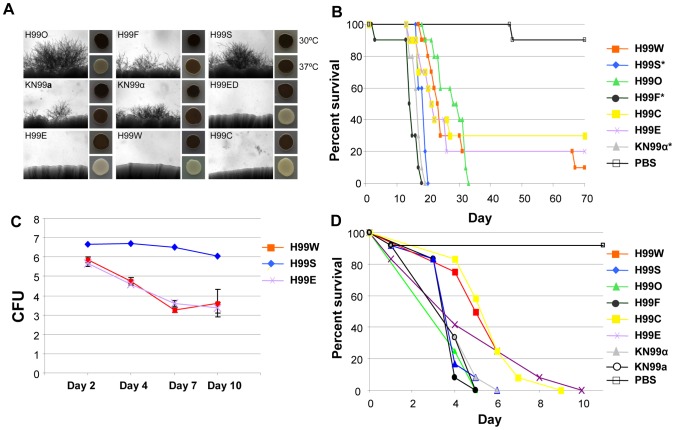
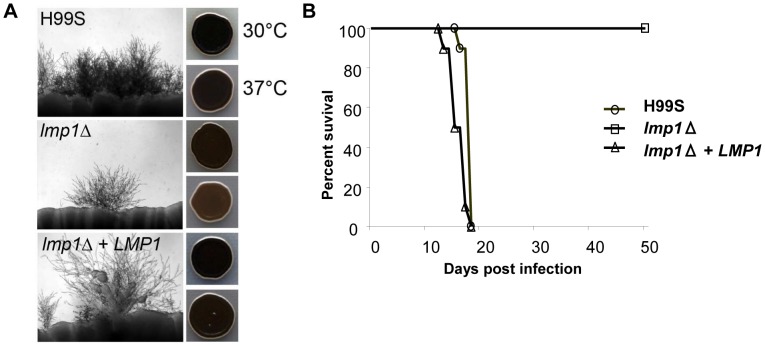
Cryptococcus neoformans is a pathogenic basidiomycetous yeast responsible for more than 600,000 deaths each year. It occurs as two serotypes (A and D) representing two varieties (i.e. grubii and neoformans, respectively). Here, we sequenced the genome and performed an RNA-Seq-based analysis of the C. neoformans var. grubii transcriptome structure. We determined the chromosomal locations, analyzed the sequence/structural features of the centromeres, and identified origins of replication. The genome was annotated based on automated and manual curation. More than 40,000 introns populating more than 99% of the expressed genes were identified. Although most of these introns are located in the coding DNA sequences (CDS), over 2,000 introns in the untranslated regions (UTRs) were also identified. Poly(A)-containing reads were employed to locate the polyadenylation sites of more than 80% of the genes. Examination of the sequences around these sites revealed a new poly(A)-site-associated motif (AUGHAH). In addition, 1,197 miscRNAs were identified. These miscRNAs can be spliced and/or polyadenylated, but do not appear to have obvious coding capacities. Finally, this genome sequence enabled a comparative analysis of strain H99 variants obtained after laboratory passage. The spectrum of mutations identified provides insights into the genetics underlying the micro-evolution of a laboratory strain, and identifies mutations involved in stress responses, mating efficiency, and virulence.


Conflict of interest statement

The authors have declared that no competing interests exist.

Figures

Figure 1
Figure 1. Origins of the independent lineages of H99.
Since the initial publication, the isolate has lost virulence following laboratory passage (possibly multiple independent times) and was subsequently passaged through the rabbit model of infection to increase virulence and distributed to many labs. All variants were derived from the original sequenced H99 isolate (H99O), and the major strain variants of this study have been termed H99W, H99E, and H99S. The origins of this strain series are as follows. During laboratory passage by repeated growth on YPD rich medium, the H99W/H99ED isolates arose from the H99O original stock (frozen in 1994). H99W and H99ED are distinguished from the parental strain by reduced melanin production, impaired mating, and attenuated virulence. This isolate or a closely related derivate of H99O was sent to the Lodge laboratory (Washington University, St Louis, USA) (H99E), and was subsequently distributed to the Madhani laboratory (University of California, San Francisco, USA) (H99CMO18, hereafter named H99C). Thus, isolates H99W and H99ED (Duke University), H99E (Washington University), and H99C (UCSF) are all closely related to one another. Additionally, John Perfect (Duke University Medical Center, USA) derived the H99S isolate via passage of a mixed H99 frozen stock through the well-validated rabbit model of central nervous system (CNS) infection. The pedigree was constructed based on SNPs and indels identified from sequence analysis. Specific mutations separating independent strains are annotated.
Figure 2
Figure 2. Genome comparisons between H99 and other Cryptococcus neoformans (JEC21 - A) and Cryptococcus gattii (WM276 - B and R265- C) strains.
Each dot represents the best tBLASTn return in the target genome when a protein sequence of H99 was used as query. The X axis shows the coordinates of the H99 chromosomes anchored on the centromeres at the middle. The Y axis shows the coordinates of the tBLASTn hits on their respective supercontigs/chromosomes in the target genomes. When the two chromosomes under comparison are in synteny, the BLAST hits of that H99 chromosome form a straight line composed by dots of same color (e.g. H99 chromosome 1 in Figure 2A). If there are chromosomal translocations, the BLAST hits of the H99 chromosome are composed of dots with different colors. Additionally, large-scale inversions (>60 kb in size) are highlighted by stars and boxes showing the potential translocations mediated by centromeres (see Results/Discussion). Numbers indicate the chromosomes/supercontigs in the target genome that have undergone translocations relative to the H99 genome.
Figure 3
Figure 3. Differentially expressed gene clusters.
Genes differentially expressed between the three conditions (PG, pigeon guano; SM, starvation medium; YPD, rich media) were identified from strand-specific RNA-Seq using EdgeR with two biological replicates per condition (rep1, rep2). Expression profiles are ordered based on hierarchical clustering tree; 6 clusters were defined using the kmeans algorithm (Material and Methods).
Figure 4
Figure 4. miscRNAs in C. neoformans var. grubii.
A. Two examples of a miscRNA as visualized through Artemis. The coverage of the plus stand is represented by the black curve. The coverage of the minus strand is represented by the blue curve. These results were obtained when cells grown in low glucose and nitrogen medium (starvation medium) underwent strand-specific sequencing. F1, F2, and F3 stand for 5′ to 3′ frames 1, 2, and 3, respectively. F4, F5, and F6 stand for 3′ to 5′ frames 1, 2 and 3, respectively. The small black vertical bars indicate the position of the stop codons for each frame. B. Schematic representation of the positions of the miscRNAs in the C. neoformans var. grubii genome as compared to coding sequences. The numbers of miscRNAs at each position is indicated. The number of miscRNAs in the antisense strand of other miscRNAs is indicated between brackets.
Figure 5
Figure 5. Introns in C. neoformans var. grubii.
A. Distribution of the introns according to their sizes. B. Distribution of the number of introns per gene. C. Motifs associated with introns in C. neoformans var. grubii. Numbers represent the average distance in bp between the motifs. The overall height of the stack indicates the sequence conservation at that position, while the height of symbols within the stack indicates the relative frequency of the nucleic acid at that position.
Figure 6
Figure 6. Alternative splicing in C. neoformans var. grubii.
A. Examples of alternative splicing. F4, F5, and F6 stand for 3′ to 5′ frames 1, 2 and 3, respectively. The small black vertical bars indicate the position of the stop codons for each frame. The numbers for each type of alternative splicing events annotated in the genome are indicated between brackets. B. Evaluation of intron retention level in C. neoformans according to the ratio of transcription intron/exon threshold used is represented.
Figure 7
Figure 7. Polyadenylation sites in C. neoformans var. grubii.
A. Poly(A) reads are enriched within 500 nt from the stop codon of the gene models. B. Examples of CR-APA and UTR-APA as visualized through Artemis. The black arrows indicate the position of the alternative poly(A) sites. The green curves indicate the plus strand coverage. The small black vertical bars indicate the position of the stop codons for each frame. C. Sequence composition around the poly(A) cleavage sites. D. Proportion of the variants of the AUGHAH motif. E. Relative position of the poly(A) site (nt) to the AUGHAH motif in coding genes and miscRNAs. F. Efficiency of the poly(A) sites to induce transcription termination according to the presence or absence of an AUGHAH motif.
Figure 8
Figure 8. Antisense/sense transcription in C. neoformans var. grubii.
A. Comparison of sense/antisense transcription when an antisense transcript is present. Strand-specific data obtained from cells grown on YPD is shown. The BaseMean values represent the normalized reads count for each transcript and measure the level of sense transcription (x axis) and antisense transcription (y axis) as calculated by DESeq . Outliers with a BaseMean above 12,000 were not represented. B. Example of differential expression of miscRNA antisense of a coding gene as observed through Artemis. The red curve represents the non-strand-specific coverage observed when cells were grown in YPD to stationary phase at 30°C (condition 1); the green curve shows the non-strand-specific coverage observed when the cells were grown in YPD to log phase at 30°C (condition 2). F1, F2, and F3 stand for 5′ to 3′ frames 1, 2, and 3, respectively. F4, F5, and F6 stand for 3′ to 5′ frames 1, 2, and 3, respectively. The small black vertical bars indicate the position of the stop codons for each frame. C. Northern blot obtained after hybridization with strand-specific probes. RNA was extracted from cells growing in YPD (2×10⁸ cells/mL) at 30°C (condition 1), YPD (5×10⁷ cells/mL) at 30°C (condition 2), YPD with 0.01% SDS (5×10⁷ cells/mL) at 30°C (condition 3), YPD with 10 mg/mL fluconazole (5×10⁷ cells/mL) at 30°C (condition 4), YPD (5×10⁷ cells/mL) at 37°C (condition 5), and YP galactose (2×10⁸ cells/mL) at 30°C (condition 6) in duplicate. Then, 5 µg RNA were loaded on a denaturing electrophoresis agarose gel, electrophoresed, and transferred to a nylon membrane. The horizontal black line represents the position of the probes.
Figure 9
Figure 9. Organization of the centromeres in C. neoformans strain H99 and a comparison with other serotypes.
A. Schematic showing the distribution of transposons, Tcn1–Tcn6, in the presumptive centromeres of all 14 chromosomes of C. neoformans strain H99. Each region was identified as the largest ORF-free region on its respective chromosome and contains transposons or its footprints, which are clustered in these sites. B. A comparative analysis of the largest ORF-free regions predicted to be centromeres between C. neoformans var. grubii (H99), C. neoformans var. neoformans (JEC21 and B3501A), and C. gattii (WM276 and R265) using FungiDB reveal conserved synteny of the flanking genes in chromosome 14. The grey color represents the regions that show synteny among different strains. The ORFs present in the centromeric regions are either pseudogenes or have similarity with transposons. C. ChIP-Seq analysis showed the enrichment of a conserved kinetochore protein, CENP-C, at the centromeric regions. Here, the enrichment on centromeric region of chromosome 14 (CEN14) is shown. The upper panel shows the enrichment on the whole chromosome. In the lower panel, the putative centromeric region is enlarged to show the enrichment profile of CENP-C. D. RNA-Seq analysis reveals the absence of poly(A) RNA from CEN14. E. Targeted truncation mutagenesis on either side of the CEN14 centromere DNA. Four DNA fragments were produced and transformed into a diploid strain of C. neoformans. The stick-and-ball represents the telomeric seed sequence added to the constructs by amplification with primer GI003. No targeted recombination was observed for two constructs, whereas the other two PCR analyses indicated integration of the DNA in those regions. F. PCR confirmation of recombination. Lanes 1–3 contain PCRs with primers ai270-GI033, and lanes 5–7 contain PCRs with primers ai270-GI034. Lanes 1 and 5 are amplification results from the diploid strain AI187; lanes 2 and 6 are from strains with integration on the left and right sides, respectively; and lanes 3 and 7 are negative PCR controls. Lane 4 is the Invitrogen 1 kb+ size marker.
Figure 10
Figure 10. Identification of replication origins.
The two sets of three panels show 2D gel patterns of replication intermediates in the regions of CnORI1.168 and CnORI1.228, as diagramed below. The arcs of bubble-shaped replication intermediates, Y-shaped replication intermediates, and replication intermediates are labeled on the upper left panel. The upper autoradiogram in each set shows the 2D gels of the EcoRI fragments that defined the origins. The two lower autoradiograms in each set show 2D gels of genomic restriction fragments that overlap the EcoRI fragments, also shown in the diagrams below. CnORI1.228: upper panel, 4,722-bp EcoRI fragment; lower left panel, 4,655-bp XhoI fragment overlapping left end of EcoRI fragment; lower right panel, 6,297-bp ScaI fragment overlapping right end of EcoRI fragment. CnORI1.168: Upper panel, 5,728-bp EcoRI fragment; lower left panel, 4,803-bp XhoI-NheI fragment overlapping left end of EcoRI fragment; lower right panel, 4,810-bp ClaI-SacII fragment overlapping right end of EcoRI fragment. See text for details.
Figure 11
Figure 11. H99 passaged strains exhibit phenotypic variability.
A. Mating assays on V8 agar were incubated at room temperature for seven days in the dark. Each strain was mated with KN99a (except KN99a, which was mated with KN99α). Melanization assays were conducted on l–DOPA agar incubated at 30°C or 37°C for two days. B. H99 variants differ in virulence in the murine model of infection. A group of 10 animals was each infected with an inoculum of 5.0×10⁵ cells via intranasal instillation for each strain. The results illustrate virulence variations between these well-defined H99 lineage isolates. A PBS control in which no cells were inoculated was also included. We compared the survival data for the seven strains using the Kaplan-Meier method. The significance of the pairwise comparisons to H99O was determined by the Mantel-Cox log rank test. The average time of survival was significantly shorter for the H99S, H99F, and KN99α strains compared to H99O. The survival times of the other strains compared to those of H99O were not significantly different. C. H99 variants differ in virulence in the rabbit CNS model of infection. For each of the variants (H99S, H99W, and H99E), three rabbits were infected directly into the CNS. All rabbits were immunosuppressed with steroid treatment. Spinal taps were taken on days 2, 4, 7, and 10 and measured for CFU (log scale). All animals were euthanized at the conclusion of the experiment. D. H99 variants differ in virulence in a heterologous host model of infection. For each strain, a group of 12 Galleria mellonella larvae was infected with an inoculum of 1.0×10⁵ cells. Survival was monitored and plotted daily for 10 days. Isolates were significantly virulent (p<0.005) in comparison with the mock control (sterile PBS) infection, and isolates H99C and H99E were significantly less virulent than the H99O reference strain (p<0.05).
Figure 12
Figure 12. Deletion of LMP1 reduces mating efficiency, melanization and virulence.
A. Mating assays on V8 agar incubated at room temperature for 7 days in the dark. Each strain was mated with KN99a. One or two mating tufts were observed in the lmp1Δ mutant per mating reaction whereas the wild-type and lmp1Δ+LMP1 complemented strain mated robustly. Melanization is reduced in the lmp1Δ mutant at 37°C and restored in the lmp1Δ+LMP1 complemented strain in assays on l–DOPA agar incubated at 30°C or 37°C for 2 days. B. H99S, lmp1Δ mutant strain, and lmp1Δ+LMP1 complemented strain in the murine model of infection. Per each strain, a group of 10 animals was each infected with an inoculum of 5.0×10⁵ cells via intranasal instillation. The results illustrate the complete loss of virulence in the lmp1Δ mutant with the virulence restored back to the H99S level in the lmp1Δ+LMP1 complemented strain.

References

    1. Brown GD, Denning DW, Levitz SM (2012) Tackling human fungal infections. Science 336: 647. - PubMed
    1. Park BJ, Wannemuehler KA, Marston BJ, Govender N, Pappas PG, et al. (2009) Estimation of the current global burden of cryptococcal meningitis among persons living with HIV/AIDS. AIDS 23: 525–530. - PubMed
    1. Kwon-Chung KJ, Boekhout T, Wickes BL, Fell JW, Systematics of the genus Cryptococcus and its type species C. neoformans, in Cryptococcus from human pathogen to model yeast, J. Heitman, et al., Editors. 2011, ASM Press: Washington DC. p.3–15.
    1. Heitman J, Casadevall A, Lodge JK, Perfect JR (1999) The Cryptococcus neoformans genome sequencing project. Mycopathologia 148: 1–7. - PubMed
    1. Loftus B, Fung E, Roncaglia P, Rowley D, Amedeo P, et al. (2005) The genome and transcriptome of Cryptococcus neoformans, a basidiomycetous fungal pathogen of humans. Science 307: 1321–1324. - PMC - PubMed

Publication types