. 2014 Apr 17;10(4):e1003535.
doi: 10.1371/journal.pcbi.1003535. eCollection 2014 Apr.

Phylogenetic quantification of intra-tumour heterogeneity

Affiliations

Phylogenetic quantification of intra-tumour heterogeneity

Roland F Schwarz et al. PLoS Comput Biol. .

Abstract

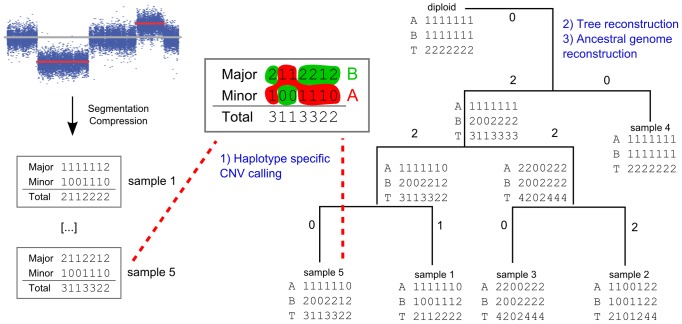
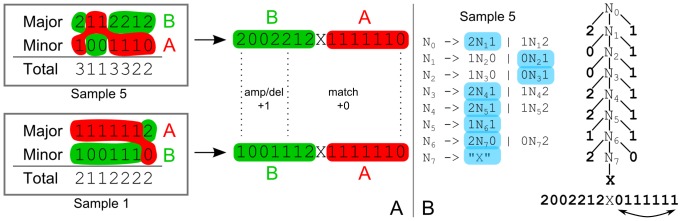
Intra-tumour genetic heterogeneity is the result of ongoing evolutionary change within each cancer. The expansion of genetically distinct sub-clonal populations may explain the emergence of drug resistance, and if so, would have prognostic and predictive utility. However, methods for objectively quantifying tumour heterogeneity have been missing and are particularly difficult to establish in cancers where predominant copy number variation prevents accurate phylogenetic reconstruction owing to horizontal dependencies caused by long and cascading genomic rearrangements. To address these challenges, we present MEDICC, a method for phylogenetic reconstruction and heterogeneity quantification based on a Minimum Event Distance for Intra-tumour Copy-number Comparisons. Using a transducer-based pairwise comparison function, we determine optimal phasing of major and minor alleles, as well as evolutionary distances between samples, and are able to reconstruct ancestral genomes. Rigorous simulations and an extensive clinical study show the power of our method, which outperforms state-of-the-art competitors in reconstruction accuracy, and additionally allows unbiased numerical quantification of tumour heterogeneity. Accurate quantification and evolutionary inference are essential to understand the functional consequences of tumour heterogeneity. The MEDICC algorithms are independent of the experimental techniques used and are applicable to both next-generation sequencing and array CGH data.


Conflict of interest statement

The authors have declared that no competing interests exist.

Figures

Figure 1
Figure 1. Evolutionary copy-number trees are reconstructed in three steps.
1) After segmentation and compression, major and minor alleles are phased using the minimum event criterion. 2) The tree topology is reconstructed from the pairwise distances between genomes. 3) Reconstruction of ancestral genomes yields the final branch lengths of the tree, which correspond to the number of events between genomes.
Figure 2
Figure 2. Parental alleles are phased using context-free grammars.
A) Allelic phasing is achieved by choosing consecutive segments from either the major or minor allele which minimise the pairwise distance between profiles. B) The set of all possible phasing choices is modelled by a context-free grammar. In this representation, the order of the regions' copy-number values on the second allele is reversed, in order to match the inside-out parsing scheme of CFGs. That way every possible parse tree of the grammar describes one possible phasing.
Figure 3
Figure 3. Efficient distance calculation is enabled via a transducer architecture.
A) Overlapping genomic rearrangements modify the associated copy-number profiles in different ways. Amplifications are indicated in green, deletions in red. The blue rectangles indicate the previous event. B) The one-step minimum event transducer describes all possible edit operations achievable in one event. This FST is composed formula image 
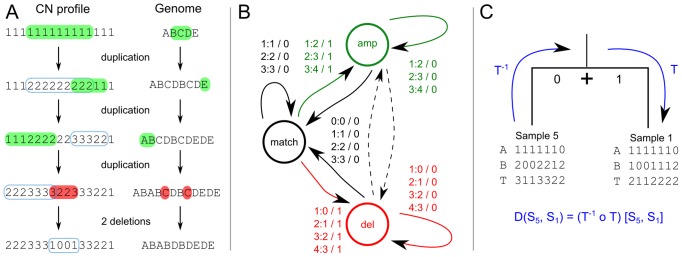
times with itself to create the the full minimum event FST formula image. Edge labels consist of an input symbol, a colon and the corresponding output symbol, followed by a slash and the weight associated with taking that transition. C) The minimum event FST formula image is asymmetric and describes the evolution of a genomic profile from its ancestor. Composed with its inverse this yields the symmetric minimum event distance formula image.
Figure 4
Figure 4. MEDICC improves reconstruction accuracy over competing methods.
A) Simulations results show the improvement of reconstruction accuracy for MEDICC over naive methods (BioNJ clustering on Euclidean distances between copy-number profiles, red) and competing algorithms (TuMult, green). B) Allele phasing accuracy across the simulated trees. On average 92.9% of all genomic loci were correctly assigned to the individual parental alleles. C) Density estimates of clonal expansion indices for neutrally evolving trees (red) and trees with induced long branches as created by clonal expansion processes (blue) show the ability of MEDICC to detect clonal expansion.
Figure 5
Figure 5. MEDICC quantifies heterogeneity from the locations of genomes on the mutational landscape.
A) If no or a homogeneous selection pressure is applied, cells proliferate and die randomly across the mutational landscape, leaving the surviving cells spatially unclustered. B) If the fitness landscape favours specific mutations (blue shaded areas), genomes inside those areas are more likely to survive, those outside more likely to die. The ability of a tumour for a clonal expansion into distant fitness pockets depends on its mutation potential per generation (long orange arrow). This leads to C) a situation where distinct subpopulations/clonal expansions are present in a tumour, indicating a generally high potential for a tumour to adapt to changing environments. D) The mutational landscape additionally allows estimates of average distance between two subgroups of samples, here before (blue) and after (orange) chemotherapy. The distance between the two subgroups is defined as the distance of the robust centres of mass (blue and orange X). This robust centre of mass is computed omitting the single most distant point of each subgroup (blue and orange samples in the orange and blue subgroups respectively), making the statistic more resistant towards outliers.
Figure 6
Figure 6. Application to a case of endometrioid cancer.
A) Evolutionary tree of the OV03-04 case reconstructed from whole genome copy-number profiles. Approximate support values indicate how often each split was observed in trees reconstructed after resampling of the distance matrix with added truncated Gaussian noise. MEDICC performs reconstruction of ancestral copy-number profiles. Here, the (compressed) ancestral profiles for chromosome 17 are given as an example and MEDICC depicts unresolved ambiguities in the form of sequence logos. A star indicates no change compared to its ancestor. B) Ordination of the samples using kPCA shows four clear clonal expansions, comprising three separate Omentum groups and the Bl/VV group. C) Circos plot of selected genomic profiles (marked in bold in the tree) shows the extent of chromosomal aberrations across the genome. The two phased parental alleles are indicated in red and blue.

References

    1. Khalique L, Ayhan A, Weale ME, Jacobs IJ, Ramus SJ, et al. (2007) Genetic intra-tumour heterogeneity in epithelial ovarian cancer and its implications for molecular diagnosis of tumours. J Pathol 211: 286–295. - PubMed
    1. Khalique L, Ayhan A, Whittaker JC, Singh N, Jacobs IJ, et al. (2009) The clonal evolution of metastases from primary serous epithelial ovarian cancers. Int J Cancer 124: 1579–1586. - PubMed
    1. Cooke SL, Ng CKY, Melnyk N, Garcia MJ, Hardcastle T, et al. (2010) Genomic analysis of genetic heterogeneity and evolution in high-grade serous ovarian carcinoma. Oncogene 29: 4905–4913. - PMC - PubMed
    1. Navin N, Krasnitz A, Rodgers L, Cook K, Meth J, et al. (2010) Inferring tumor progression from genomic heterogeneity. Genome Res 20: 68–80. - PMC - PubMed
    1. Shah SP, Morin RD, Khattra J, Prentice L, Pugh T, et al. (2009) Mutational evolution in a lobular breast tumour profiled at single nucleotide resolution. Nature 461: 809–813. - PubMed

Publication types