. 2014 Apr 17;10(4):e1003553.
doi: 10.1371/journal.pcbi.1003553. eCollection 2014 Apr.

A toolbox for representational similarity analysis

Affiliations

A toolbox for representational similarity analysis

Hamed Nili et al. PLoS Comput Biol. .

Abstract

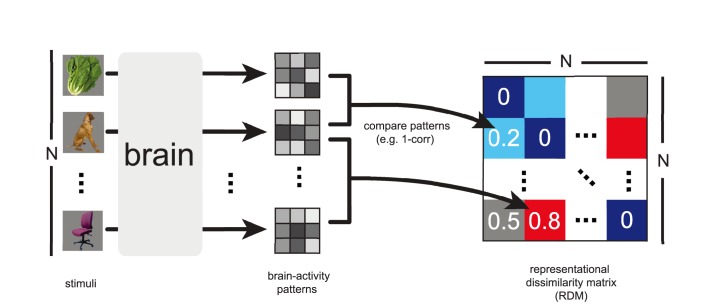
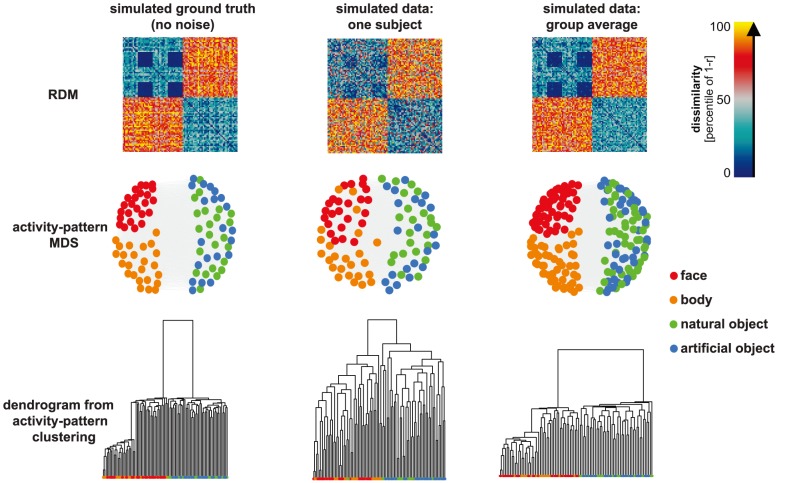
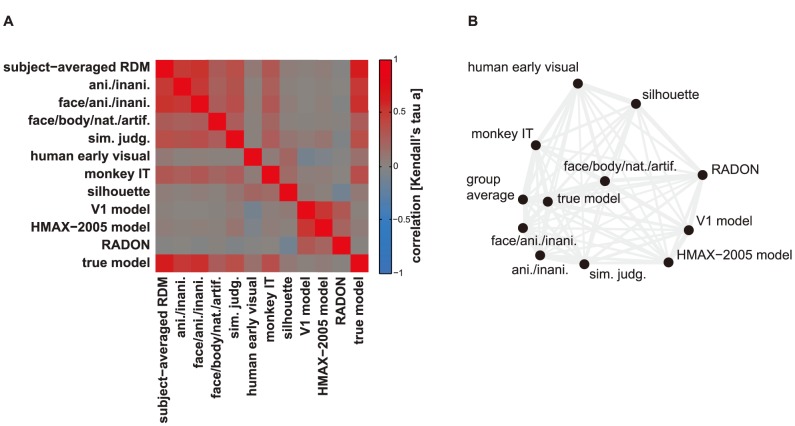
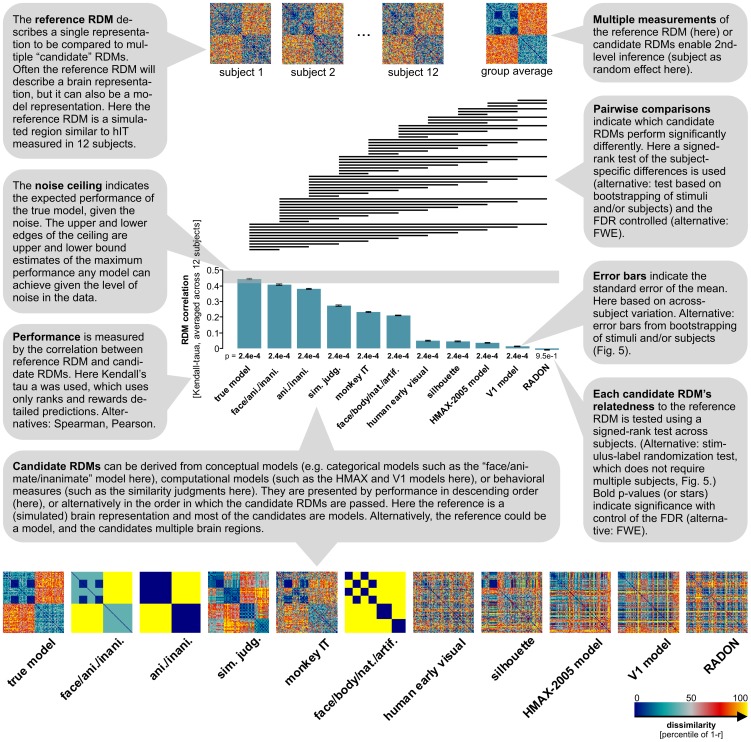
Neuronal population codes are increasingly being investigated with multivariate pattern-information analyses. A key challenge is to use measured brain-activity patterns to test computational models of brain information processing. One approach to this problem is representational similarity analysis (RSA), which characterizes a representation in a brain or computational model by the distance matrix of the response patterns elicited by a set of stimuli. The representational distance matrix encapsulates what distinctions between stimuli are emphasized and what distinctions are de-emphasized in the representation. A model is tested by comparing the representational distance matrix it predicts to that of a measured brain region. RSA also enables us to compare representations between stages of processing within a given brain or model, between brain and behavioral data, and between individuals and species. Here, we introduce a Matlab toolbox for RSA. The toolbox supports an analysis approach that is simultaneously data- and hypothesis-driven. It is designed to help integrate a wide range of computational models into the analysis of multichannel brain-activity measurements as provided by modern functional imaging and neuronal recording techniques. Tools for visualization and inference enable the user to relate sets of models to sets of brain regions and to statistically test and compare the models using nonparametric inference methods. The toolbox supports searchlight-based RSA, to continuously map a measured brain volume in search of a neuronal population code with a specific geometry. Finally, we introduce the linear-discriminant t value as a measure of representational discriminability that bridges the gap between linear decoding analyses and RSA. In order to demonstrate the capabilities of the toolbox, we apply it to both simulated and real fMRI data. The key functions are equally applicable to other modalities of brain-activity measurement. The toolbox is freely available to the community under an open-source license agreement (http://www.mrc-cbu.cam.ac.uk/methods-and-resources/toolboxes/license/).


Conflict of interest statement

The authors have declared that no competing interests exist.

Figures

Figure 1
Figure 1. Computation of the representational dissimilarity matrix (RDM).
During the experiment, each subject's brain activity is measured while the subject is exposed to N experimental conditions, such as the presentation of sensory stimuli. For each brain region of interest, an activity pattern is estimated for each experimental condition. For each pair of activity patterns, a dissimilarity is computed and entered into a matrix of representational dissimilarities. When a single set of response-pattern estimates is used, the RDM is symmetric about a diagonal of zeros. The dissimilarities between the activity patterns can be thought of as distances between points in the multivariate response space. An RDM describes the geometry of the representation and serves as a signature that can be compared between brains and models, between different brain regions, and between individuals and species.
Figure 2
Figure 2. Visualizing representations as RDMs, 2D arrangements, and clustering dendrograms.
Percentiled RDMs are displayed in the top row. The left RDM corresponds to the simulated ground truth (dissimilarities measured before adding noise). The middle RDM is an example of a simulated single-subject RDM (dissimilarities measured after adding isotropic Gaussian noise to the ground-truth patterns). The group-average RDM (right) is computed by averaging the RDMs for all 12 simulated subjects, which reduces the noise. Visual inspection reveals the simulated structure designed here to be similar to the human-IT RDM from Kriegeskorte et al. , with two main clusters corresponding to animate and inanimate objects and a cluster corresponding to human and animal faces. Two-dimensional arrangements (middle row, computed by MDS with metric stress criterion) provide a spatial visualization of the approximate geometry, without assuming any categorical structure. The third row displays the results of hierarchical agglomerative clustering to the three RDMs. Clustering starts with the assumption that there is some categorical structure and aims to reveal the categorical divisions. MDS plots and dendrograms share the same category color code (see color legend).
Figure 3
Figure 3. Visualizing the relationships among multiple representations.
(A) Matrix of RDM correlations. Each entry compares two RDMs by Kendall's τA. The matrix is symmetric about a diagonal of ones. (B) MDS of the RDMs. Each point represents an RDM, and distances between the points approximate the τA correlation distances (1 minus τA) among the RDMs. The 2D distances are highly correlated (0.94, Pearson; 0.91, Spearman) with the RDM correlation distances. Visual inspection reveals that the group-average RDM is similar to the ground-truth RDM. However, the group-average RDM is also similar to some other model RDMs.
Figure 4
Figure 4. Simulated representation – inferential comparisons of multiple model representations.
Several candidate RDMs are tested and compared for their ability to explain the reference RDM. As expected, the true model corresponding to the simulated ground truth (no noise) is the most similar candidate RDM to the reference. Note that the true model falls within the ceiling range, indicating that it performs as well as any possible model can, given the noise in the data. The second best fit among the candidate RDMs is the categorical model with some extra information about the within-animate category structure. This model reflects the categorical clustering in the simulated data, but misses the simulated within-category structure. A horizontal line over two bars indicates that the two models perform significantly differently. The pairwise statistical comparisons show that the true model is significantly better than all other candidate RDMs. Most of the other pairwise comparisons are significant as well, illustrating the power of the signed-rank test used for comparing candidate performances in this simulated scenario. Kendall's τA is used as a measure of RDM similarity, because candidates include categorical models (i.e. models predicting equal dissimilarities for many pairs of stimuli). Other rank-correlation coefficients overestimate the performance of categorical candidate RDMs (Figure S2 in Text S1). All candidate RDMs except that obtained from the RADON model are significantly related to the reference RDM (p values from one-sided signed-rank test across single-subject estimates beneath the bars).
Figure 5
Figure 5. Human IT (real data) – inferential comparisons of multiple model representations.
Like Fig. 4, this figure demonstrates inferential analyses supported by the toolbox. Here, however, inference is performed on real data from fMRI. The smaller number of subjects (4) precludes the use of second-level inference with subject as a random effect. Relatedness to the reference RDM is therefore tested using stimulus-label randomization and the pairwise performance comparisons among the candidate RDMs (along with the error bars) are based on bootstrap resampling of the stimulus set. The models are the same as in Fig. 4 and reproduced here for convenience (except for the “true model”, which is unknown for the real data). The comment bubbles detail the key changes in comparison to the analysis of Fig. 4, illustrating an alternative scenario for RSA statistical inference.

References

    1. Alivisatos AP, Chun M, Church GM, Greenspan RJ, Roukes ML, et al. (2012) The Brain Activity Map Project and the Challenge of Functional Connectomics. Neuron 74 (6) 970–974. - PMC - PubMed
    1. Haxby JV, Gobbini MI, Furey ML, Ishai A, Schouten JL, et al. (2001) Distributed and overlapping representations of faces and objects in ventral temporal cortex. Science 293: 2425–2430. - PubMed
    1. Hung CP, Kreiman G, Poggio T, DiCarlo JJ (2005) Fast Readout of Object Identity from Macaque Inferior Temporal Cortex. Science 310: 863–866 doi:10.1126/science.1117593 - DOI - PubMed
    1. Kamitani Y, Tong F (2005) Decoding the visual and subjective contents of the human brain. Nature neuroscience 8: 679–685. - PMC - PubMed
    1. Kriegeskorte N, Goebel R, Bandettini P (2006) Information-based functional brain mapping. Proceedings of the National Academy of Sciences of the United States of America 103: 3863–3868. - PMC - PubMed

Publication types

LinkOut - more resources