. 2014 Apr 17;10(4):e1004288.
doi: 10.1371/journal.pgen.1004288. eCollection 2014 Apr.

Genome-wide profiling of yeast DNA:RNA hybrid prone sites with DRIP-chip

Affiliations

Genome-wide profiling of yeast DNA:RNA hybrid prone sites with DRIP-chip

Yujia A Chan et al. PLoS Genet. .

Abstract

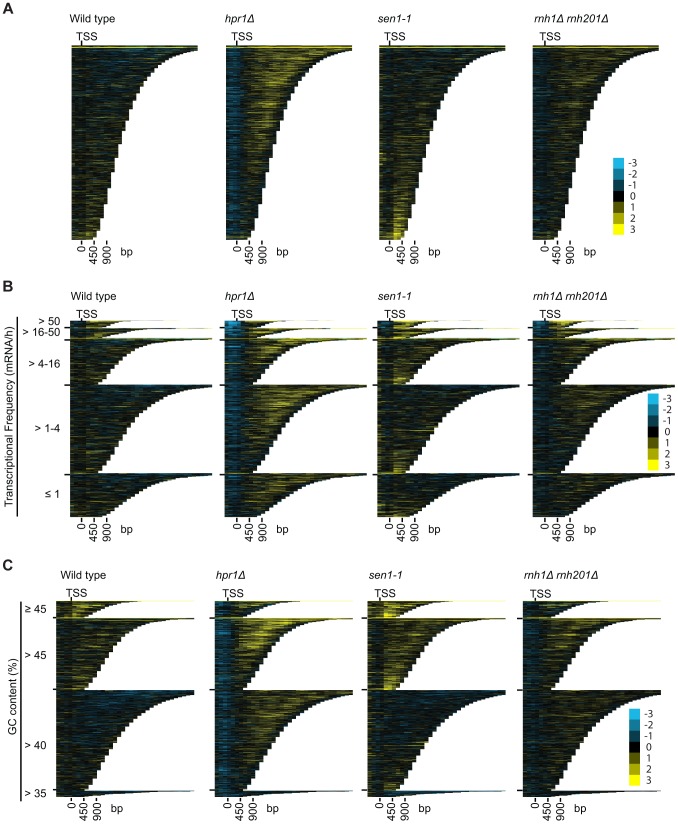
DNA:RNA hybrid formation is emerging as a significant cause of genome instability in biological systems ranging from bacteria to mammals. Here we describe the genome-wide distribution of DNA:RNA hybrid prone loci in Saccharomyces cerevisiae by DNA:RNA immunoprecipitation (DRIP) followed by hybridization on tiling microarray. These profiles show that DNA:RNA hybrids preferentially accumulated at rDNA, Ty1 and Ty2 transposons, telomeric repeat regions and a subset of open reading frames (ORFs). The latter are generally highly transcribed and have high GC content. Interestingly, significant DNA:RNA hybrid enrichment was also detected at genes associated with antisense transcripts. The expression of antisense-associated genes was also significantly altered upon overexpression of RNase H, which degrades the RNA in hybrids. Finally, we uncover mutant-specific differences in the DRIP profiles of a Sen1 helicase mutant, RNase H deletion mutant and Hpr1 THO complex mutant compared to wild type, suggesting different roles for these proteins in DNA:RNA hybrid biology. Our profiles of DNA:RNA hybrid prone loci provide a resource for understanding the properties of hybrid-forming regions in vivo, extend our knowledge of hybrid-mitigating enzymes, and contribute to models of antisense-mediated gene regulation. A summary of this paper was presented at the 26th International Conference on Yeast Genetics and Molecular Biology, August 2013.


Conflict of interest statement

The authors have declared that no competing interests exist.

Figures

Figure 1
Figure 1. Genome-wide profile of DNA:RNA hybrids in wild type yeast revealed enrichment at rDNA, telomeres, retrotransposons and a subset of genes.
DRIP-chip chromosome plot of DNA:RNA hybrids in the rDNA region and telomeric ends of chromosome XII. The black line represents the average of two wild type replicates. Bars indicate ORFs (grey), rDNA (purple), retrotransposons (green) or genes associated with an antisense transcript (red) [51], [54]). Grey boxes delineate telomeric repeat regions. Y-axis indicates relative occupancy of DNA:RNA hybrids. X-axis indicates chromosomal coordinates. P indicates probability of observing a number of enriched features by random chance below what was observed (P>0.99997).
Figure 2
Figure 2. DNA:RNA hybrids are enriched at protein-encoding genes and retrotransposons of higher transcriptional frequency.
(A) Average gene profile of DNA:RNA hybrids at ORFs enriched for DNA:RNA hybrids under wild type conditions. (B–D) CHROMATRA plots of DNA:RNA hybrid distribution along genes sorted by their length (B), grouped into five transcriptional frequency categories as per [69]) (C) or grouped into four GC content categories (D). Genes were aligned by their TSSs. (E) The average DNA:RNA hybrid score at Ty1, Ty2, Ty3, Ty4 and Ty5 retrotransposons in the left panel shows higher enrichment at Ty1 and Ty2 retrotransposons. The average profile of DNA:RNA hybrids at all retrotransposons under wild type conditions is shown in the right panel.
Figure 3
Figure 3. Genes associated with DNA:RNA hybrids were significantly associated with antisense transcripts.
(A) Antisense association of DNA:RNA hybrid-enriched genes in wild type. The p-value indicates significant enrichment (Fisher's exact test) of antisense-associated genes among DNA:RNA hybrid-enriched genes compared to the Yassour et al. 2010 antisense-annotated dataset ([51]). (B) CHROMATRA plots of DNA:RNA hybrid distribution along genes sorted by their length and separated by whether they are antisense associated or not. Genes were aligned by their TSSs. (C) Average gene profile of DNA:RNA hybrids at genes associated with antisense transcripts. (D) Genes with increased mRNA levels upon RNase H overexpression were significantly associated with antisense transcripts compared to all transcripts represented by the microarray. (E) Antisense-associated DNA:RNA hybrid-enriched genes in wild type have lower transcription frequency compared to non-antisense-associated DNA:RNA hybrid-enriched genes. Genes up-regulated at the transcript level by RNase H overexpression have lower transcription frequency compared to all genes on the expression microarray. Intervals indicate range of the 95% of genes closest to the average in each sample. Averages stated above each bar. P values indicate significant decrease in transcriptional frequency (Wilcoxon rank sum test). (F) Overlap between DNA:RNA hybrid-enriched genes and RNase H-modulated transcripts sorted by antisense association according to the Yassour et al. 2010 database. For genes that are both hybrid-enriched and modulated at the transcript level by RNase H overexpression, the antisense association (100%) is significantly higher (Fisher's exact test p<2.2e−16) than those of the parent datasets (37.4% for DNA:RNA hybrid-enriched genes, 43.9% for RNase H-modulated genes).
Figure 4
Figure 4. Pathways altered at the transcript level by RNase H overexpression.
(A) Gene Ontology term network of genes with increased (left) or decreased (right) mRNA levels upon RNase H overexpression. Representative terms from Supplementary Table S10 are shown. Node size indicates fold enrichment. Node color indicates the number of genes associated with each term (the darkest indicating the greatest number of genes associated). Edge thickness indicates the number of genes shared between terms. (B) 10-fold serial dilutions on BPS iron plates testing low iron concentration sensitivity of wild type versus DNA:RNA hybrid forming mutants reveals a lack of cellular iron requirement in RNase H mutant strains.
Figure 5
Figure 5. DNA:RNA hybrid cytological screen revealed high DNA:RNA hybrid levels in RNA processing and chromatin modification mutants.
Asterisks indicate mutants with significantly increased levels of DNA:RNA hybrids compared to wild type (p<0.00024). Error bars indicate standard error of the mean. Representative chromosome spreads are shown: blue stain is DNA (DAPI) and the red foci are DNA:RNA hybrids.
Figure 6
Figure 6. Genome-wide profiles of DNA:RNA hybrids in revealed similar enrichment of rDNA, retrotransposons and telomeres in wild type and mutants.
DRIP-chip chromosome plot of DNA:RNA hybrids in wild type, rnh1 Δ rnh201 Δ, hpr1 Δ and sen1-1 at chromosome XII. The average of two replicates per strain is shown. Bars indicate ORFs (grey), rDNA (purple), retrotransposons (green) or genes associated with an antisense transcript (red) [51], [54]). Grey boxes delineate telomeric repeat regions. Y-axis indicates relative occupancy of DNA:RNA hybrids. X-axis indicates chromosomal coordinates. P indicates probability of observing a number of enriched features below what was observed (P>0.99997).
Figure 7
Figure 7. Mutant specific trends in protein-coding genes prone to DNA:RNA hybrid formation.
(A–C) CHROMATRA plots of DNA:RNA hybrid distribution along genes sorted by their length (A) grouped into five transcriptional frequency categories as per (B) or grouped into four GC content categories (C). Genes were aligned by their TSSs.
Figure 8
Figure 8. RNase H and Sen1 mutants displayed elevated levels of DNA:RNA hybrids at tRNA and snoRNA genes.
(A) Sample plot of relative DNA:RNA hybrid occupancy at a tRNA gene on chromosome X. For A and D, Colored lines represent the average enrichment of the indicated strains. Purple bars indicate the tRNA or snoRNA genes respectively and gray boxes represent ORFs. (B) Average profile of DNA:RNA hybrids at all tRNAs. (C) Average DNA:RNA hybrid score at each tRNA. (D) Sample plot of relative DNA:RNA hybrid occupancy at a snoRNA gene on chromosome VII. (E) Average profile of DNA:RNA hybrids at all snoRNAs. (F) Average DNA:RNA hybrid score at each snoRNA. P indicates probability of observing a number of enriched features below what was observed (P>0.99997).

References

    1. Chernikova SB, Razorenova OV, Higgins JP, Sishc BJ, Nicolau M, et al. (2012) Deficiency in mammalian histone H2B ubiquitin ligase Bre1 (Rnf20/Rnf40) leads to replication stress and chromosomal instability. Cancer Res 72: 2111–2119. - PMC - PubMed
    1. El Hage A, French SL, Beyer AL, Tollervey D (2010) Loss of topoisomerase I leads to R-loop-mediated transcriptional blocks during ribosomal RNA synthesis. Genes Dev 24: 1546–1558. - PMC - PubMed
    1. Gan W, Guan Z, Liu J, Gui T, Shen K, et al. (2011) R-loop-mediated genomic instability is caused by impairment of replication fork progression. Genes Dev 25: 2041–2056. - PMC - PubMed
    1. Gomez-Gonzalez B, Garcia-Rubio M, Bermejo R, Gaillard H, Shirahige K, et al. (2011) Genome-wide function of THO/TREX in active genes prevents R-loop-dependent replication obstacles. EMBO J 30: 3106–3119. - PMC - PubMed
    1. Mischo HE, Gomez-Gonzalez B, Grzechnik P, Rondon AG, Wei W, et al. (2011) Yeast Sen1 helicase protects the genome from transcription-associated instability. Mol Cell 41: 21–32. - PMC - PubMed

Publication types

MeSH terms