. 2014 Apr 17;10(4):e1004298.
doi: 10.1371/journal.pgen.1004298. eCollection 2014 Apr.

Three groups of transposable elements with contrasting copy number dynamics and host responses in the maize (Zea mays ssp. mays) genome

Affiliations

Three groups of transposable elements with contrasting copy number dynamics and host responses in the maize (Zea mays ssp. mays) genome

Concepcion M Diez et al. PLoS Genet. .

Abstract

Most angiosperm nuclear DNA is repetitive and derived from silenced transposable elements (TEs). TE silencing requires substantial resources from the plant host, including the production of small interfering RNAs (siRNAs). Thus, the interaction between TEs and siRNAs is a critical aspect of both the function and the evolution of plant genomes. Yet the co-evolutionary dynamics between these two entities remain poorly characterized. Here we studied the organization of TEs within the maize (Zea mays ssp mays) genome, documenting that TEs fall within three groups based on the class and copy numbers. These groups included DNA elements, low copy RNA elements and higher copy RNA elements. The three groups varied statistically in characteristics that included length, location, age, siRNA expression and 24:22 nucleotide (nt) siRNA targeting ratios. In addition, the low copy retroelements encompassed a set of TEs that had previously been shown to decrease expression within a 24 nt siRNA biogenesis mutant (mop1). To investigate the evolutionary dynamics of the three groups, we estimated their abundance in two landraces, one with a genome similar in size to that of the maize reference and the other with a 30% larger genome. For all three accessions, we assessed TE abundance as well as 22 nt and 24 nt siRNA content within leaves. The high copy number retroelements are under targeted similarly by siRNAs among accessions, appear to be born of a rapid bust of activity, and may be currently transpositionally dead or limited. In contrast, the lower copy number group of retrolements are targeted more dynamically and have had a long and ongoing history of transposition in the maize genome.


Conflict of interest statement

The authors have declared that no competing interests exist.

Figures

Figure 1
Figure 1. Characteristics of the three groups of TEs in B73, as defined by class and copy number.
a) Histograms of the RPKM of TEs (left) and RNA elements, based on genomic reads. b) The empirical distribution function for DNA TEs (left) and RNA elements (right). The dots represent individual TE subfamilies and the dashed line is a fitted log-normal distribution. The vertical dashed red line is used to define groups R1 and R2. c) Lengths of the exemplar elements in the three groups. d) Characteristics of the three groups for TE, 22 nt siRNA and 24 nt siRNA abundances (RPKM values). e) Characteristics of the three TE groups for the 24 : 22 nt siRNA ratio (left) and a proxy for the number of 22 nt and 24 nt siRNA hits per TE copy (siRNA RPKM : RPKMTE). f) Graphs about the location of TEs based on paired reads: left, the percentage of paired reads in which both reads map to different TE exemplars of the UTE; middle, the proportion of paired reads in which one read maps to the UTE and the other to the FGS; right, the proportion of paired reads in which one of the reads maps to the UTE and the other to the KnobC database. For all boxplots in panels c, d, e and f, the boxes indicate the first quartile (bottom line), the median (central line) and the third quartile (upper line). The whiskers represent the highest and lowest values of the data that are within 1.5 times the interquartile range of the box edges. The outliers are represented by crosses. The lower case letters above the boxes represent significance groupings after a pairwise comparison. Boxplots sharing the same lower case letter are not significantly different at p<0.05.
Figure 2
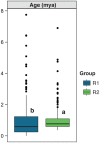
Figure 2. Age of the TE subfamilies included in groups R1 and R2 .
The boxes indicate the first quartile (bottom line), the median (central line) and the third quartile (upper line). The boxes, whiskers and dots for the boxplots are defined in the caption of Figure 1, as are the lower case letters above the boxes.
Figure 3
Figure 3. Expression characteristics of the three TE groups.
a) Overall expression (RPKMRNAseq) and b) expression per TE copy (RPKMRNAseq : RPKMTE) for the three TE groups based on RNAseq data from transition leaves c) Fold-change in TE expression (FCmop) between wild type (wt) and the mop1 mutant for a subset of 340 TEs . d) A plot of FCmop and the 24∶22 nt siRNAs ratio for the same 340 TE subfamilies (dots). The diameter of the dots is proportional to the length of the TE exemplar. The boxes, whiskers and dots for the boxplots are defined in the caption of Figure 1, as are the lower case letters above the boxes.
Figure 4
Figure 4. Pairwise comparisons between accessions for: a) TE hits; b) 22 nt siRNA hits per RPKMTE and c) 24 nt siRNA hits per RPKMTE.
For all the cases the x- and y-axis indicate accessions under comparison (B73, PT or OAXA). Each dot represents a TE subfamily, with the regression (y) and correlations (r2) between accessions indicated. The solid line represents the regression fit, while the dashed line represents the null hypothesis. The color of the dots represents significance: red dots are significant differences between accessions at a FDR of q<0.001, based on the χ2 Corr in panel a and the χ2 Prop for panels b and c. Blue dots are not significant.
Figure 5
Figure 5. Boxplots of Fold Change in genomic reads for TEs (FCTE) within the D, R1 and R2 groups.
The pairwise comparisons between accessions (B73, PT and OAXA) are indicated on the figure. The boxes indicate the first quartile (bottom line), the median (central line) and the third quartile (upper line). The whiskers represent the highest and lowest values of the data that are within 1.5 times the interquartile range of the box edges. The outliers are represented by dots.
Figure 6
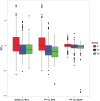
Figure 6. Boxplots of Fold Change in 22(FC22 and FC24) between accessions (B73, PT and OAXA), based on normalization by the upper quartile (Methods).
The meaning of the boxes, whiskers and dots is defined in the legend of the Figure 4.

References

    1. Tenaillon MI, Hollister JD, Gaut BS (2010) A triptych of the evolution of plant transposable elements. Trends Plant Sci 15: 471–478. - PubMed
    1. Leonardo TE, Nuzhdin SV (2002) Intracellular battlegrounds: conflict and cooperation between transposable elements. Genet Res 80: 155–161. - PubMed
    1. Lisch D (2009) Epigenetic regulation of transposable elements in plants. Annu Rev Plant Biol 60: 43–66. - PubMed
    1. Law JA, Jacobsen SE (2010) Establishing, maintaining and modifying DNA methylation patterns in plants and animals. Nat Rev Genet 11: 204–220. - PMC - PubMed
    1. Axtell MJ (2013) Classification and Comparison of Small RNAs from Plants. Annu Rev Plant Biol 64: 137–159. - PubMed

Publication types

MeSH terms