Randomized Controlled Trial
. 2014 Apr 17;10(4):e1004038.
doi: 10.1371/journal.ppat.1004038. eCollection 2014 Apr.

Affinity proteomics reveals elevated muscle proteins in plasma of children with cerebral malaria

Affiliations
Randomized Controlled Trial

Affinity proteomics reveals elevated muscle proteins in plasma of children with cerebral malaria

Julie Bachmann et al. PLoS Pathog. .

Abstract

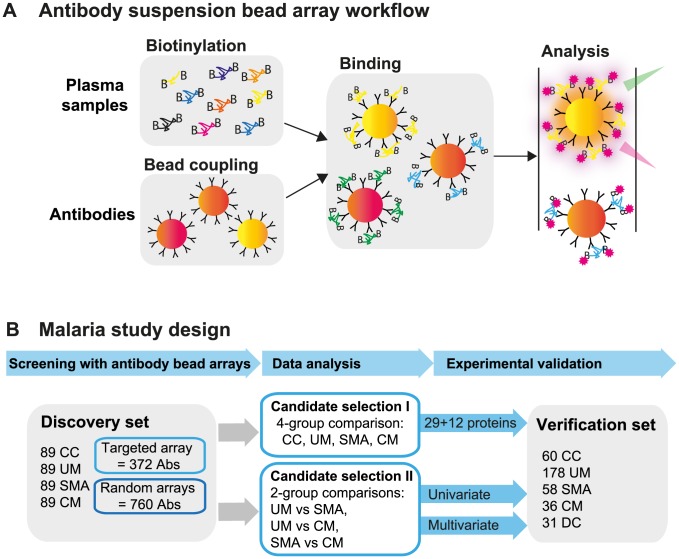
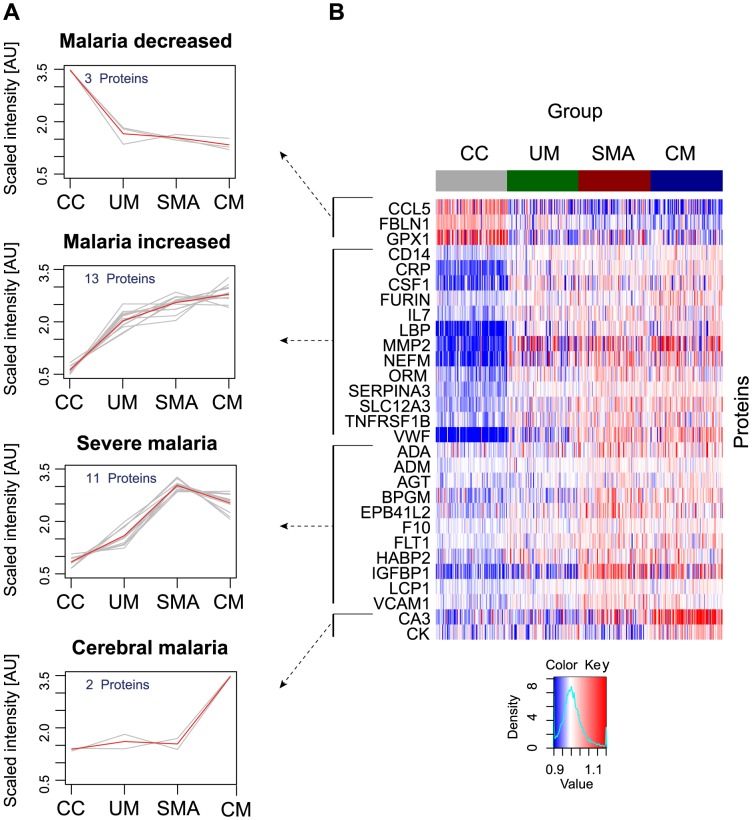
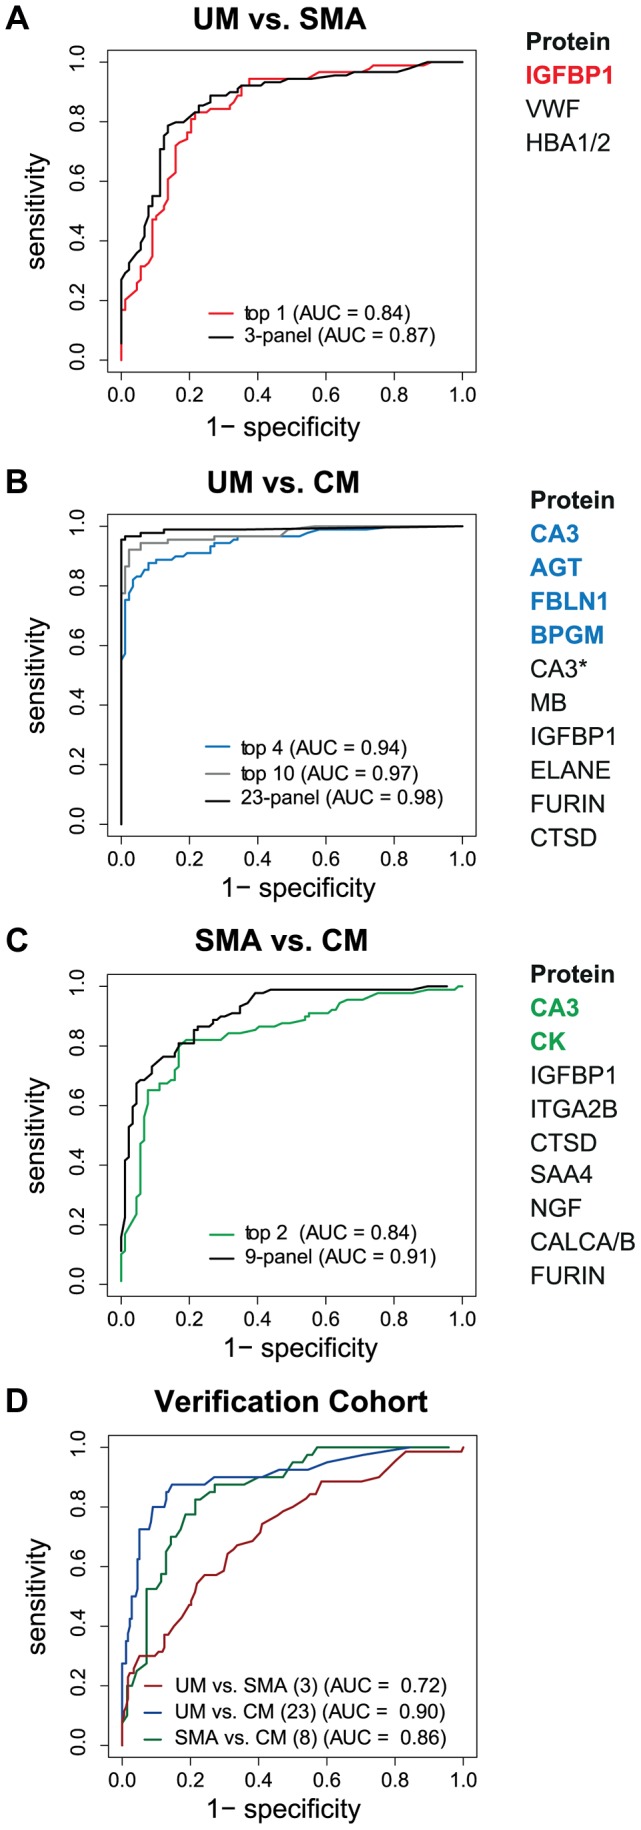
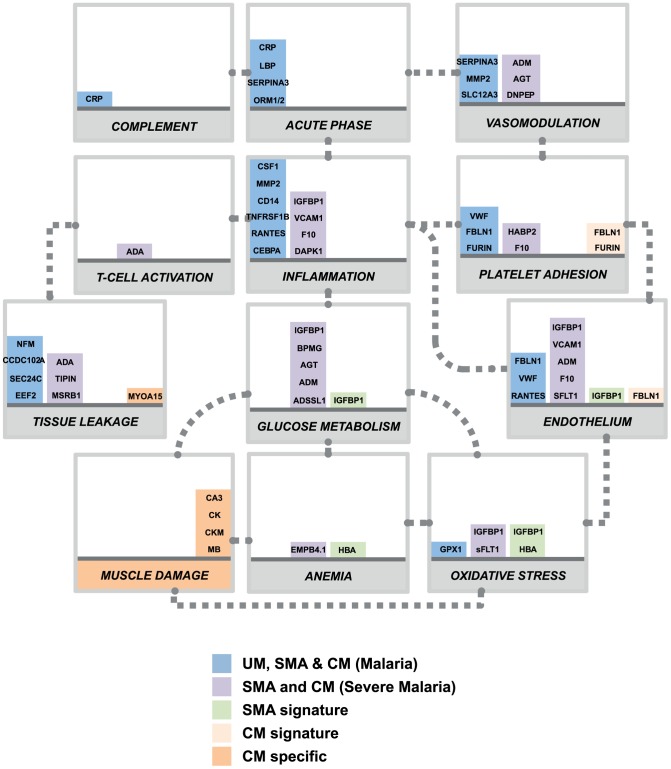
Systemic inflammation and sequestration of parasitized erythrocytes are central processes in the pathophysiology of severe Plasmodium falciparum childhood malaria. However, it is still not understood why some children are more at risks to develop malaria complications than others. To identify human proteins in plasma related to childhood malaria syndromes, multiplex antibody suspension bead arrays were employed. Out of the 1,015 proteins analyzed in plasma from more than 700 children, 41 differed between malaria infected children and community controls, whereas 13 discriminated uncomplicated malaria from severe malaria syndromes. Markers of oxidative stress were found related to severe malaria anemia while markers of endothelial activation, platelet adhesion and muscular damage were identified in relation to children with cerebral malaria. These findings suggest the presence of generalized vascular inflammation, vascular wall modulations, activation of endothelium and unbalanced glucose metabolism in severe malaria. The increased levels of specific muscle proteins in plasma implicate potential muscle damage and microvasculature lesions during the course of cerebral malaria.


Conflict of interest statement

The authors have declared that no competing interests exist.

Figures

Figure 1
Figure 1. Overview of affinity proteomics screening and study design.
(A) Schematic overview of the affinity proteomics approach using antibody suspension bead arrays. Plasma samples were biotinylated, antibodies were coupled to color-coded magnetic beads, and both were combined for analysis. Bead identity and captured plasma proteins were then detected using a flow cytometric analyzer. (B) Experimental design of study. Initial screening with 1,132 antibodies from targeted and blinded selections was performed in the discovery cohort (n = 356). Data from the patient groups were compared using univariate tests and multivariate penalized regression models. Identified single proteins and multi-component protein panels discriminating the 3 disease groups were validated in the verification cohort (n = 363).
Figure 2
Figure 2. Identification of 29 human proteins discriminating community controls and malaria cases.
(A) Applying a non-parametric test, 29 human proteins were identified showing significant (adjusted p<0.001) differences between any of the four groups. Cluster analysis using self-organizing tree algorithm (SOTA) revealed four different clusters with distinct protein profiles designated as ‘malaria decreased’, ‘malaria increased’, ‘severe malaria’ and ‘cerebral malaria’ (see also Fig. S3 in Text S1). (B) Heatmap visualizing protein profiles in individual patients. Samples were organized according to group affiliation and proteins were sorted following SOTA clusters. Displayed are scaled relative intensities of each protein in each group (CC = grey, UM = green, SMA = red, CM = blue).
Figure 3
Figure 3. Discrimination of the three malaria disease sub-types with multi-protein signatures.
L1-penalized logistic regression models were fitted for the three two-group comparisons. The plots show the resulting ROC curves when the model included all selected proteins (black line) and only the top ones (coloured line). The area under the ROC curve (AUC) for the optimal number of proteins and the combination with the smallest number of proteins after variable selection refinement is presented adjacent to the plots. (A) For classification of UM vs SMA a 3-protein signature provided an optimal result (AUC = 0.87) (black line). (B) For classification of UM vs CM a protein signature with 23 proteins showed the best result (black line). As comparison, the AUC of the top 4 proteins (blue line) and top 10 proteins (grey line) after step-by-step removal of selected proteins is shown. CA3 = HPA021775, CA3* = HPA026700. (C) For classification of SMA vs CM a protein signature with 9 proteins showed the best result (black line). As comparison, the AUC of the top 2 proteins after step-by-step removal of selected proteins is shown (green line). (D) ROC curves for the three subgroup comparisons using their respective best protein signatures in the verification cohort, UM vs SMA (red line), UM vs CM (blue line) and SMA vs CM (green line). SAA4 was excluded from verification due to technical failure.
Figure 4
Figure 4. Overview of panels of proteins and their physiological pathways predicting the different malaria clusters.
Proteins with differential profiles between the malaria groups were classified into physiological pathways. This included proteins identified common to all malaria groups (blue bars), common to both defined severe malaria syndromes (purple bars), proteins with levels elevated in SMA (light green bars), proteins with levels elevated in CM (light orange bars) and proteins specific to CM (dark orange bars). For each panel, columns were stacked by number of proteins identified in each category. Grey dotted connectors represent either a regulation link or a common protein component between to physiological pathways. UM: uncomplicated malaria; SMA: severe malaria anemia; CM: cerebral malaria. Proteins are represented by their gene names (Refer to Table 2, Fig. S3 and Table S2 in Text S1 for full names).

References

    1. World Health Organization (WHO). (2010). World Malaria Report 2010. Available: http://www.who.int/malaria/world_malaria_report_2010/en/. Last accessed 5th Mar 2014.
    1. Amzat J (2011) Assessing the progress of malaria control in Nigeria. World Health Popul 12: 42–51. - PubMed
    1. Ponsford MJ, Medana IM, Prapansilp P, Hien TT, Lee SJ, et al. (2012) Sequestration and microvascular congestion are associated with coma in human cerebral malaria. J Infect Dis 205: 663–671. - PMC - PubMed
    1. Friedman MJ (1983) Control of malaria virulence by alpha 1-acid glycoprotein (orosomucoid), an acute-phase (inflammatory) reactant. Proc Natl Acad Sci U S A 80: 5421–5424. - PMC - PubMed
    1. Nussler A, Pied S, Pontet M, Miltgen F, Renia L, et al. (1991) Inflammatory status and preerythrocytic stages of malaria: role of the C-reactive protein. Exp Parasitol 72: 1–7. - PubMed

Publication types

LinkOut - more resources