. 2014 Apr 17;9(4):e91711.
doi: 10.1371/journal.pone.0091711. eCollection 2014.

Beyond race and place: distal sociological determinants of HIV disparities

Affiliations

Beyond race and place: distal sociological determinants of HIV disparities

Max-Louis G Buot et al. PLoS One. .

Abstract

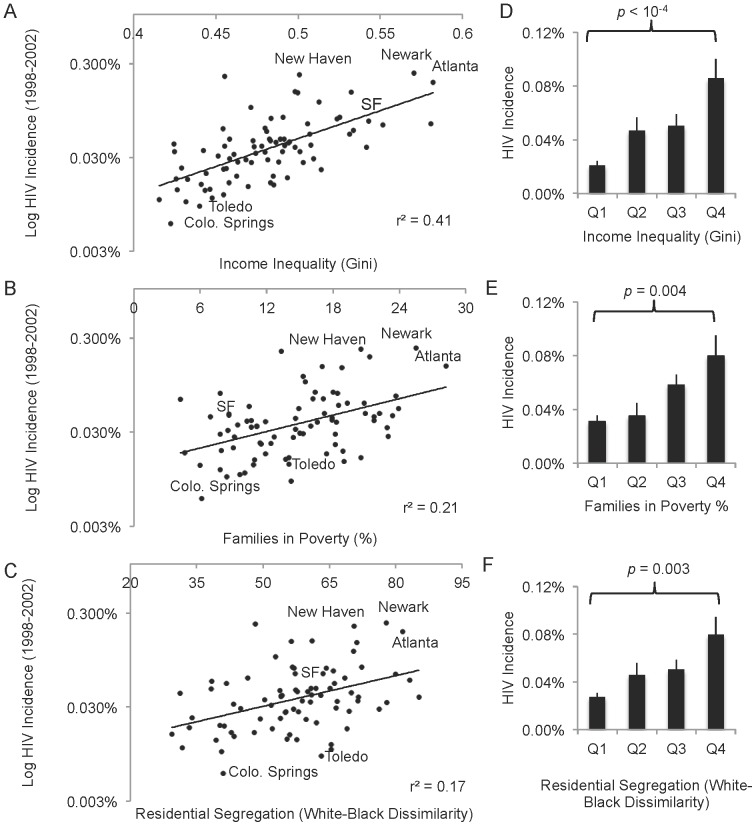
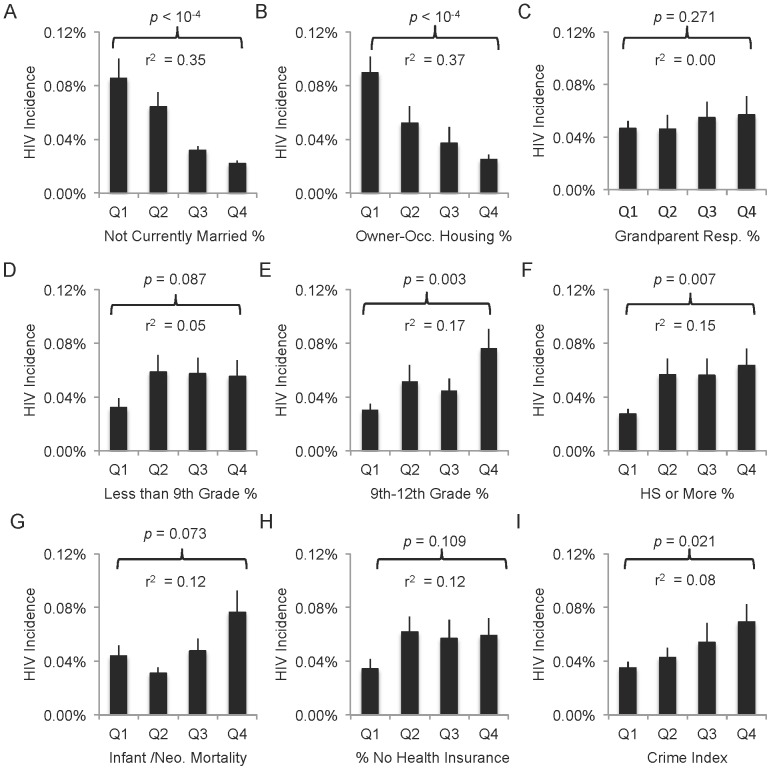
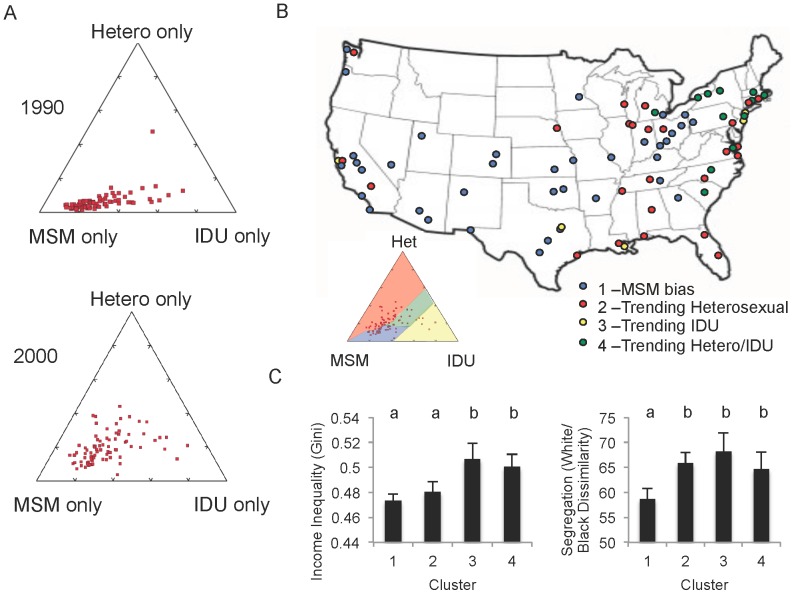
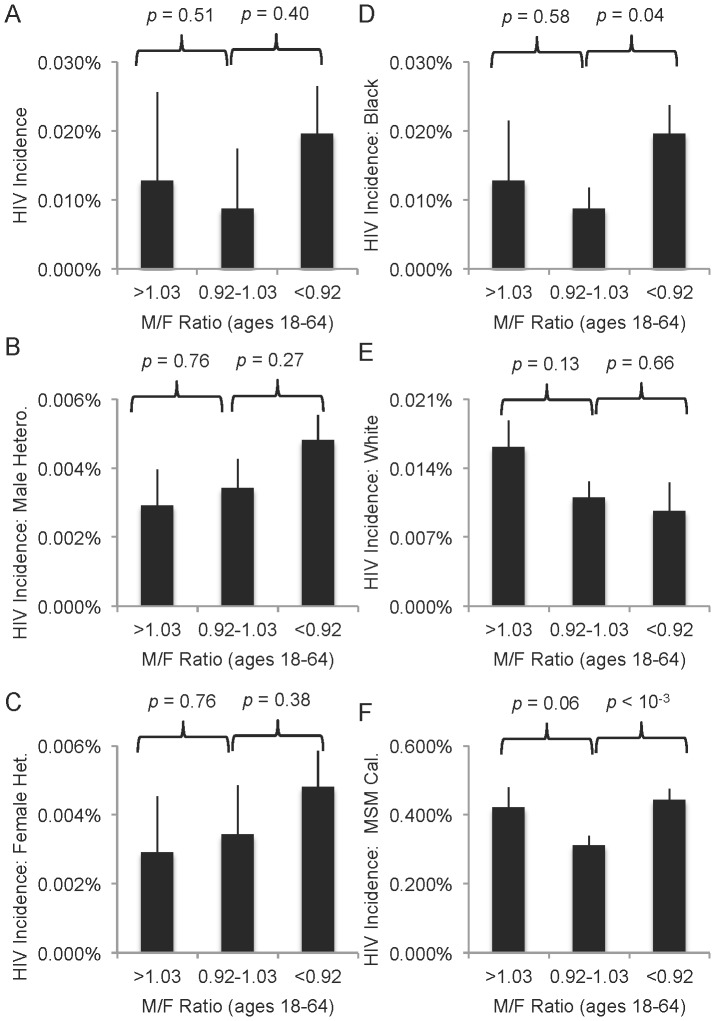
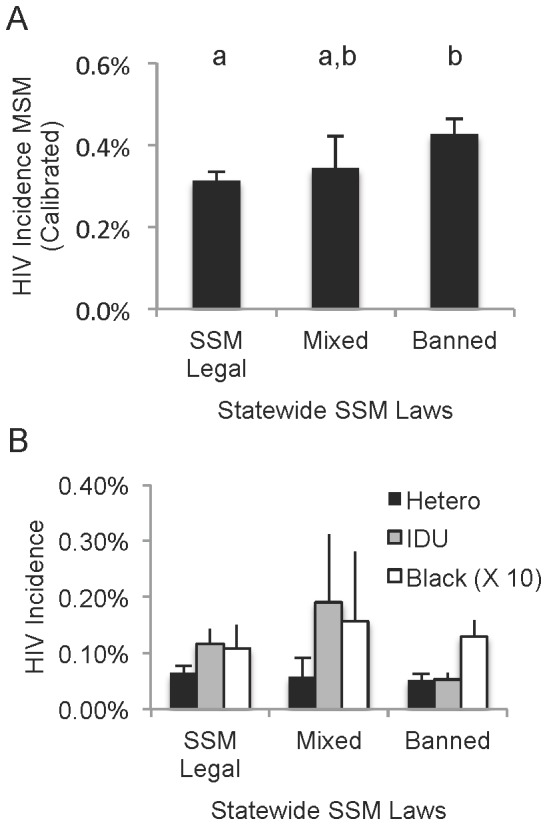
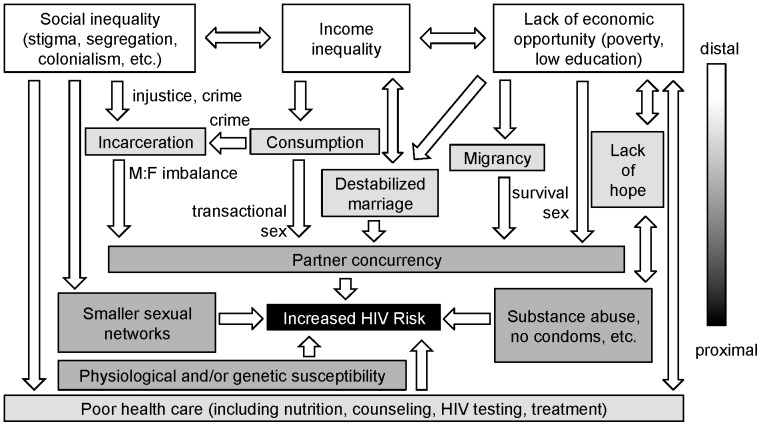
Informed behavior change as an HIV prevention tool has yielded unequal successes across populations. Despite decades of HIV education, some individuals remain at high risk. The mainstream media often portrays these risk factors as products of race and national borders; however, a rich body of recent literature proposes a host of complex social factors that influence behavior, including, but not limited to: poverty, income inequality, stigmatizing social institutions and health care access. We examined the relationship between numerous social indicators and HIV incidence across eighty large U.S. cities in 1990 and 2000. During this time, major correlating factors included income inequality, poverty, educational attainment, residential segregation and marriage rates. However, these ecological factors were weighted differentially across risk groups (e.g. heterosexual, intravenous drug use, men who have sex with men (MSM)). Heterosexual risk rose significantly with poor economic indicators, while MSM risk depended more heavily on anti-homosexual stigma (as measured by same-sex marriage laws). HIV incidence among black individuals correlated significantly with numerous economic factors but also with segregation and imbalances in the male:female ratio (often an effect of mass incarceration). Our results support an overall model of HIV ecology where poverty, income inequality and social inequality (in the form of institutionalized racism and anti-homosexual stigma) have over time developed into synergistic drivers of disease transmission in the U.S., inhibiting information-based prevention efforts. The relative weights of these distal factors vary over time and by HIV risk group. Our testable model may be more generally applicable within the U.S. and beyond.


Conflict of interest statement

Competing Interests: The authors have declared that no competing interests exist.

Figures

Figure 1
Figure 1. Income inequality, segregation and poverty positively and synergistically correlate with 1998-2002 HIV incidence across 80 U.S. cities.
A–C. The total reported HIV incidence in 80 large U.S. cities as a function of: (A) income inequality (represented as the Gini coefficient, where higher values correspond to greater inequality); (B) poverty, and (C) black-white dissimilarity index, a measure of black-white segregation where 0 is completely integrated and 100 completely segregated; and. Cities high in all three social determinants tend to be significantly higher in HIV incidence and vice versa (SF = San Francisco). D–F. Cities were sorted by (D) income inequality, (E) poverty or (F) black-white segregation, and the HIV incidence averaged over quartiles, where Q1 represents the average HIV incidence for the 20 cities with the highest income inequality and Q4 the average HIV incidence in the 20 cities with the lowest income inequality. T-test comparison of the HIV values in first and fourth quarters illustrates these populations are statistically distinct (see Table 1). Bars = SEM.
Figure 2
Figure 2. Examples of possible degrees of population-level HIV/socioeconomic associations.
Cities were sorted by various 2000 population metrics (x-axes), and the HIV incidence averaged over quartiles, where Q1 represents the average HIV incidence for the 20 cities with the highest values for that census metric and Q4 the average HIV incidence in the 20 cities with the lowest values for that census metric. T-test comparison of the HIV values in first and fourth quarters illustrates that many metrics are associated with HIV incidence (A, B, E, F, I), while others weakly associate (D, G, H) and still others are not likely to be associated (C). Bars = SEM.
Figure 3
Figure 3. Proportion of HIV reports in each city with exposure risk of male-male sexual contact (MSM), heterosexual contact (Het.) or IV drug use (IDU).
(Multiple or unknown exposure categories excluded.) A. Principle component analysis for HIV cases 1988–1992 (top) and 1998–2002 (bottom) shows an overall national trend away from MSM and toward heterosexual and/or IDU exposures. B. Cities clustered based on exposure trends. MSM-biased cluster (blue) is approximately delimited by the 1990 MSM region of the PCA plot. C. Average socioeconomic metrics were sorted with exposure clusters. More segregated cities (measured by white/black dissimilarity index) were significantly more likely to experience a higher proportion of non-MSM HIV cases. Cities with high income inequality were more likely to report a higher proportion of IDU-associated HIV. Lowercase letters represent statistical similarity (by T-test, p<0.05).
Figure 4
Figure 4. Association of HIV and skewed male:female ratios supports effect of such ratios on partner concurrency.
M:F ratios were calculated as the total number of male individuals aged 18–64 divided by the total number of female individuals aged 18–64 for each city. Groups were established as deviating >0.05 from the mean M:F ratio (0.97) and p values are for T-tests between extremes (n = 24 for <0.92 and 13 for >1.03) and mid-range (n = 43). A. Total reported HIV incidence per city varies by M:F ratio, but not significantly. B–C. HIV incidence reports amongst (B) males and (C) females exposed by heterosexual contact. D–E. HIV incidence among (D) black or (E) white individuals. F. HIV incidence reports by MSM exposure only, as a percentage of estimated number of GLB individuals per city. Bars = SEM.
Figure 5
Figure 5. Stigmatization of homosexual behavior (as measured by statewide laws on same sex marriage (SSM)) correlates with increased MSM HIV incidence.
Cities were assigned stigma categories based on their state's position on SSM as of July, 2013. States with legal marriage include 22 cities. States with civil unions, enumerated privilege (with or without constitutional SSM bans) or no relevant laws classified as “mixed” (n = 9 cities). States with legislative or constitutional SSM bans (n = 48 cities) were classified as “banned.” A. MSM HIV incidence rates represent total HIV reports by single MSM exposure divided by the estimated total GLB individuals per city (from Gates, 2006). Lowercase letters indicate statistically similar populations (by T-test, p>0.05). B. No pattern or significant difference was found in any other group (shown: HIV incidence by heterosexual or IDU exposure, and black individuals). Bars = SEM.
Figure 6
Figure 6. A general model of late-stage epidemic risk.
The strongest population-level associations between HIV and social environment, in our studies and other studies, can be reduced to three distinct but interrelated social determinants: social inequality, income income inequality and poverty. These generate a loss of social cohesion as sexual relationships destabilize due to rising material expectations, an inability to meet material needs, gender imbalances and increased expectations for long-term commitment. All of these increase the frequency of concurrent partners. Social inequality restricts sexual networks, increasing the effect of HIV-positive individuals in those networks. Both poverty and inequality decrease access to health care, compromising prevention. Diminished expectations for the future, a common effect of poverty, makes individuals more resistant to the message of behavior change. Finally, the route of transmission matters, with shared needles, anal sex and receptive partners carrying more physiological risk. Differences in genetic susceptibility, little studied, also likely contribute to risk. Individuals experience more risk as the number of biological and sociological determinants they experience increases. Arrows here may be more interconnected than this diagram assumes; however it provides a testable model.

References

    1. UNAIDS (2007) Practical guidelines for intensifying HIV prevention: towards universal access. In: HIV/AIDS. JUNPo, editor. Geneva: UNAIDS.
    1. Centers for Disease Control and Prevention (2013) HIV/AIDS Surveillance Report Vol. 23.
    1. Mosher WD, Chandra A, Jones J (2005) Sexual behavior and selected health measures: men and women 15–44 years of age, United States, 2002. Advance data 1–55. - PubMed
    1. Hallfors DD, Iritani BJ, Miller WC, Bauer DJ (2007) Sexual and drug behavior patterns and HIV and STD racial disparities: the need for new directions. American journal of public health 97: 125–132. - PMC - PubMed
    1. Harawa NT, Greenland S, Cochran SD, Cunningham WE, Visscher B (2003) Do differences in relationship and partner attributes explain disparities in sexually transmitted disease among young white and black women? The Journal of adolescent health : official publication of the Society for Adolescent Medicine 32: 187–191. - PubMed

Publication types

MeSH terms