. 2014 Apr 17;5(4):e1176.
doi: 10.1038/cddis.2014.153.

Sublytic C5b-9 triggers glomerular mesangial cell apoptosis via XAF1 gene activation mediated by p300-dependent IRF-1 acetylation

Affiliations

Sublytic C5b-9 triggers glomerular mesangial cell apoptosis via XAF1 gene activation mediated by p300-dependent IRF-1 acetylation

W Qiu et al. Cell Death Dis. .

Abstract

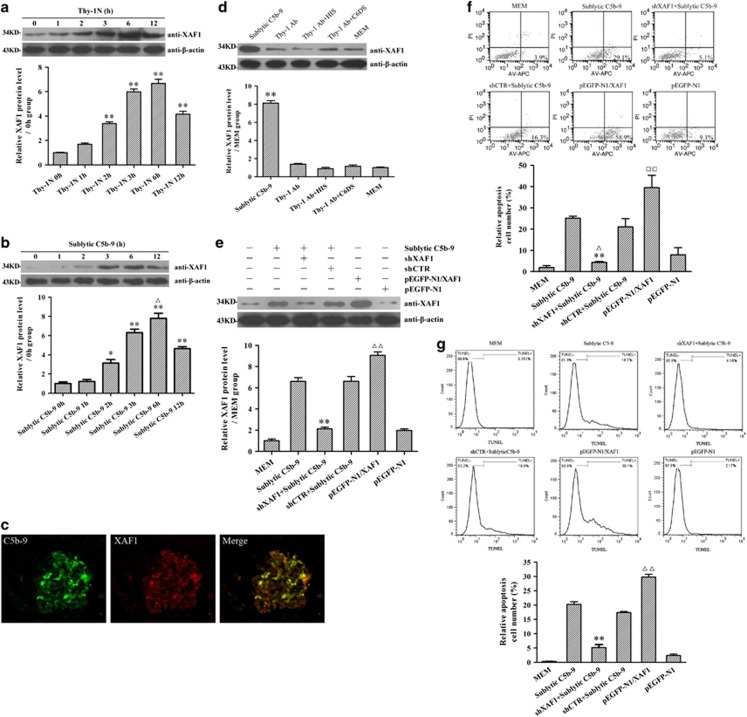
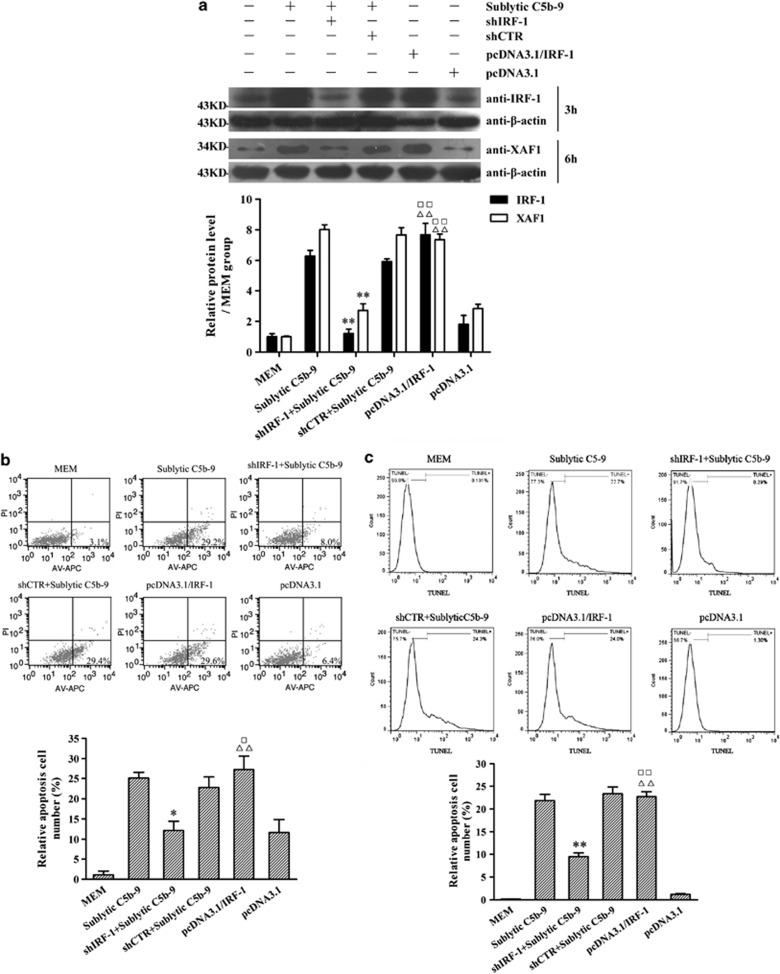
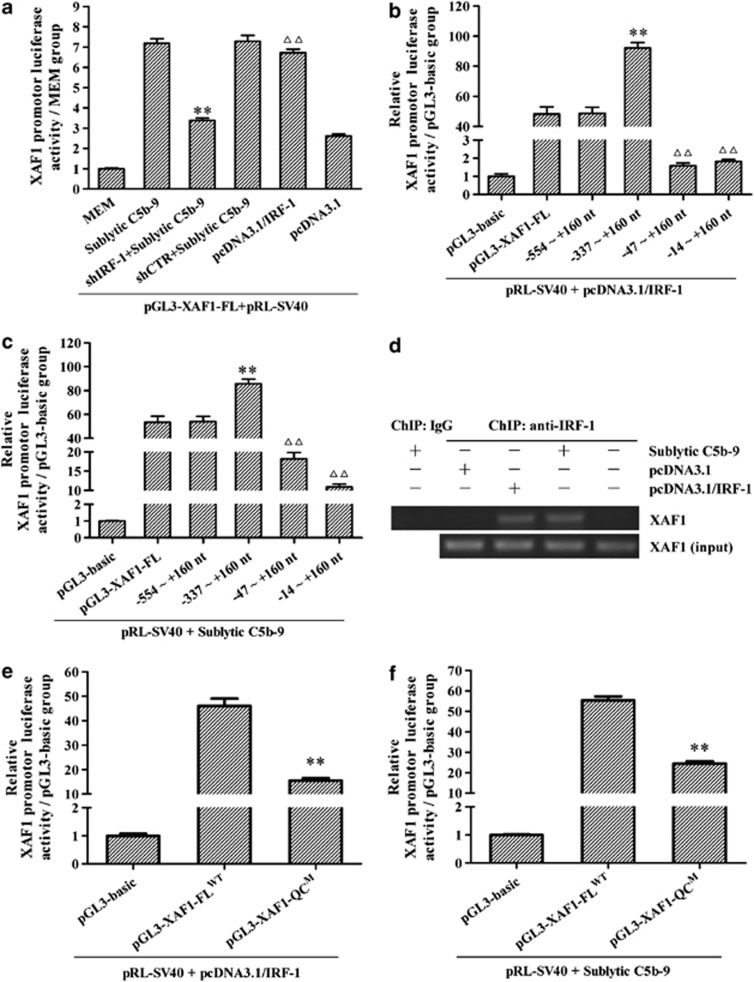
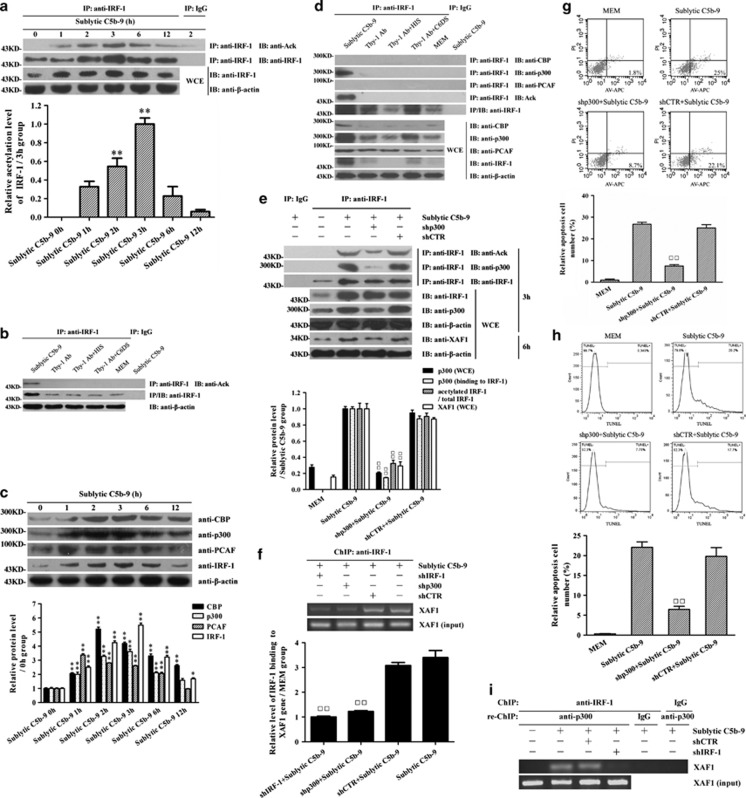
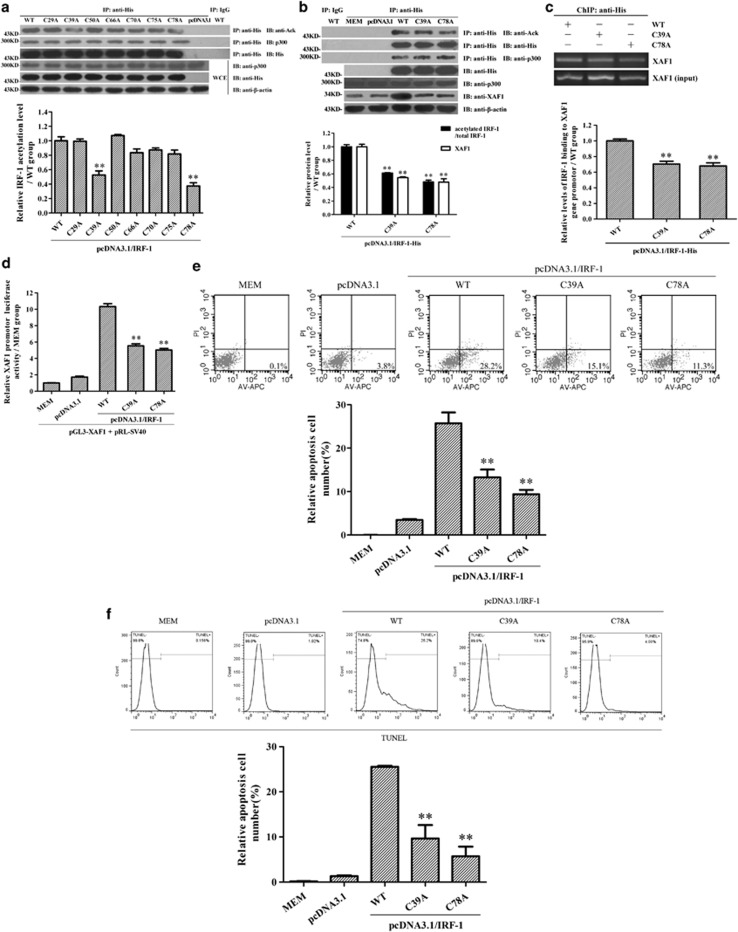
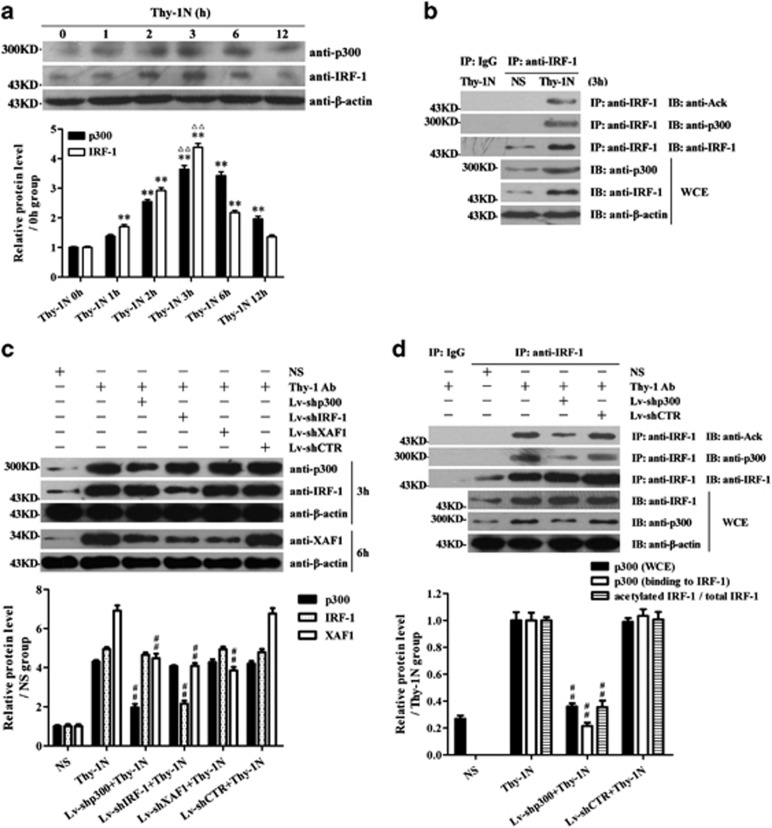
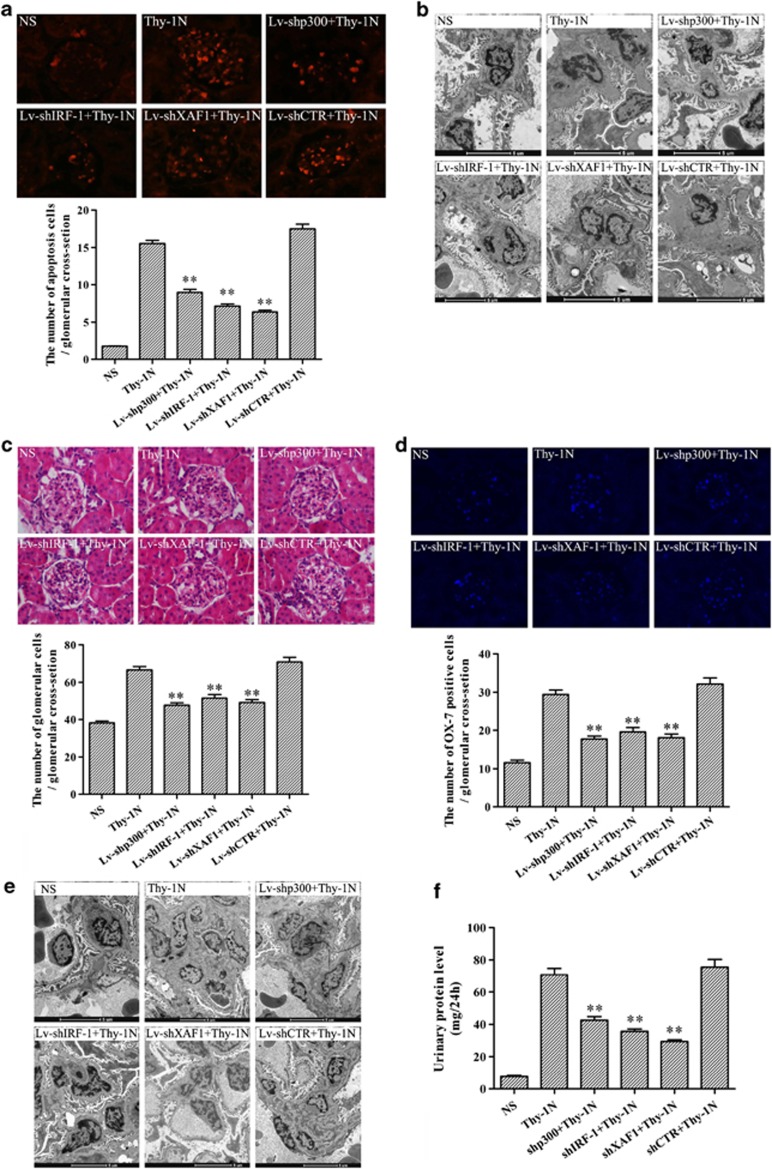
The apoptosis of glomerular mesangial cells (GMCs) in rat Thy-1 nephritis (Thy-1N), a model of human mesangioproliferative glomerulonephritis (MsPGN), is accompanied by sublytic C5b-9 deposition. However, the mechanism by which sublytic C5b-9 induces GMC apoptosis is unclear. In the present studies, the effect of X-linked inhibitor of apoptosis-associated factor 1 (XAF1) expression on GMC apoptosis and the role of p300 and interferon regulatory factor-1 (IRF-1) in mediating XAF1 gene activation were determined, both in the GMCs induced by sublytic C5b-9 (in vitro) and in the renal tissues of rats with Thy-1N (in vivo). The in vitro studies demonstrated that IRF-1-enhanced XAF1 gene activation and its regulation by p300-mediated IRF-1 acetylation were involved in GMC apoptosis induced by sublytic C5b-9. The element of IRF-1 binding to XAF1 promoter and two acetylated sites of IRF-1 protein were also revealed. In vivo, silence of p300, IRF-1 or XAF1 genes in the renal tissues diminished GMC apoptosis and secondary GMC proliferation as well as urinary protein secretion in Thy-1N rats. Together, these data implicate that sublytic C5b-9 induces the expression of both p300 and IRF-1, as well as p300-dependent IRF-1 acetylation that may contribute to XAF1 gene activation and subsequent GMC apoptosis in Thy-1N rats.


Figures

Figure 1
Figure 1
The expression and role of XAF1 in both renal tissues of rats with Thy-1N and GMCs exposed to sublytic C5b-9. (a) The level of XAF1 in the renal tissues of Thy-1N rats at varying time points was detected by IB analysis (n=6 in each time point). **P<0.01 versus 0 h group (nontreated). (b) Rat GMCs were treated with sublytic C5b-9 (5% Thy-1 Ab+4% NHS) for the different time points, and then the level of XAF1 in the GMCs was determined by IB assay (n=3 in each time point). *P<0.05, **P<0.01 versus 0 h group (nontreated); ΔP<0.05 versus other time points. (c) C5b-9 complex deposits (green) and XAF1 expression (red) in the glomeruli of Thy-1N rats at 6 h were detected by immunofluorescence staining. (d) GMCs were cultured for 6 h in dissimilar medium, namely, sublytic C5b-9 (5% Thy-1 Ab+4% NHS), 5% Thy-1 Ab, 5% Thy-1 Ab+4% HIS, 5% Thy-1 Ab+4% C6DS and MEM. XAF1 expression was then determined by IB analysis (n=3 in every group). **P<0.01 versus Thy-1 Ab, Thy-1 Ab+HIS, Thy-1 Ab+C6DS and MEM group. (e–g) GMCs were divided into the following six groups: (1) MEM, (2) sublytic C5b-9, (3) shXAF1+sublytic C5b-9, (4) shCTR+ sublytic C5b-9, (5) pEGFP-N1/XAF1 and (6) pEGFP-N1. (e) IB assay was used to detect XAF1 expression in different groups of GMC at 6 h after sublytic C5b-9 stimulation (n=3 in each group). **P<0.01 versus sublytic C5b-9 group and shCTR+ sublytic C5b-9 group; ΔΔP<0.01 versus MEM group and pEGFP-N1 group. (f) Both annexin V-APC and propidium iodide were used to label the cells in the above-mentioned groups at 6 h after sublytic C5b-9 stimulation. Flow cytometry analysis was performed to detect the numbers of annexin V-positive GMC (n=3 in each group). **P<0.01 versus sublytic C5b-9 group; ΔP<0.05 versus shCTR+ sublytic C5b-9 group; □□P<0.01 versus MEM group and pEGFP-N1 group. (g) TUNEL staining (TMR-labeled) was used to label the apoptotic cells in the above-mentioned groups at 6 h after sublytic C5b-9 stimulation. Flow cytometry analysis was performed to detect the numbers of TUNEL-positive GMCs (n=3 in each group). **P<0.01 versus sublytic C5b-9 group and shCTR+ sublytic C5b-9 group; ΔΔP<0.01 versus MEM group and pEGFP-N1 group. The data are from one experiment, representative of three independent experiments. Results were represented as means±S.E. Representative photographs were manifested
Figure 2
Figure 2
The roles of IRF-1 protein expression in XAF1 gene expression and GMC apoptosis upon sublytic C5b-9 attack. GMCs were divided into six groups of (1) MEM, (2) sublytic C5b-9, (3) shIRF-1+sublytic C5b-9, (4) shCTR+sublytic C5b-9, (5) pcDNA3.1/IRF-1 and (6) pcDNA3.1. (a) The expression of IRF-1 and XAF1 in GMCs at 3 and 6 h, respectively, after sublytic C5b-9 stimulation was detected by using IB assay. (b) Both annexin V-APC and propidium iodide were used to label the cells at 6 h after sublytic C5b-9 stimulation. The number of annexin V-positive GMCs was found by using flow cytometry analysis. (c) TUNEL staining (TMR-labeled) was used to label the apoptotic cells in different groups at 6 h after sublytic C5b-9 stimulation. Flow cytometry analysis was performed to detect the numbers of TUNEL-positive GMCs (n=3 in each group). The data are from one experiment, representative of three independent experiments. Results were represented as means±S.E. (n=3 in each group). Representative photographs were manifested. *P<0.05, **P<0.01 versus sublytic C5b-9 group and shCTR+ sublytic C5b-9 group; ΔΔP<0.01 versus MEM group; P<0.05, □□P<0.01 versus pcDNA3.1 group
Figure 3
Figure 3
The effects of IRF-1 expression on the activity of XAF1 gene promoter in the GMCs exposed to sublytic C5b-9. (a) XAF1 promotor activity in different groups of GMC at 6 h after sublytic C5b-9 stimulation was determined by luciferase analysis. **P<0.01 versus sublytic C5b-9 group and shCTR+ sublytic C5b-9 group; ΔΔP<0.01 versus MEM group and pcDNA3.1 group. (b and c) The GMCs were transfected with the luciferase reporter constructs containing the 1.65-kb XAF1 promoter (−1496 to +160 nt) or different promoter deletion fragments (−554 to +160, −337 to +160, −47 to +160 and −14 to +160 nt) accompanied with pcDNA3.1/IRF-1 for 48 h (b) or sublytic C5b-9 stimulation for 6 h (c), and the activity of XAF1 promoter was determined subsequently. **P<0.01 versus pGL3-XAF1-FL group; ΔΔP<0.01 versus pGL3-XAF1-FL group, pGL3-XAF1 (−554 to +160 nt) group and pGL3-XAF1 (−337 to +160 nt) group. (d) ChIP assay was performed using the anti-IRF-1 Ab and preimmune IgG respectively, and immunoprecipitated DNA was amplified using one pair of primers for the proximal promoter region (−169 to −19 nt) of the XAF1 gene subsequently. Representative photographs were manifested. (e and f) Luciferase analysis was performed to determine the effects of XAF1 promotor mutation (−65 to −53 nt region) on the transcription activity of pGL3-XAF1 induced by both IRF-1 overexpression (48 h) and sublytic C5b-9 stimulation (6 h). **P<0.01 versus pGL3-XAF1-FLWT group. The data are from one experiment, representative of three independent experiments. Results were represented as means±S.E. (n=3 in each group)
Figure 4
Figure 4
The effects of p300 on IRF-1 expression, XAF1 gene activation and GMC apoptosis exposed to sublytic C5b-9. (a) Rat GMCs were treated with sublytic C5b-9 for the fixed time, and then the Abs against IRF-1 and preimmune IgG were used to perform IP respectively. Subsequently, the content of IRF-1 and acetylated lysine in the complexes was determined by IB assay. Meanwhile, the expression of β-actin and IRF-1 in WCE was detected by IB assay. (b) GMCs were cultured for 3 h in dissimilar medium, namely, sublytic C5b-9 (5% Thy-1 Ab+4% NHS), 5% Thy-1 Ab, 5% Thy-1 Ab+4% HIS, 5% Thy-1 Ab+4% C6DS and MEM. The Abs against IRF-1 and preimmune IgG were used to perform IP respectively and then the content of IRF-1 and acetylated lysine in the complexes was measured by IB assay. Meanwhile, the expression of β-actin in WCE was detected by IB assay. (c) Rat GMCs were treated with sublytic C5b-9 for the indicated times, and then the levels of CBP, p300 and PCAF were determined by IB. (d) GMCs were cultured for 3 h in the above-mentioned five groups. The Abs against IRF-1 and preimmune IgG were used to perform co-IP respectively, and then the content of CBP, p300 and PCAF in the complexes was examined by IB assay. Meanwhile, the expression of corresponding protein in WCE was detected by IB assay. (e) The Abs against IRF-1 and preimmune IgG were used to perform co-IP respectively, and then the content of IRF-1, p300 and acetylated lysine in the complexes was detected by IB assay at 3 and 6 h, respectively, after sublytic C5b-9 stimulation. Meanwhile, the expression of corresponding protein in WCE was detected by IB assay. (f) ChIP assay was performed using the anti-IRF-1 Ab, and immunoprecipitated DNA was amplified using a pair of primers for the proximal promoter region (−169 to −19 nt) of the XAF1 gene subsequently. (g) Both annexin V–APC and propidium iodide were used to label the GMC in different groups at 6 h after sublytic C5b-9 stimulation. Flow cytometry analysis was performed to detect the numbers of annexin V-positive GMCs. (h) TUNEL staining (TMR-labeled) was used to label the cells in different groups at 6 h after sublytic C5b-9 stimulation. Flow cytometry analysis was performed to detect the numbers of TUNEL-positive GMCs. (i) A ChIP assay was performed by using the Ab against IRF-1 and preimmune IgG, respectively, and subsequently a re-ChIP assay was performed by using the Ab against p300 and preimmune IgG, respectively. Immunoprecipitated DNA was then amplified by using a pair of primers for the proximal promotor region (−169 to −19 nt) of the XAF1 gene. The results were normalized to input. The data are from one experiment, representative of three independent experiments or four independent experiments (c). Results were represented as means±S.E. (n=3 in each group). Representative photographs were manifested. *P<0.05, **P<0.01 versus 0 h group (nontreated); □□P<0.01 versus sublytic C5b-9 group and shCTR+sublytic C5b-9 group
Figure 5
Figure 5
The identification of IRF-1 acetylation sites. To find the IRF-1 acetylation sites, N-terminal Lys-29, Lys-39, Lys-50, Lys-66, Lys-70, Lys-75 and Lys-78 of IRF-1 were mutated respectively, and the IRF-1 acetylation and XAF1 expression and GMC apoptosis were measured subsequently. (a and b) Rat GMCs were divided into different groups, and then the Abs against IRF-1 and preimmune IgG were used to perform IP respectively. Subsequently, the content of IRF-1 and acetylated lysine in the complexes was determined by IB assay. Meanwhile, the expression of corresponding protein in WCE was detected by IB assay. (c) The three plasmids of pcDNA3.1/IRF-1(WT)-His, pcDNA3.1/IRF-1(C39A)-His and pcDNA3.1/IRF-1(C78A)-His were transfected into GMCs for 48 h respectively. A ChIP assay was performed by using anti-His antibodies, and immunoprecipitated DNA was amplified by using a pair of primers for the proximal promotor region (−169 to −19 nt) of the XAF1 gene subsequently. The results were normalized to input. (d–f) Luciferase and flow cytometry analysis were performed to detect the effects of IRF-1 mutation (Lys-39 and Lys-78) on the XAF1 gene promotor activity (d) and GMC apoptosis (e, annexin V–APC and propidium iodide; f, TUNEL staining, TMR-labeled). The data are from one experiment, representative of three independent experiments. Results were represented as means±S.E. (n=3 in each group). Representative photographs were manifested. **P<0.01 versus wild-type IRF-1 overexpression group
Figure 6
Figure 6
The expression and interaction of p300, IRF-1 and XAF1 in the renal tissues of Thy-1N rats. (a) The levels of p300 and IRF-1 in the renal tissues of Thy-1N rats at varying time points were measured by IB analysis. (b) The level of IRF-1 acetylation as well as the combination of p300 and IRF-1 in the renal tissues of Thy-1N rats and NS control rats at 3 h were detected by co-IP assay. Lysates of renal tissues were used to perform co-IP by the anti-IRF-1 Ab to pull down endogenous IRF-1 (preimmune IgG as a control reaction), and then perform IB experiment for examining p300, IRF-1 and acetylated lysine expression. Meanwhile, the expression of β-actin, IRF-1 and p300 in WCE was detected by IB assay. (c) SD rats were divided into six groups, namely: (1) NS, (2) Thy-1N, (3) Lv-shp300+Thy-1N, (4) Lv-shIRF-1+Thy-1N, (5) Lv-shXAF1+Thy-1N and (6) Lv-shCTR+Thy-1N. The expression of p300, IRF-1 and XAF1 in the renal tissues of Thy-1N rats at 3 and 6 h, respectively, were examined by IB assay. (d) SD rats were divided into four groups, namely: (1) NS, (2) Thy-1N, (3) Lv-shp300+Thy-1N and (4) Lv-shCTR+Thy-1N. Lysates of renal tissues at 3 h after nephritis induction were used to perform co-IP by the anti-IRF-1 Ab to pull down endogenous IRF-1 (preimmune IgG as a control reaction), and then perform IB experiment for p300, IRF-1 and acetylated lysine expression. Meanwhile, the expression of β-actin, IRF-1 and p300 in WCE was detected by IB assay. The data are from one experiment, representative of three independent experiments. Data are means±S.E. (n=6 in each time point every group or n=6 in each group). The representative IB photographs are displayed. ** P<0.01 versus 0 h group (nontreated); ΔΔP<0.01 versus other time points; ##P<0.01 versus Thy-1N group and Lv-shCTR+Thy-1N group
Figure 7
Figure 7
Effects of p300, IRF-1 and XAF1 gene knockdown on the pathological changes in the renal tissues of Thy-1N rats. SD rats were divided into six groups, namely: (1) NS, (2) Thy-1N, (3) Lv-shp300+Thy-1N, (4) Lv-shIRF-1+Thy-1N, (5) Lv-shXAF1+Thy-1N and (6) Lv-shCTR+Thy-1N. (a) TUNEL staining (frozen sections, original magnification: × 400) was used to show the number of apoptosis cells in the six groups at 6 h after nephritis induction. (b) The ultrastructural changes at 6 h including the irregular aggregation of chromatin in the periphery of the nucleus and clear condensation of the nuclear chromatin were detected by EM. (c) The total number of glomerular cells in the 6 groups on day 7 after the nephritis induction was examined by HE staining (paraffin-embedded sections, original magnification: × 400). (d) IF staining (frozen sections, original magnification: × 400) for Thy-1 antigen (indicating GMC number) obtained similar results as HE staining. (e) EM was used to observe the ultrastructural changes including the number of GMC and the secretion of ECM in the six groups on day 7 after nephritis induction. (f) The amount of urinary protein (mg per 24 h) of rats in the six groups was detected on day 7. The data are from one experiment, representative of two independent experiments. Data are means±S.E. (n=6–8 per group). Representative photographs were manifested. **P<0.01 versus Thy-1N group and Lv-shCTR+Thy-1N group

References

    1. Tumlin JA, Madaio MP, Hennigar R. Idiopathic IgA nephropathy: pathogenesis, histopathology, and therapeutic options. Clin J Am Soc Nephrol. 2007;2:1054–1061. - PubMed
    1. Tamouza H, Chemouny JM, Raskova Kafkova L, Berthelot L, Flamant M, Demion M, et al. The IgA1 immune complex-mediated activation of the MAPK/ERK kinase pathway in mesangial cells is associated with glomerular damage in IgA nephropathy. Kidney Int. 2012;82:1284–1296. - PMC - PubMed
    1. Nagai K, Miyoshi M, Kake T, Fukushima N, Matsuura M, Shibata E, et al. Dual involvement of growth arrest-specific gene 6 in the early phase of human IgA nephropathy. PLoS One. 2013;8:e66759. - PMC - PubMed
    1. Chihara Y, Ono H, Ishimitsu T, Ono Y, Ishikawa K, Rakugi H, et al. Roles of TGF-beta1 and apoptosis in the progression of glomerulosclerosis in human IgA nephropathy. Clin Nephrol. 2006;65:385–392. - PubMed
    1. Espinosa M, Ortega R, Gomez-Carrasco JM, Lopez-Rubio F, Lopez-Andreu M, Lopez-Oliva MO, et al. Mesangial C4d deposition: a new prognostic factor in IgA nephropathy. Nephrol Dial Transplant. 2009;24:886–891. - PubMed

Publication types

MeSH terms

Substances

LinkOut - more resources