

Genome-wide diet-gene interaction analyses for risk of colorectal cancer
- PMID: 24743840
- PMCID: PMC3990510
- DOI: 10.1371/journal.pgen.1004228
Genome-wide diet-gene interaction analyses for risk of colorectal cancer
Abstract
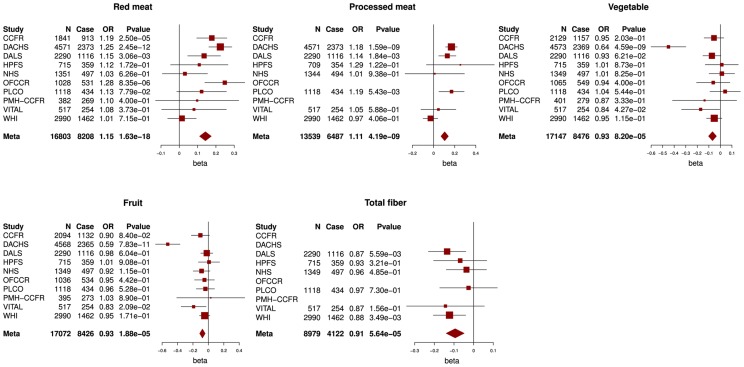
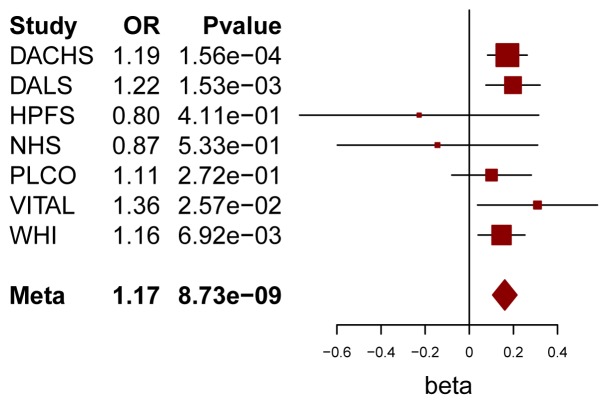
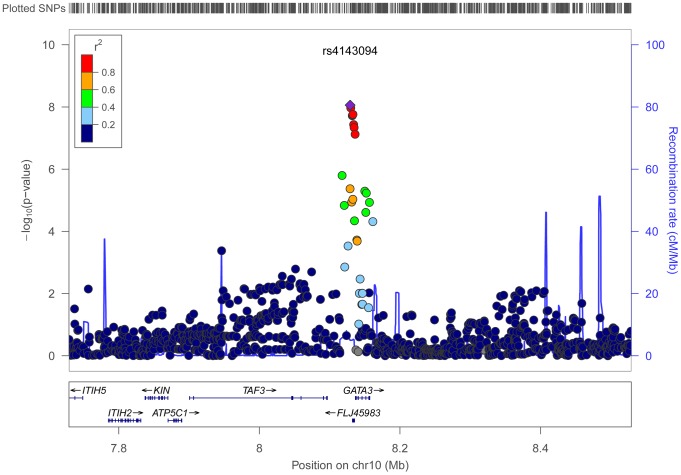
Dietary factors, including meat, fruits, vegetables and fiber, are associated with colorectal cancer; however, there is limited information as to whether these dietary factors interact with genetic variants to modify risk of colorectal cancer. We tested interactions between these dietary factors and approximately 2.7 million genetic variants for colorectal cancer risk among 9,287 cases and 9,117 controls from ten studies. We used logistic regression to investigate multiplicative gene-diet interactions, as well as our recently developed Cocktail method that involves a screening step based on marginal associations and gene-diet correlations and a testing step for multiplicative interactions, while correcting for multiple testing using weighted hypothesis testing. Per quartile increment in the intake of red and processed meat were associated with statistically significant increased risks of colorectal cancer and vegetable, fruit and fiber intake with lower risks. From the case-control analysis, we detected a significant interaction between rs4143094 (10p14/near GATA3) and processed meat consumption (OR = 1.17; p = 8.7E-09), which was consistently observed across studies (p heterogeneity = 0.78). The risk of colorectal cancer associated with processed meat was increased among individuals with the rs4143094-TG and -TT genotypes (OR = 1.20 and OR = 1.39, respectively) and null among those with the GG genotype (OR = 1.03). Our results identify a novel gene-diet interaction with processed meat for colorectal cancer, highlighting that diet may modify the effect of genetic variants on disease risk, which may have important implications for prevention.
Conflict of interest statement
The authors have declared that no competing interests exist.
Figures
References
-
- Siegel R, Naishadham D, Jemal A (2012) Cancer statistics, 2012. CA Cancer J Clin 62: 10–29. - PubMed
-
- Alexander DD, Cushing CA (2011) Red meat and colorectal cancer: a critical summary of prospective epidemiologic studies. Obes Rev 12: e472–493. - PubMed
-
- Alexander DD, Miller AJ, Cushing CA, Lowe KA (2010) Processed meat and colorectal cancer: a quantitative review of prospective epidemiologic studies. Eur J Cancer Prev 19: 328–341. - PubMed
-
- van Duijnhoven FJ, Bueno-De-Mesquita HB, Ferrari P, Jenab M, Boshuizen HC, et al. (2009) Fruit, vegetables, and colorectal cancer risk: the European Prospective Investigation into Cancer and Nutrition. The American journal of clinical nutrition 89: 1441–1452. - PubMed
Publication types
MeSH terms
Grants and funding
- U01 HG004438/HG/NHGRI NIH HHS/United States
- P01 CA087969/CA/NCI NIH HHS/United States
- U01 CA164930/CA/NCI NIH HHS/United States
- NIH GEI U01 HG 004438/HG/NHGRI NIH HHS/United States
- R01 CA48998/CA/NCI NIH HHS/United States
- P01 CA 055075/CA/NCI NIH HHS/United States
- HHSN271201100004C/AG/NIA NIH HHS/United States
- NIH U01 HG004446/HG/NHGRI NIH HHS/United States
- HHSN268201100002C/WH/WHI NIH HHS/United States
- U01 CA097735/CA/NCI NIH HHS/United States
- UM1 CA167552/CA/NCI NIH HHS/United States
- HHSN268201100003I/HL/NHLBI NIH HHS/United States
- R01 CA120582/CA/NCI NIH HHS/United States
- HHSN268201100004C/WH/WHI NIH HHS/United States
- R01 CA059045/CA/NCI NIH HHS/United States
- HHSN268201100001I/HL/NHLBI NIH HHS/United States
- R01 CA076366/CA/NCI NIH HHS/United States
- P01 CA 087969/CA/NCI NIH HHS/United States
- U01 HG004446/HG/NHGRI NIH HHS/United States
- P30 DK043351/DK/NIDDK NIH HHS/United States
- HHSN268201100004I/HL/NHLBI NIH HHS/United States
- Z01 CP010200/ImNIH/Intramural NIH HHS/United States
- P01 CA053996/CA/NCI NIH HHS/United States
- K05 CA154337/CA/NCI NIH HHS/United States
- U24 CA074783/CA/NCI NIH HHS/United States
- P01 CA055075/CA/NCI NIH HHS/United States
- P50 CA 127003/CA/NCI NIH HHS/United States
- HHSN268201100046C/HL/NHLBI NIH HHS/United States
- R01 137178/PHS HHS/United States
- CAPMC/ CIHR/Canada
- R01 CA048998/CA/NCI NIH HHS/United States
- R25 CA094880/CA/NCI NIH HHS/United States
- U01 CA137088/CA/NCI NIH HHS/United States
- HHSN268201100003C/WH/WHI NIH HHS/United States
- U24 CA074794/CA/NCI NIH HHS/United States
- U24 CA097735/CA/NCI NIH HHS/United States
- U01 CA074794/CA/NCI NIH HHS/United States
- UM1 CA167551/CA/NCI NIH HHS/United States
- U01 CA122839/CA/NCI NIH HHS/United States
- HHSN268201100002I/HL/NHLBI NIH HHS/United States
- U01 CA074783/CA/NCI NIH HHS/United States
- Z01 CP 010200/CP/NCI NIH HHS/United States
- P50 CA127003/CA/NCI NIH HHS/United States
- P30 CA071789/CA/NCI NIH HHS/United States
- HHSN268201100001C/WH/WHI NIH HHS/United States
LinkOut - more resources
Full Text Sources
Other Literature Sources
Medical
Miscellaneous
