

Caloric beverages were major sources of energy among children and adults in Mexico, 1999-2012
- PMID: 24744311
- PMCID: PMC4083240
- DOI: 10.3945/jn.114.190652
Caloric beverages were major sources of energy among children and adults in Mexico, 1999-2012
Abstract
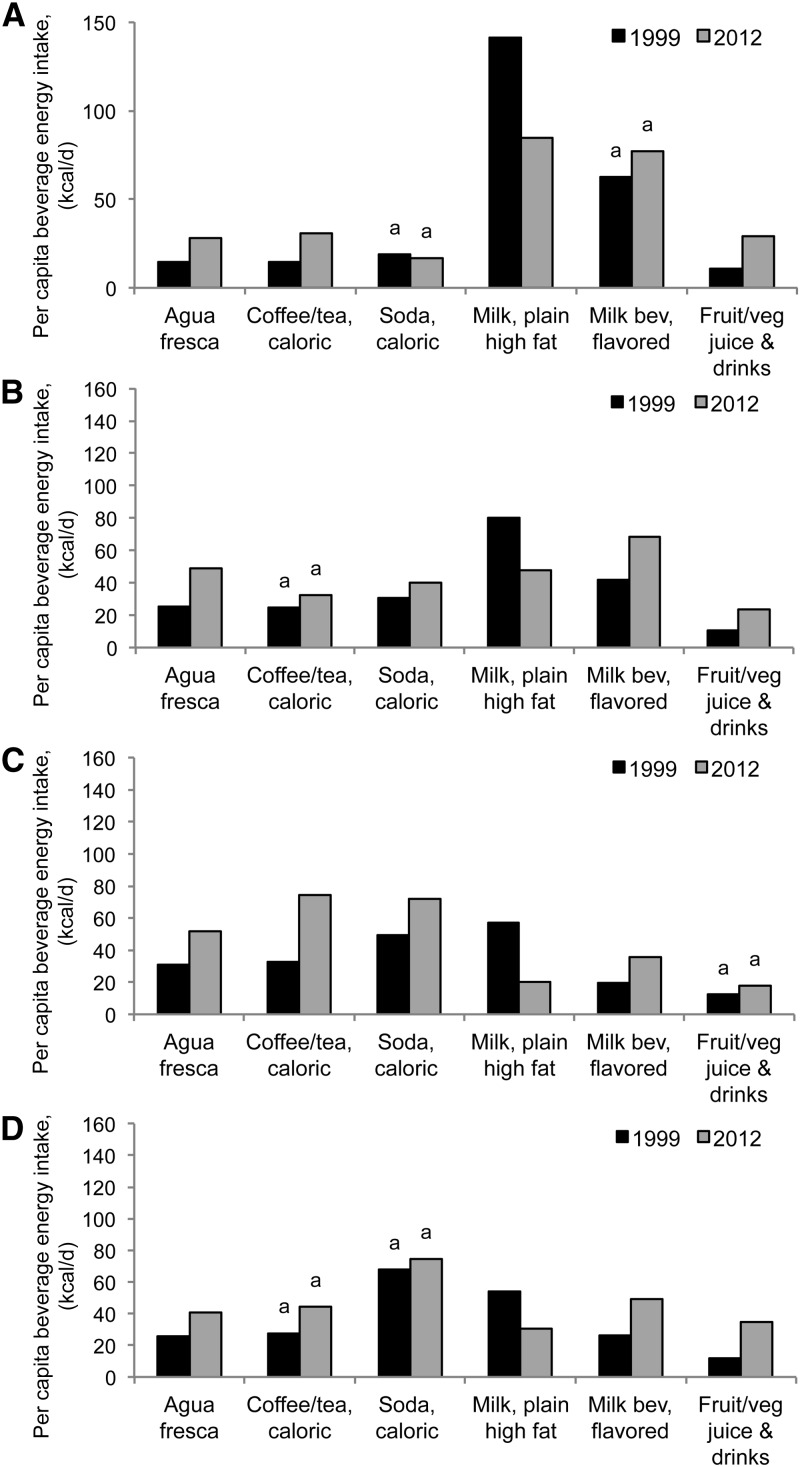
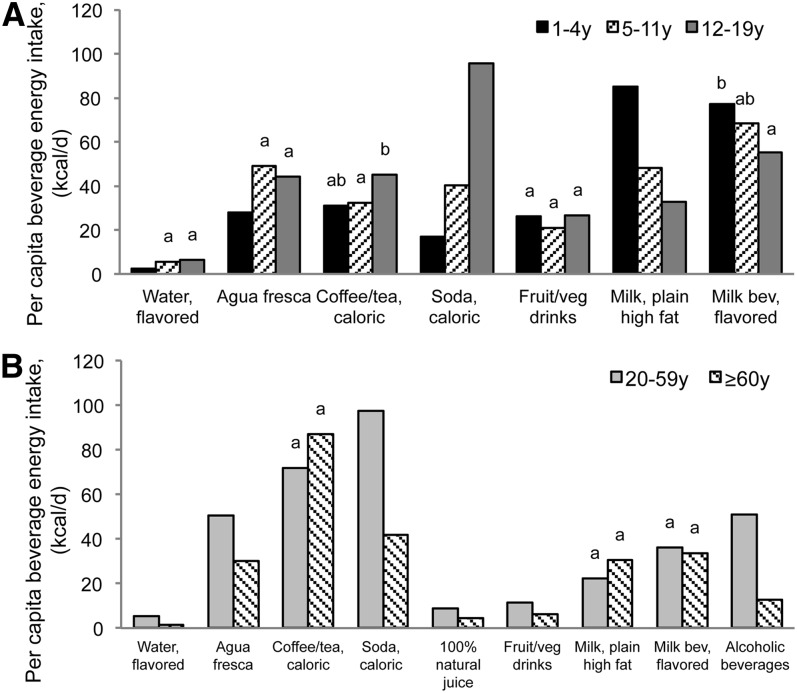
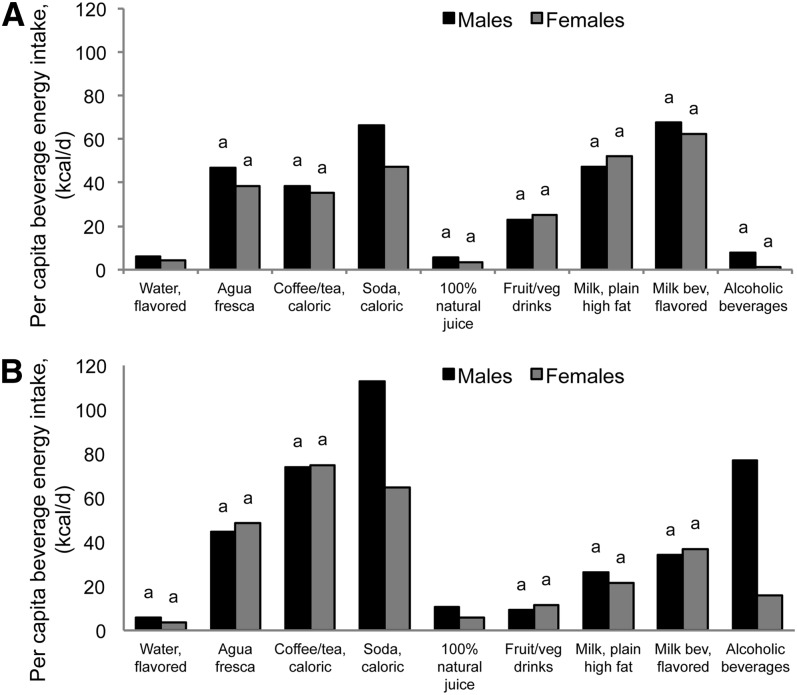
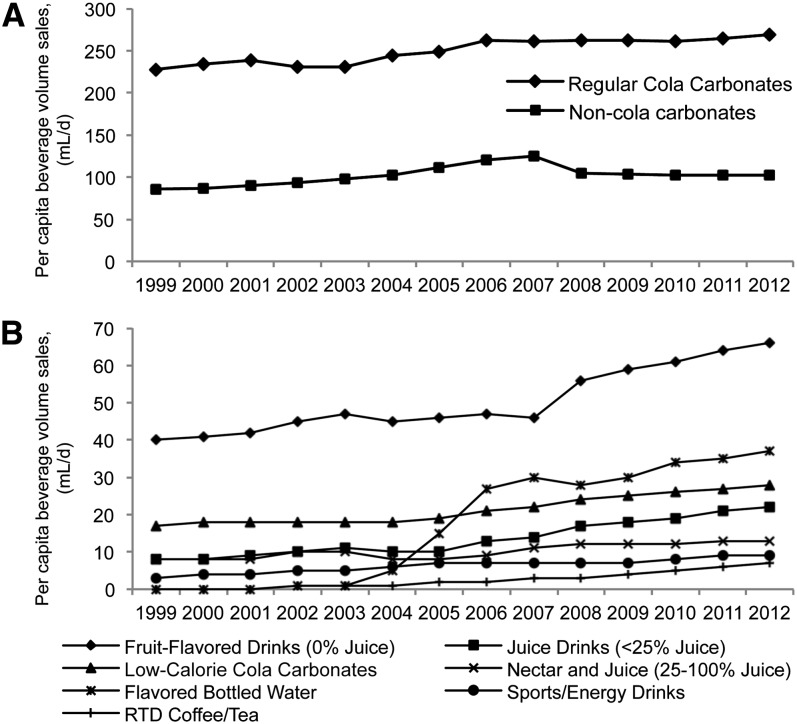
Mexico, with 1 of the highest obesity prevalences in the world, instituted a 10% excise tax for any sugar-sweetened beverage (SSB) starting on 1 January 2014. Understanding the recent patterns and trends in beverage intake and sales in Mexico provides both background and baseline data for the importance of SSBs and other beverages in the Mexican diet. We analyzed a single 24-h dietary recall from 2 nationally representative surveys: the Mexican Nutrition Survey 1999 (n = 6049) and the National Health and Nutrition Survey 2012 (n = 10,343). To describe trends and patterns in beverages, we calculated the volume and energy intake per capita and per consumer and the proportion of consumers of each beverage group in each survey. A commercial sales dataset was used to describe beverage sales trends from 1999 to 2012. From 1999 to 2012, total daily energy from beverages increased among children aged 5-11 y (+45.3 kcal), females aged 12-19 y (+57.3 kcal), and adult females aged 20-49 y (+96.4 kcal) (P < 0.05). Over the same period, intake of beverages with added sugars increased, specifically flavored milk, agua fresca (fruit water made in stalls or at home, usually with added sugars), and fruit drinks among children aged 5-11 y and females aged 12-19 y and caloric coffee/tea, soda, and agua fresca among adult females aged 20-49 y. In 2012, beverages represented 17.5% (325 kcal) and 19.0% (382 kcal) of the total daily energy intake per capita in children aged 1-19 y and adults aged ≥20 y, respectively. In 2012, flavored milk beverages, caloric soda, and high-fat milk were the top 3 major contributors to total daily energy intake per capita in all children aged 1-19 y. Caloric soda, caloric coffee/tea, and agua fresca were the top 3 major energy contributors in adults aged ≥20 y. From 1999 to 2012, sales of soda, fruit-flavored drinks, and flavored waters increased. In conclusion, consumption of several beverages with added sugars increased among children and adult females in Mexico. Because caloric soda is currently 1 of the top beverages consumed, a 10% tax on SSBs might help to significantly reduce added sugars intake in Mexico.
© 2014 American Society for Nutrition.
Conflict of interest statement
Author disclosures: S. Barquera, J. A. Rivera, and B. M. Popkin were collaborators on a Mexican randomized clinical trial funded by Danone Water Research Center. B. M. Popkin participated in a similar study in the United States funded by Nestlé Waters. Both studies focused on the impact of providing water to adults involved in healthy food eating research. D. Stern and C. Piernas, no conflicts of interest.
Figures
References
-
- Rivera JA, Muñoz-Hernández O, Rosas-Peralta M, Aguilar-Salinas CA, Popkin BM, Willett WC. Beverage consumption for a healthy life: recommendations for the Mexican population (in Spanish). Salud Publica Mex. 2008;50:173–95. - PubMed
-
- Mattes RD. Dietary compensation by humans for supplemental energy provided as ethanol or carbohydrate in fluids. Physiol Behav. 1996;59:179–87. - PubMed
Publication types
MeSH terms
Substances
Grants and funding
LinkOut - more resources
Full Text Sources
Other Literature Sources
Medical
