. 2014 Nov;25(11):2445-57.
doi: 10.1681/ASN.2013090931. Epub 2014 Apr 17.

Aldosterone regulates microRNAs in the cortical collecting duct to alter sodium transport

Affiliations

Aldosterone regulates microRNAs in the cortical collecting duct to alter sodium transport

Robert S Edinger et al. J Am Soc Nephrol. 2014 Nov.

Erratum in

  • Erratum.
    [No authors listed] [No authors listed] J Am Soc Nephrol. 2015 Jun;26(6):1476. doi: 10.1681/ASN.2015040401. J Am Soc Nephrol. 2015. PMID: 26025913 Free PMC article. No abstract available.
  • Erratum.
    [No authors listed] [No authors listed] J Am Soc Nephrol. 2015 Oct;26(10):2600. doi: 10.1681/ASN.2015070789. J Am Soc Nephrol. 2015. PMID: 26424868 Free PMC article. No abstract available.

Abstract

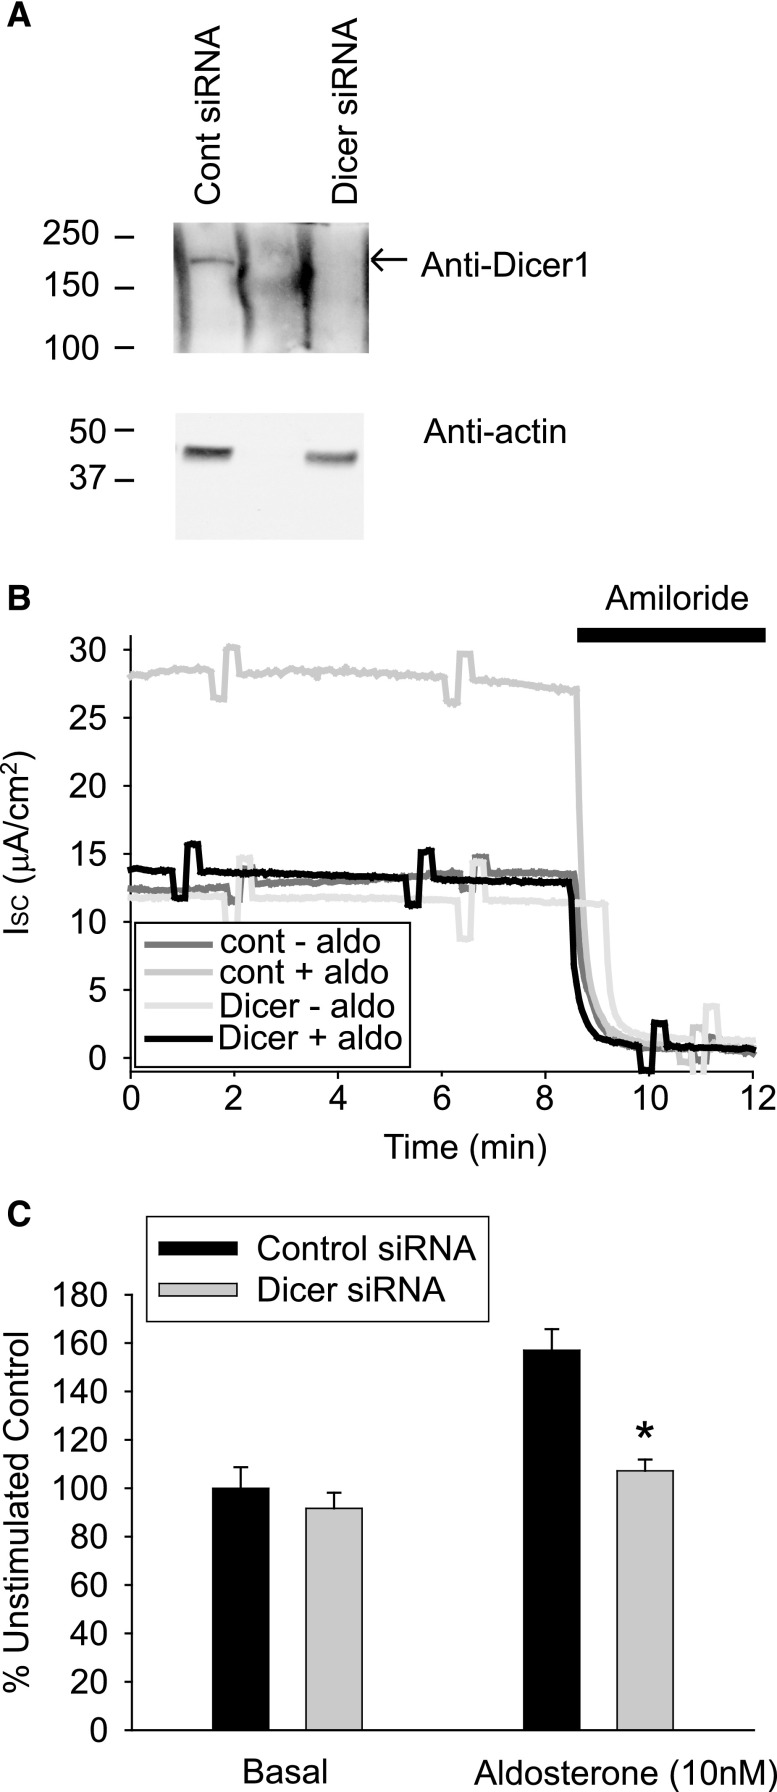
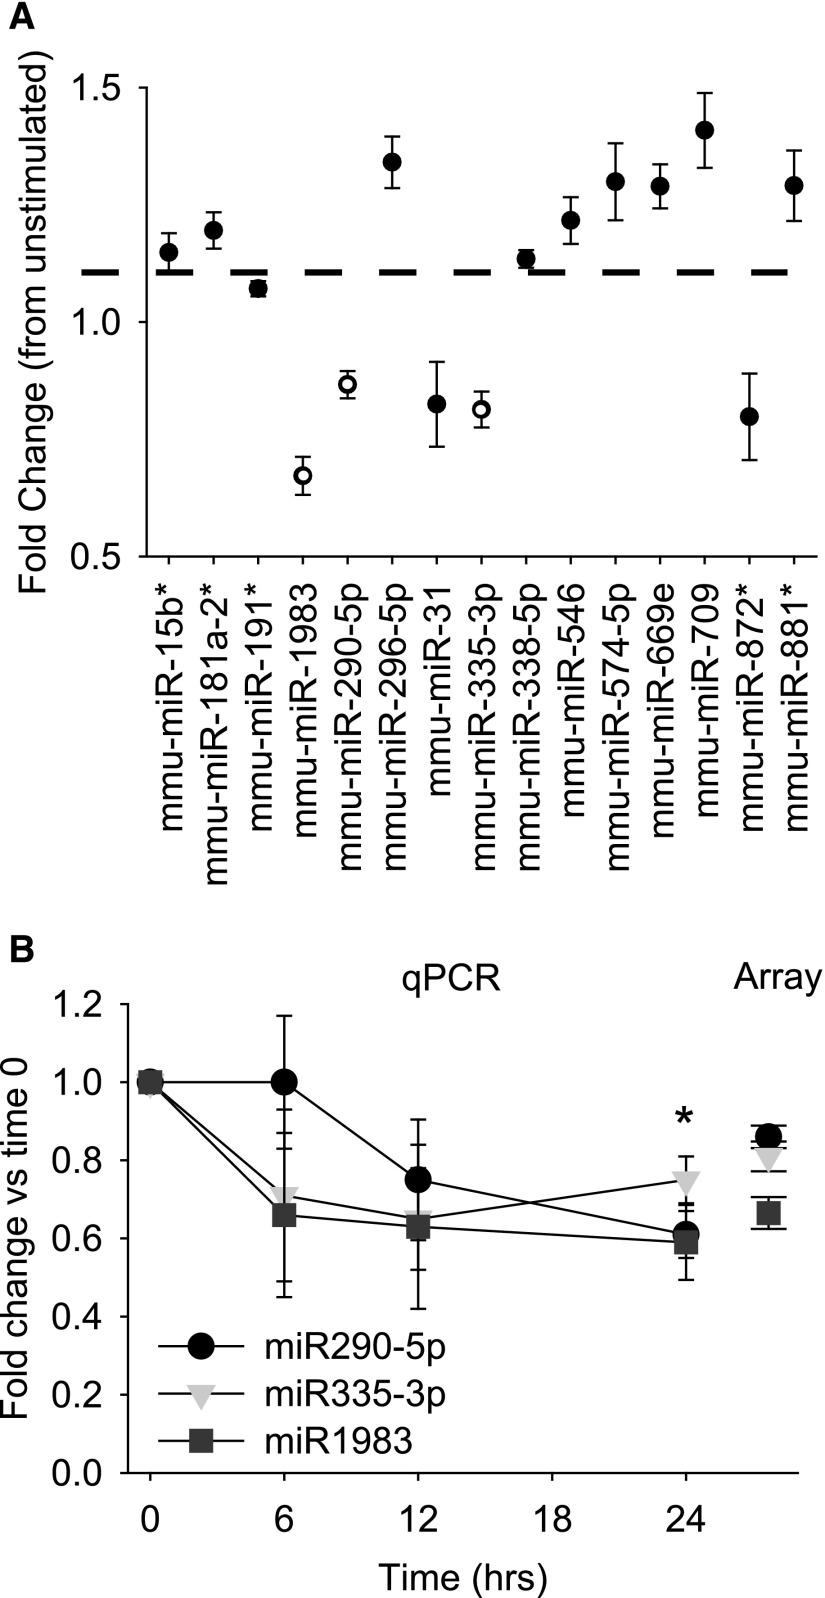
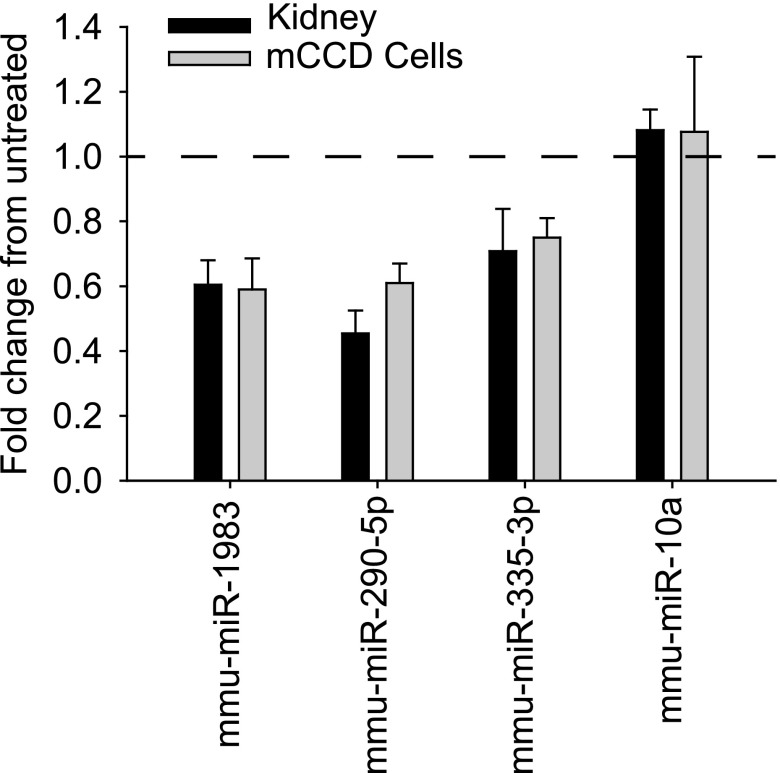
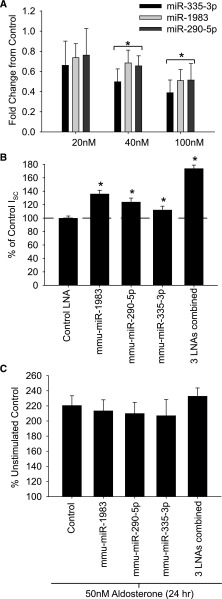
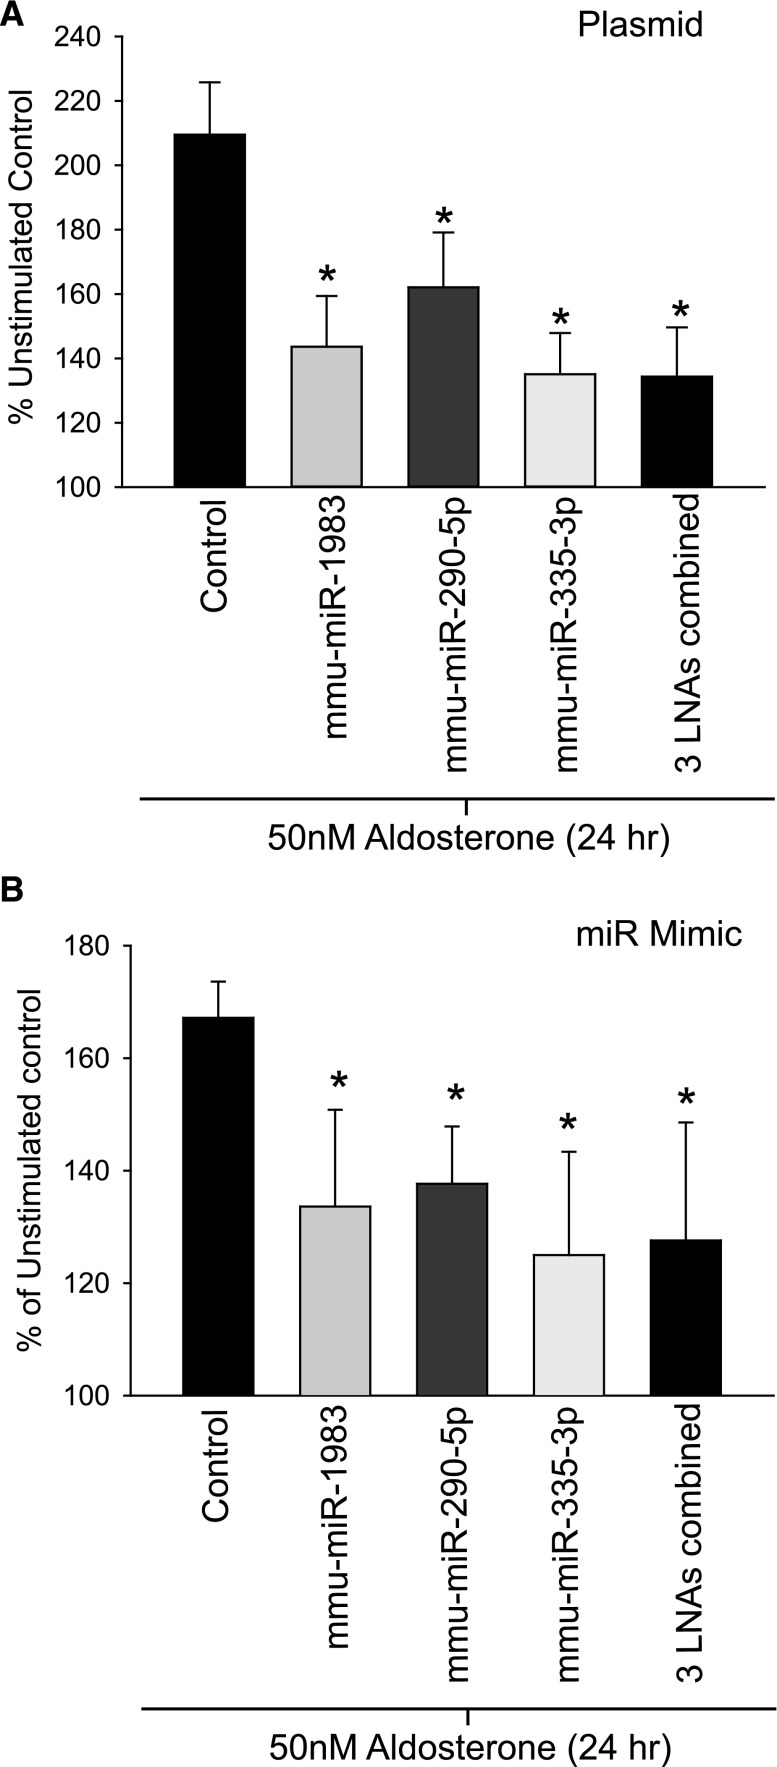
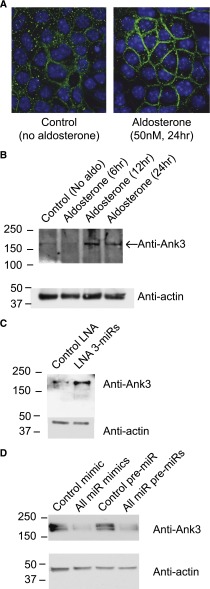
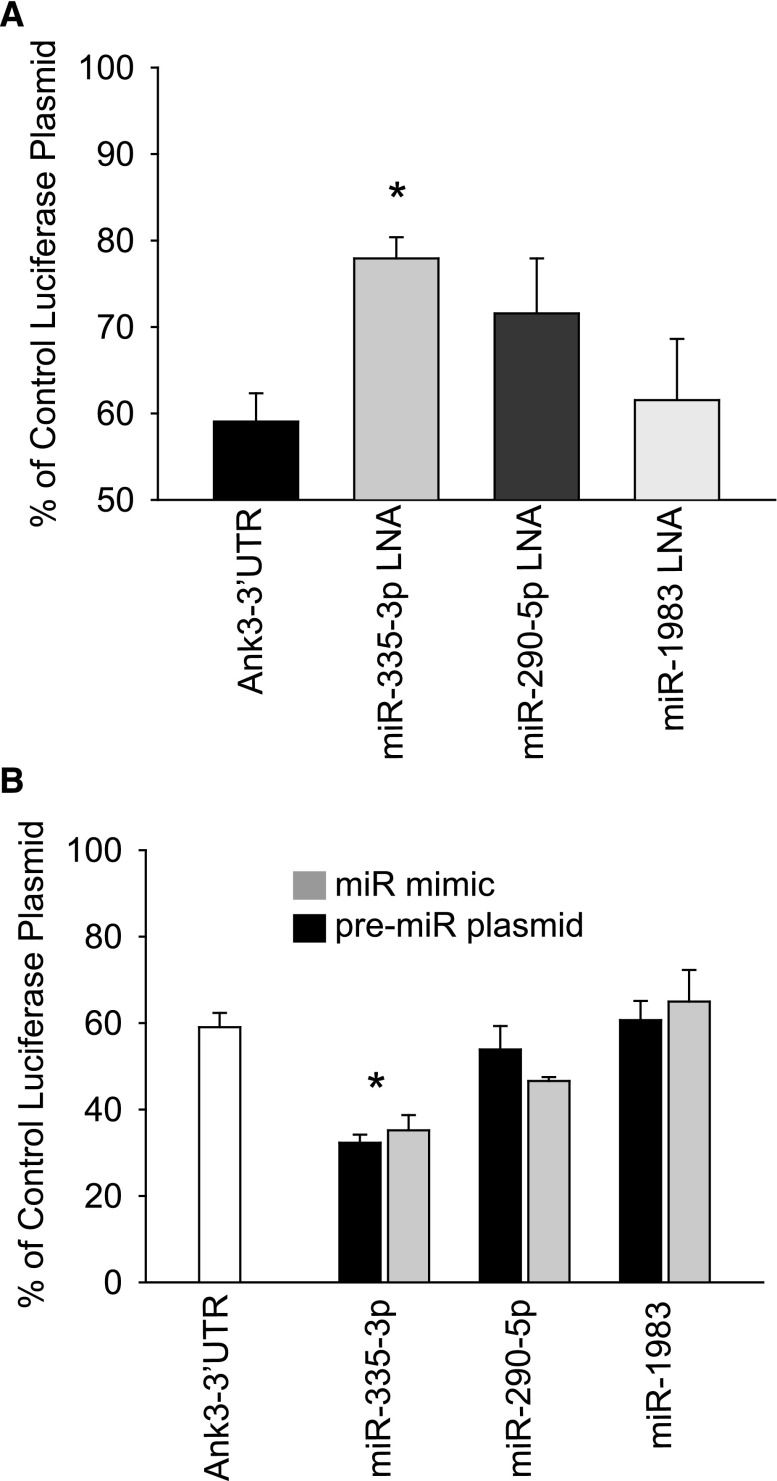
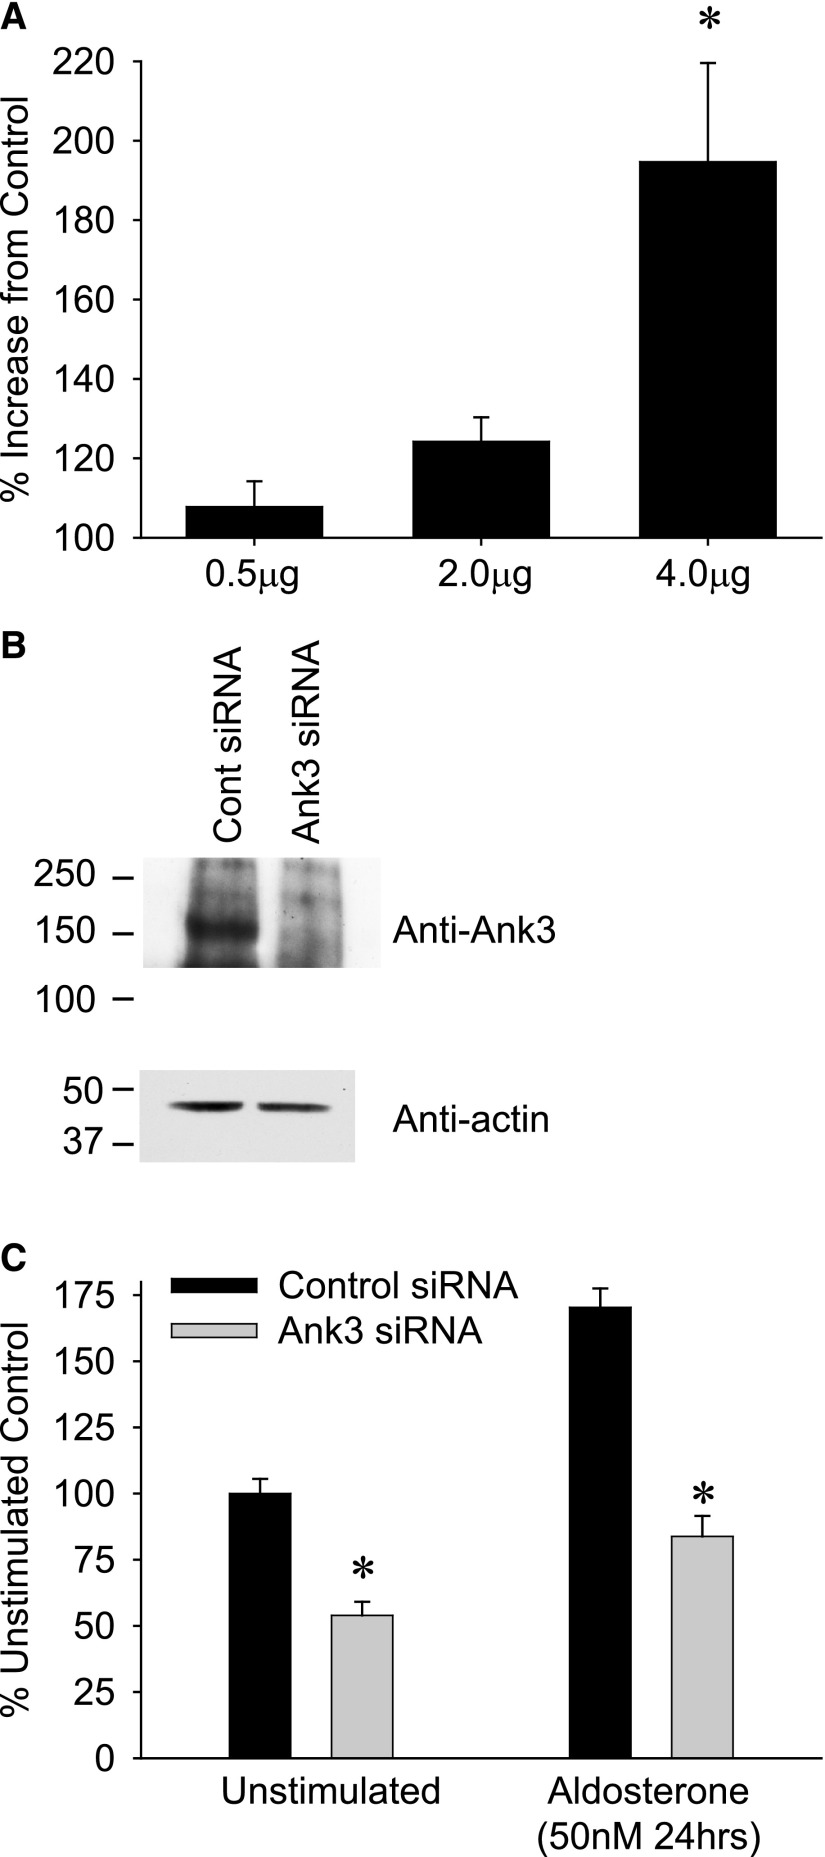
A role for microRNAs (miRs) in the physiologic regulation of sodium transport in the kidney has not been established. In this study, we investigated the potential of aldosterone to alter miR expression in mouse cortical collecting duct (mCCD) epithelial cells. Microarray studies demonstrated the regulation of miR expression by aldosterone in both cultured mCCD and isolated primary distal nephron principal cells. Aldosterone regulation of the most significantly downregulated miRs, mmu-miR-335-3p, mmu-miR-290-5p, and mmu-miR-1983 was confirmed by quantitative RT-PCR. Reducing the expression of these miRs separately or in combination increased epithelial sodium channel (ENaC)-mediated sodium transport in mCCD cells, without mineralocorticoid supplementation. Artificially increasing the expression of these miRs by transfection with plasmid precursors or miR mimic constructs blunted aldosterone stimulation of ENaC transport. Using a newly developed computational approach, termed ComiR, we predicted potential gene targets for the aldosterone-regulated miRs and confirmed ankyrin 3 (Ank3) as a novel aldosterone and miR-regulated protein. A dual-luciferase assay demonstrated direct binding of the miRs with the Ank3-3' untranslated region. Overexpression of Ank3 increased and depletion of Ank3 decreased ENaC-mediated sodium transport in mCCD cells. These findings implicate miRs as intermediaries in aldosterone signaling in principal cells of the distal kidney nephron.


Figures

Figure 1.
Figure 1.
Dicer-1 depletion in mCCD cells reduces aldosterone stimulation of ENaC-mediated Na+ transport. (A) Western blot of whole-cell lysates collected from control siRNA and Dicer-1 knockdown mCCD cells grown on filter supports. (B) Representative short-circuit current (ISC) traces from mCCD cells mounted in modified Ussing chambers. Control and Dicer siRNA transfected cells stimulated with 10 nM aldosterone for 24 hours before ISC measurements. (C) Summarized data (mean±SEM) from similar experiments (n>12) to those presented in B. cont, control.
Figure 2.
Figure 2.
Aldosterone stimulation alters miR expression in mCCD cells. (A) Summarized fold change in expression (mean±SEM) of listed miRs from microarray data (n=5) after 50 nM aldosterone stimulation (24 hours). All listed miRs had significantly altered expression levels (P<0.05) with the miRs in open circles the most significantly downregulated following aldosterone stimulation (P<0.01). (B) Fold change in expression of the significantly downregulated miRs (A) quantified by qRT-PCR for cells stimulated with 50 nM aldosterone for 6, 12, and 24 hours. Expression decreased (*P<0.05) for all three after 24 hours. Fold change did not significantly differ between PCR and array data at the 24-hour time point.
Figure 3.
Figure 3.
Expression of miRs is decreased in distal nephron epithelial cells isolated from mice receiving low-sodium diets. qRT-PCR miR expression in CCD cells isolated from kidneys of mice receiving low-sodium diets (black bars) or from cultured CCD cells stimulated with aldosterone (gray bars) was normalized to control expression. The fold change in miR expression did not significantly differ between in vivo and in vitro CCD cells. Expression of miR-1983, miR-335–3p, and miR-290–5p was significantly reduced from mice receiving normal diets or unstimulated mCCD cells. As a control, no difference in expression was observed for miR-10a after low-sodium diet or aldosterone stimulation (in agreement with the microarray data, see Supplemental Figure 1).
Figure 4.
Figure 4.
Reduction in miR expression increases ENaC-mediated Na+ transport. (A) A dose-dependent decrease in miR expression was observed in mCCD cells transfected with LNAs targeting each of the three miRs. qRT-PCR values were normalized to control LNA transfected cells. (B) Normalized ISC measurements from mCCD cells transfected with 50 nM LNA oligonucleotides, alone or in combination, expressed as a percentage of unstimulated control-transfected mCCDs (n=45). (C) Normalized ISC measurements from mCCD cells transfected as in B and stimulated with 50 nM aldosterone, expressed as a percentage of untreated, control transfected CCDs. Response did not significantly differ, and all cells had a significant increase (P<0.05) in ISC after aldosterone stimulation compared with unstimulated controls (n=9).
Figure 5.
Figure 5.
Exogenous increase in miR expression reduces aldosterone-stimulated ENaC transport. (A) Normalized ISC measurements from mCCD were transiently transfected with plasmids encoding pre-miR sequences, alone or in combination. Cells seeded onto filter supports were stimulated with aldosterone for 24 hours (50 nM), and ISC was normalized to unstimulated mCCD cells transfected with control plasmid. ISC response to aldosterone decreased significantly (*P<0.05) in cells overexpressing miR-1983, miR-290–5p, and miR-335–3p or the combination of the three miRs (n=30). (B) The same experiments as in A were carried out using miR mimics, and a significant reduction in aldosterone response was seen for all overexpressed miRs (n=10).
Figure 6.
Figure 6.
Ank3 is regulated by aldosterone and miRs. (A) Immunofluorescent images of mCCD cells cultured on filter supports and labeled for Ank3 (green) in cells without (left) and following aldosterone stimulation (right). Nuclei are counterstained in blue (DAPI); white bars=10 μm. (B) Western blots of Ank3 expression from whole cell lysates of mCCD cells cultured on filters and stimulated with aldosterone for 6, 12, and 24 hours. (C) Expression of the three miRs was reduced by LNA transfection (as in Figure 4) and cells seeded onto filters. A Western blot of Ank3 expression from whole cell lysates in control (unstimulated) and LNA transfected, miR reduced mCCD cells (no aldosterone) is presented. (D) The three miRs were overexpressed using miR mimics or plasmid pre-miR transfection. Expression of Ank3 from whole cell lysates is presented in the Western blot following miR overexpression or in control transfected mCCD cells. In both cases, miR overexpression reduced endogenous Ank3 expression.
Figure 7.
Figure 7.
Luciferase reporter for Ank3 3′-UTR shows regulation by miRs. (A) Sequential luciferase signal was recorded from a dual luciferase reporter incorporating Ank3 3′-UTR transfected into mCCD cells, seeded onto filter supports, and normalized to empty vector controls (100%). The Ank3 3′-UTR signal alone cotransfected with control LNA was reduced compared with the empty vector. Expression of each miR was reduced by cotransfection of 50 nM LNA (as in Figure 4), and luciferase reporter expression increased significantly with reduction of miR-335–3p expression (n=9). (B) In the converse experiment to A, miR expression was increased using miR mimics and pre-miR plasmids (as in Figure 5), and a further, significant (P<0.05) reduction in normalized luciferase expression was observed in cells overexpressing miR-335–3p (n=9).
Figure 8.
Figure 8.
Altering Ank3 expression changes ENaC-mediated Na+ transport. (A) mCCD cells were transfected with increasing amounts of human ANK3 plasmid and seeded onto filter supports; ISC was recorded after 72 hours. A significant increase in ENaC Na+ transport compared with control transfected cells was observed with 4 μg plasmid transfection (without aldosterone stimulation, n=5). (B) Ank3 expression was reduced in mCCD cells by siRNA transfection. Western blots of whole cell Ank3 expression in control siRNA and Ank3 targeting siRNA transfected cells are presented. (C) ISC recordings from cells transfected with control siRNA and Ank3-targeting siRNA (as in B) seeded onto filter supports and mounted into Ussing chambers. Both basal (unstimulated) and aldosterone stimulated ISC was significantly smaller (*P<0.05) in the Ank3 depleted cells compared with controls (n=12).

Similar articles

Cited by

References

    1. Garty H, Palmer LG: Epithelial sodium channels: Function, structure, and regulation. Physiol Rev 77: 359–396, 1997 - PubMed
    1. Kellenberger S, Schild L: Epithelial sodium channel/degenerin family of ion channels: A variety of functions for a shared structure. Physiol Rev 82: 735–767, 2002 - PubMed
    1. Bhalla V, Hallows KR: Mechanisms of ENaC regulation and clinical implications. J Am Soc Nephrol 19: 1845–1854, 2008 - PubMed
    1. Butterworth MB: Regulation of the epithelial sodium channel (ENaC) by membrane trafficking. Biochim Biophys Acta 1802: 1166–1177, 2010 - PMC - PubMed
    1. Butterworth MB, Edinger RS, Frizzell RA, Johnson JP: Regulation of the epithelial sodium channel by membrane trafficking. Am J Physiol Renal Physiol 296: F10–F24, 2009 - PMC - PubMed

Publication types

MeSH terms