

Associations between cortical thickness and general intelligence in children, adolescents and young adults
- PMID: 24744452
- PMCID: PMC3985090
- DOI: 10.1016/j.intell.2013.07.010
Associations between cortical thickness and general intelligence in children, adolescents and young adults
Abstract
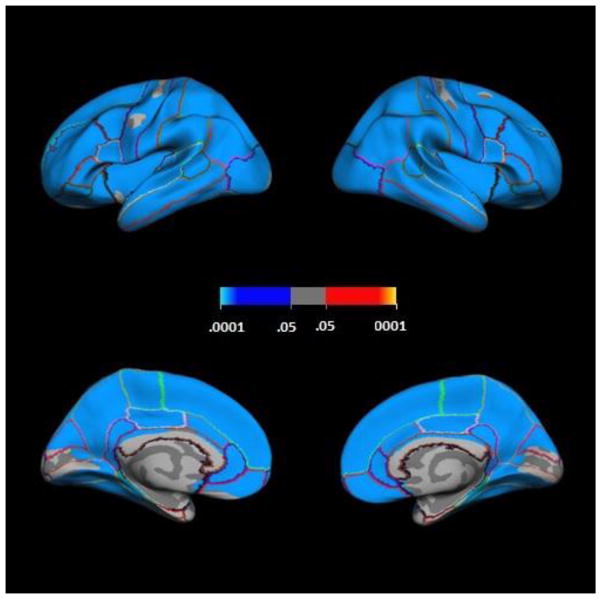
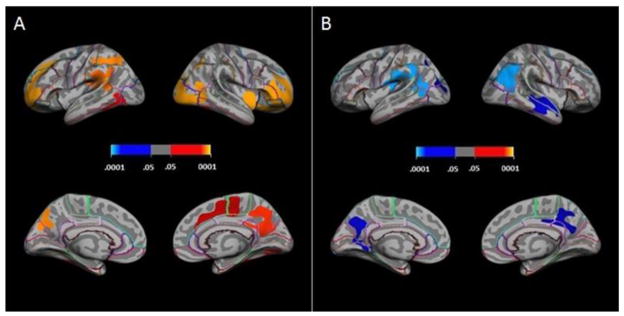
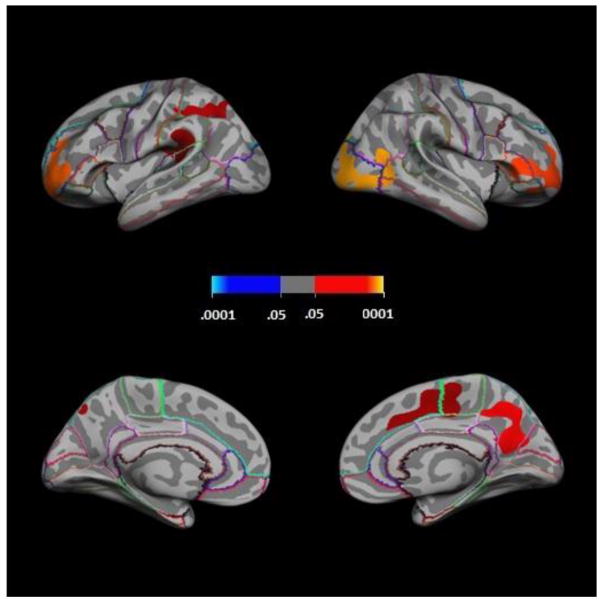
Neuroimaging research indicates that human intellectual ability is related to brain structure including the thickness of the cerebral cortex. Most studies indicate that general intelligence is positively associated with cortical thickness in areas of association cortex distributed throughout both brain hemispheres. In this study, we performed a cortical thickness mapping analysis on data from 182 healthy typically developing males and females ages 9 to 24 years to identify correlates of general intelligence (g) scores. To determine if these correlates also mediate associations of specific cognitive abilities with cortical thickness, we regressed specific cognitive test scores on g scores and analyzed the residuals with respect to cortical thickness. The effect of age on the association between cortical thickness and intelligence was examined. We found a widely distributed pattern of positive associations between cortical thickness and g scores, as derived from the first unrotated principal factor of a factor analysis of Wechsler Abbreviated Scale of Intelligence (WASI) subtest scores. After WASI specific cognitive subtest scores were regressed on g factor scores, the residual score variances did not correlate significantly with cortical thickness in the full sample with age covaried. When participants were grouped at the age median, significant positive associations of cortical thickness were obtained in the older group for g-residualized scores on Block Design (a measure of visual-motor integrative processing) while significant negative associations of cortical thickness were observed in the younger group for g-residualized Vocabulary scores. These results regarding correlates of general intelligence are concordant with the existing literature, while the findings from younger versus older subgroups have implications for future research on brain structural correlates of specific cognitive abilities, as well as the cognitive domain specificity of behavioral performance correlates of normative gray matter thinning during adolescence.
Keywords: cortical thickness; development; general intelligence; neuroimaging; specific cognitive abilities.
Conflict of interest statement
The authors have no conflicts of interest to declare.
Figures
References
-
- Andreasen NC, Flaum M, Swayze V, O’Leary DS, Alliger R, Cohen G, et al. Intelligence and brain structure in normal individuals. American Journal of Psychiatry. 1993;150:130–134. - PubMed
-
- Axelrod B. Validity of the Wechsler abbreviated scale of intelligence and other very short forms of estimating intellectual functioning. Assessment. 2002;9:17–23. - PubMed
-
- Carroll JB. Human Cognitive Abilities: A Survey of Factor-Analytic Studies. Cambridge University Press; 1993.
-
- Colom R, Haier R, Head K, Alvarez-Linera J, Quiroga M, Shih PC, Jung R. Gray matter correlates of fluid, crystallized, and spatial intelligence: Testing the P-FIT model. Intelligence. 2009;37:124–135.
Grants and funding
LinkOut - more resources
Full Text Sources
Other Literature Sources