. 2014 Mar 31:5:115.
doi: 10.3389/fphys.2014.00115. eCollection 2014.

The role of sense of effort on self-selected cycling power output

Affiliations

The role of sense of effort on self-selected cycling power output

Ryan J Christian et al. Front Physiol. .

Abstract

Purpose: We explored the effects of the sense of effort and accompanying perceptions of peripheral discomfort on self-selected cycle power output under two different inspired O2 fractions.

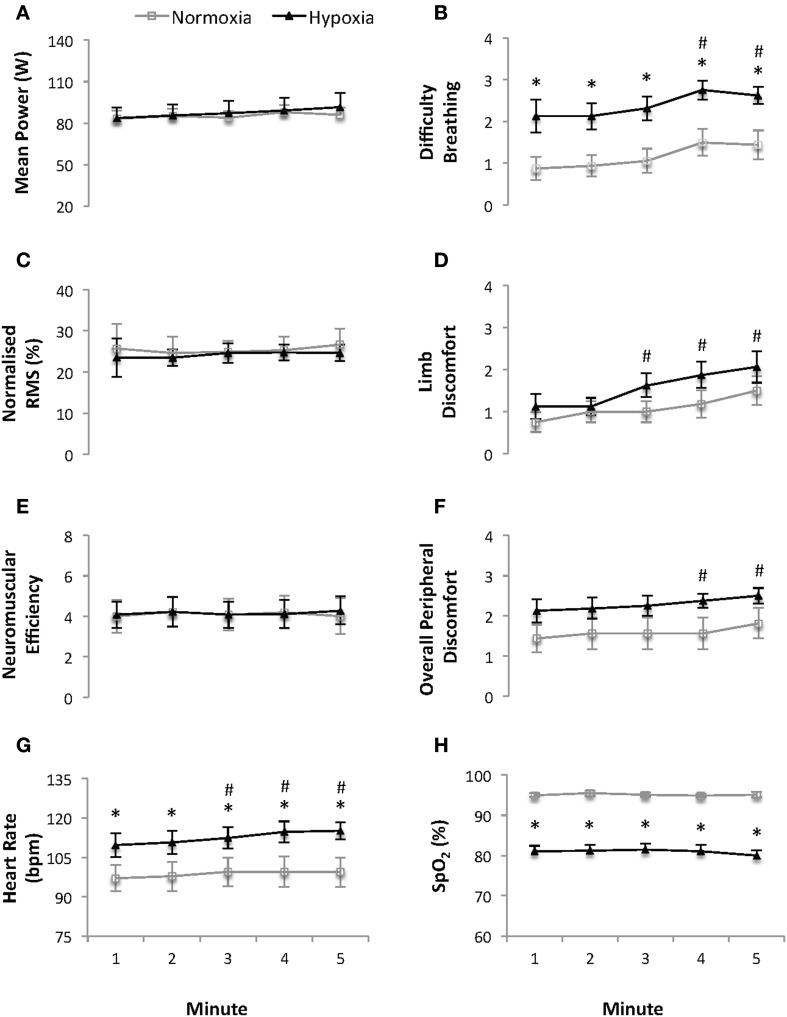
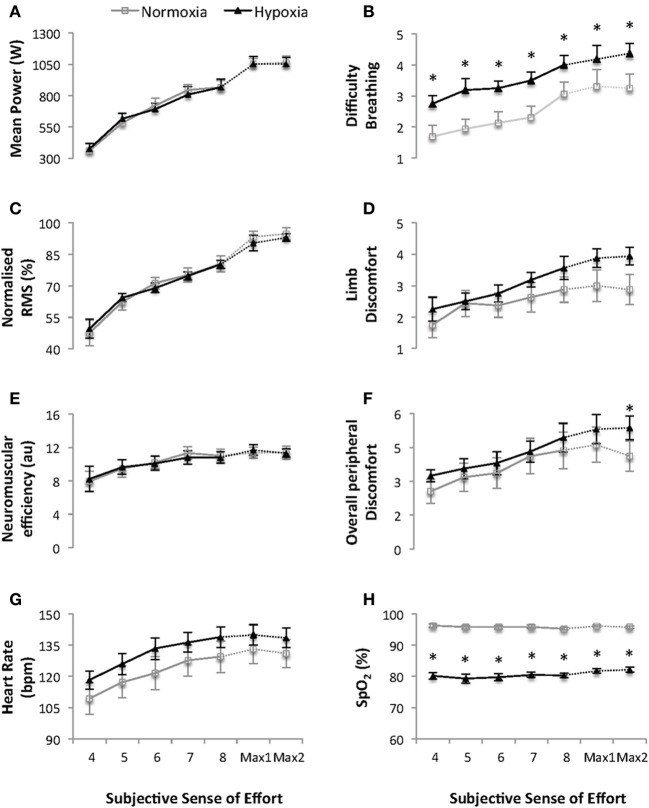
Methods: On separate days, eight trained males cycled for 5 min at a constant subjective effort (sense of effort of '3' on a modified Borg CR10 scale), immediately followed by five 4-s progressive submaximal (sense of effort of "4, 5, 6, 7, and 8"; 40 s between bouts) and two 4-s maximal (sense of effort of "10"; 3 min between bouts) bouts under normoxia (NM: fraction of inspired O2 [FiO2] 0.21) and hypoxia (HY: [FiO2] 0.13). Physiological (Heart Rate, arterial oxygen saturation (SpO2) and quadriceps Root Mean Square (RMS) electromyographical activity) and perceptual responses (overall peripheral discomfort, difficulty breathing and limb discomfort) were recorded.

Results: Power output and normalized quadriceps RMS activity were not different between conditions during any exercise bout (p > 0.05) and remained unchanged across time during the constant-effort cycling. SpO2 was lower, while heart rate and ratings of perceived difficulty breathing were higher under HY, compared to NM, at all time points (p < 0.05). During the constant-effort cycling, heart rate, overall perceived discomfort, difficulty breathing and limb discomfort increased with time (all p < 0.05). All variables (except SpO2) increased along with sense of effort during the brief progressive cycling bouts (all p < 0.05). During the two maximal cycling bouts, ratings of overall peripheral discomfort displayed an interaction between time and condition with ratings higher in the second bout under HY vs. NM conditions.

Conclusion: During self-selected, constant-effort and brief progressive, sub-maximal, and maximal cycling bouts, mechanical work is regulated in parallel to the sense of effort, independently from peripheral sensations of discomfort.

Keywords: complex system regulation; conscious awareness; hypoxia; perceived peripheral discomfort; ratings of perceived exertion.


Figures

Figure 1
Figure 1
Mean power (W) (A), difficulty breathing (B), normalized quadriceps Root Mean Square (RMS) electromyographical activity (C), limb discomfort (D), neuromuscular efficiency (au) (E), overall peripheral discomfort (F), heart rate (bpm) (G) and arterial oxygen saturation (SpO2) (H) recorded at 1-minute intervals during the 5 min of continuous constant-effort cycling (sense of effort of “3” on a modified Borg CR10 scale; see Supplementary Material). Values are mean ± s.e.m., N = 8. Data is presented for normoxia (FiO2 0.21) and hypoxia (FiO2 0.13). * Significant difference vs. normoxia (p < 0.05). # Significant difference vs. min 1 (p < 0.05).
Figure 2
Figure 2
Mean power output (W) (A), difficulty breathing (B), normalized quadriceps Root Mean Square (RMS) electromyographical activity (C), limb discomfort (D), neuromuscular efficiency (au) (E), overall peripheral discomfort (F), heart rate (bpm) (G) and arterial oxygen saturation (SpO2) (H) for the five progressive and two maximal 4-s cycling bouts (sense of effort of “4, 5, 6, 7, 8, and 10” on a modified Borg CR10 scale; see Supplementary Material). Values are mean ± s.e.m., N = 8. Data is presented for normoxia (FiO2 0.21) and hypoxia (FiO2 0.13). Note that there was an interaction between time and condition (p < 0.05) for overall perceived exertion during the 2 maximal 4-s cycling bouts. * Significant difference vs. normoxia (p < 0.05).

References

    1. Amann M. (2011). Central and peripheral fatigue. Med. Sci. Sports Exerc. 43, 2039–2045 10.1249/MSS.0b013e31821f59ab - DOI - PubMed
    1. Amann M., Pegelow D. F., Jacques A. J., Dempsey J. A. (2007). Inspiratory muscle work in acute hypoxia influences locomotor muscle fatigue and exercise performance of healthy humans. Am. J. Physiol. Regul. Integr. Comp. Physiol. 293, 2036–2045 10.1152/ajpregu.00442.2007 - DOI - PubMed
    1. Amann M., Proctor L. T., Sebranek J. J., Pegelow D. F., Dempsey J. A. (2009). Opioid-mediated muscle afferents inhibit central motor drive and limit peripheral muscle fatigue development in humans. J. Physiol. 587, 271–283 10.1113/jphysiol.2008.163303 - DOI - PMC - PubMed
    1. Amann M., Romer L. M., Pegelow D. F., Jacques A. J., Hess C. J., Dempsey J. A. (2006). Effects of arterial oxygen content on peripheral locomotor muscle fatigue. J. Appl. Physiol. 101, 119–127 10.1152/japplphysiol.01596.2005 - DOI - PubMed
    1. Amann M., Secher N. H. (2010). Point: afferent feedback from fatigued locomotor muscles is an important determinant of endurance exercise performance. J. Appl. Physiol. 108, 452–454 10.1152/japplphysiol.00976.2009 - DOI - PMC - PubMed