Review
. 2014 Apr 1:5:199.
doi: 10.3389/fpsyg.2014.00199. eCollection 2014.

Scene analysis in the natural environment

Affiliations
Review

Scene analysis in the natural environment

Michael S Lewicki et al. Front Psychol. .

Erratum in

  • Front Psychol. 2014;5:1119

Abstract

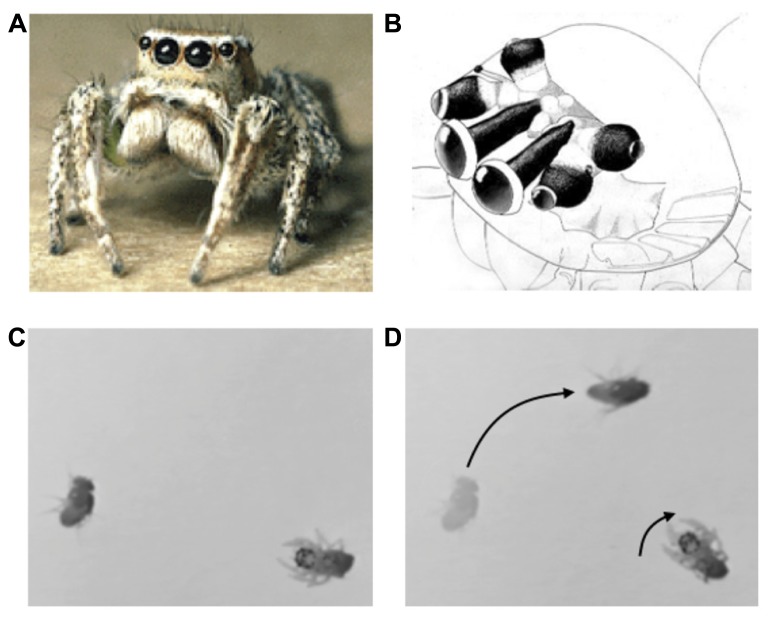
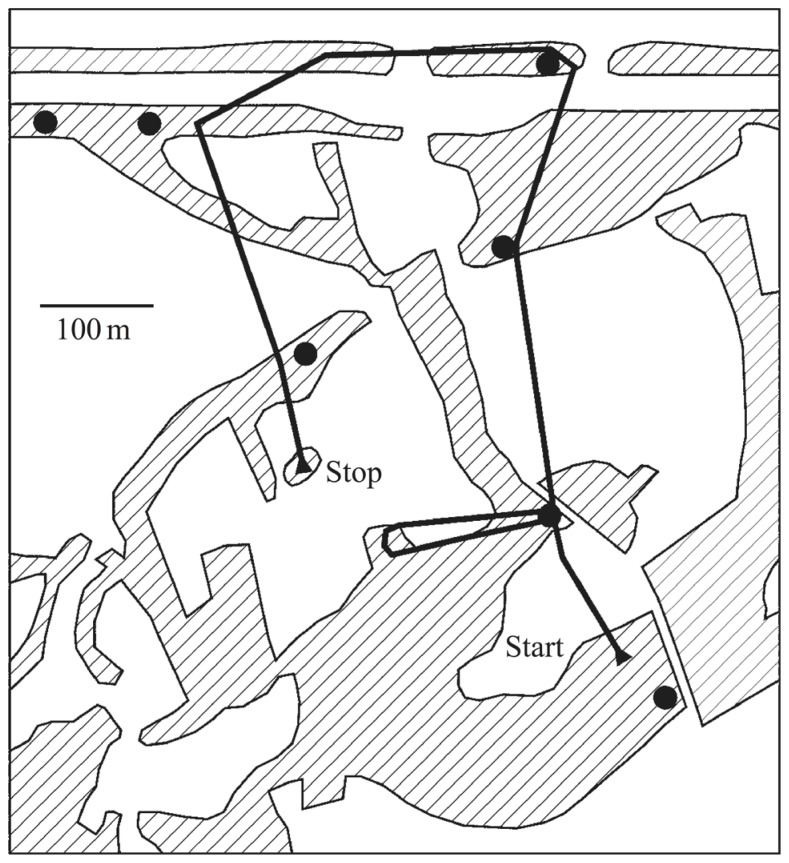
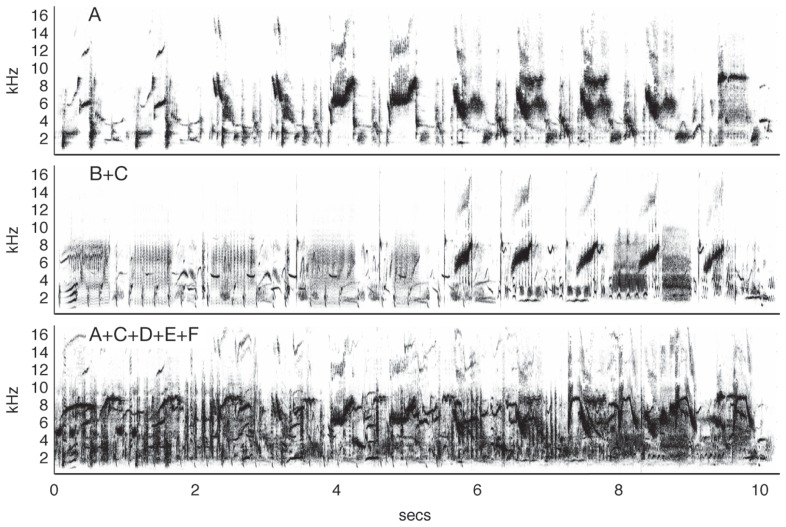
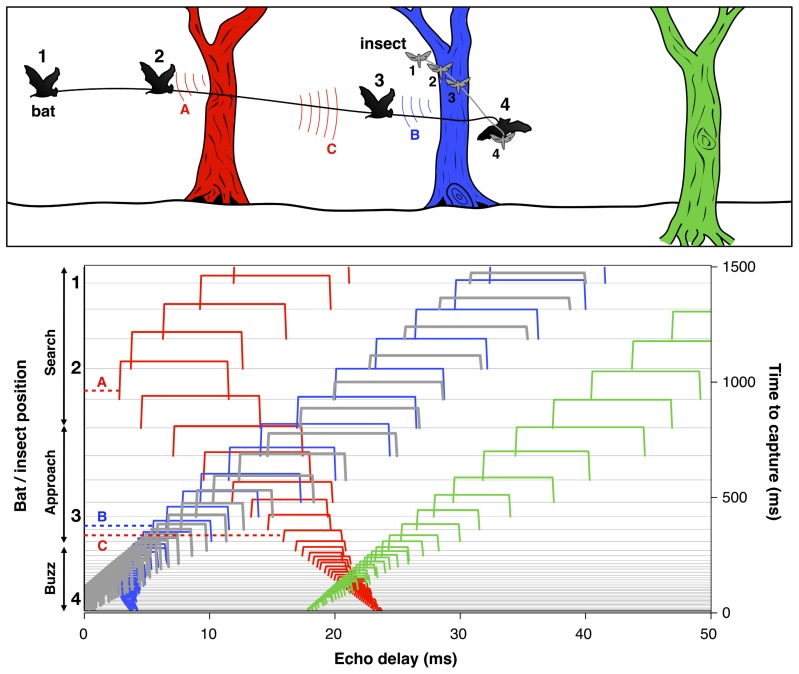
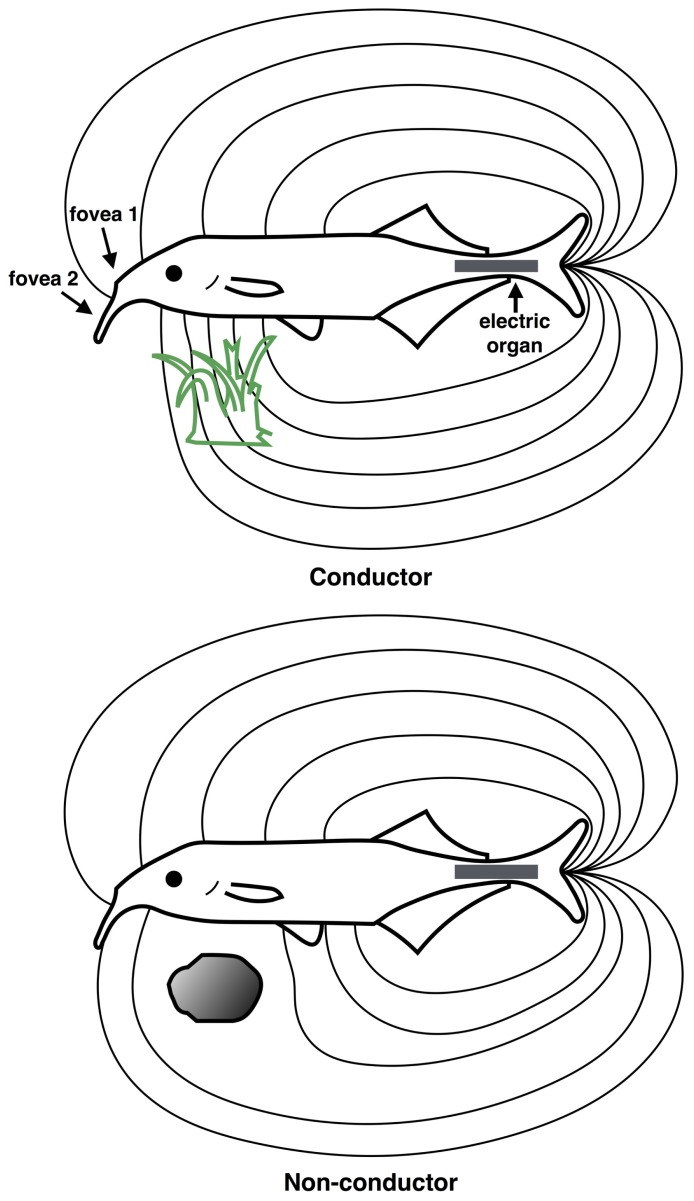
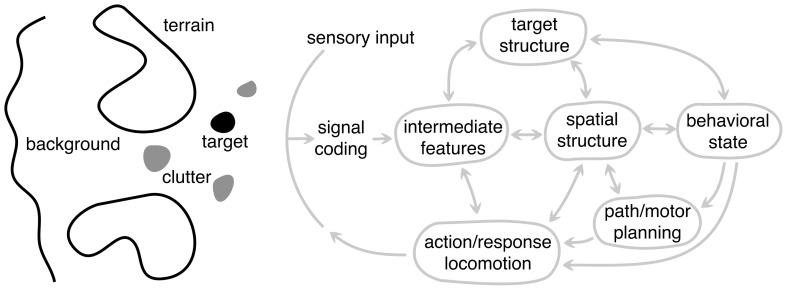
The problem of scene analysis has been studied in a number of different fields over the past decades. These studies have led to important insights into problems of scene analysis, but not all of these insights are widely appreciated, and there remain critical shortcomings in current approaches that hinder further progress. Here we take the view that scene analysis is a universal problem solved by all animals, and that we can gain new insight by studying the problems that animals face in complex natural environments. In particular, the jumping spider, songbird, echolocating bat, and electric fish, all exhibit behaviors that require robust solutions to scene analysis problems encountered in the natural environment. By examining the behaviors of these seemingly disparate animals, we emerge with a framework for studying scene analysis comprising four essential properties: (1) the ability to solve ill-posed problems, (2) the ability to integrate and store information across time and modality, (3) efficient recovery and representation of 3D scene structure, and (4) the use of optimal motor actions for acquiring information to progress toward behavioral goals.

Keywords: active perception; auditory streaming; echolocation; electroreception; neuroethology; scene analysis; top-down processes; vision.


Figures

FIGURE 1
FIGURE 1
(A) Jumping spider (Habronattus), (B) jumping spider visual system, showing antero-median, antero-lateral, and posterior-lateral eyes (A,B from Tree of Life, Copyright 1994 Wayne Maddison, used with permission). (C,D) Orienting behavior of a 1-day-old jumping spider stalking a fruit fly. Adapted from video taken by Bruno Olshausen and Wyeth Bair.
FIGURE 2
FIGURE 2
Territorial prospecting. Songbirds use song as acoustic territorial markers to serve as a warning to potential invaders and rely on sound for locating other birds in complex acoustic scenes and natural environments. The black dots indicate the positions of established singing territorial males, most of which would be audible from any one position, in addition to numerous other sounds. The black line shows the prospecting path of a translocated and radio-tagged male nightingale. Hatched areas indicate reed, bushes, or woods separated by fields and meadows. Figure from Naguib et al. (2011) which is based on data from Amrhein et al. (2004).
FIGURE 3
FIGURE 3
Auditory source separation by starlings. The top panel shows a spectrogram from a 10-s segment of typical starling song (Sturnus vulgaris). In an experiment by Wisniewski and Hulse (1997), starlings were trained to discriminate one of 10 song segments produced by Starling A from 10 song segments produced by Starling B. The birds maintained discrimination when the target song was mixed with a novel distractor song from Starling C (middle) and in the presence of four novel conspecific songs (bottom), a feat which human listeners could not do, even after training. Figure after Wisniewski and Hulse (1997) using songs from the Macaulay Library of the Cornell Lab of Ornithology.
FIGURE 4
FIGURE 4
Bat scene analysis. Schematic illustrating how echoes from different objects in the path of the bat’s sonar beam form acoustic streams with changing delays over time. Upper panel: The cartoon shows a bat pursuing an insect in the vicinity of three trees at different distances. The numbers indicate the positions of the bat and insect at corresponding points in time. Color-coded arcs illustrate an echo from the red tree at position 1 (A) and echoes from the blue and red trees at position 3 (B and C). Lower panel: Echoes from the insect (thick gray lines) and each of the trees (red, blue, and green) arrive at changing delays (x-axis) over time (right y-axis) as the bat flies in pursuit of its prey. Each sonar vocalization (not shown) results in a cascade of echoes from objects in the path of the sound beam, which arrive at different delays relative to vocalization onset. Time to capture proceeds from top to bottom. At time 0, the bat captures the insect. The numbers 1–4 to the left of the y-axis indicate the times of the corresponding bat and insect positions in the cartoon. The thin horizontal gray lines display the echo returns from successive vocalizations which change in duration as the bat moves from search to approach to terminal buzz phases (left y-axis). Echoes are displayed as color-coded open rectangles to illustrate the relative arrival times from the insect and each of the trees. The letters A, B, and C link selected echoes to the arcs in the cartoon above. The duration of echoes, indicated by the width of rectangles, changes proportionately with the duration of sonar calls and appear as narrow ridges when call duration is very short during the approach and buzz phases. Note that the delay of echoes from the red tree and blue tree initially decrease over time, and later increase after the bat flies past them. Adapted from Moss and Surlykke (2010).
FIGURE 5
FIGURE 5
Scene analysis in electroreception. The “electric image” of the external environment is determined by the conductive properties of surrounding objects. The electric field emanates from the electric organ in the tail region (gray rectangle) and is sensed by the electroreceptive skin areas, using two electric “foveas” to actively search and inspect objects. Shown are the field distortions created by two different types of objects: a plant that conducts better than water, above (green) and a non-conducting stone, below (gray). (Redrawn from Heiligenberg, 1977).
FIGURE 6
FIGURE 6
A schematic framework for scene analysis. The arc labeled sensory input represents all the sensory information available to the system, possibly from different modalities. To the left of this arc is an abstract representation of the different components of the external scene: target, clutter, terrain, and background, each of which are processed in different ways depending on the particular scene analysis task. These are depicted as being spatially distinct, but they need not be. To the right of the sensory input arc is the general set of processing components (or stages) underlying biological scene analysis. Each node represents a different level of abstraction and is hypothesized to play a distinct role in the overall system but need not correspond to distinct brain areas. Not all animals use every component because animals have a range of perceptual capabilities and specializations. Arrows represent the flow of information between components, with a double arrow indicating that information can flow in both directions. The arrow going to the sensory input arc represents the “action” of the system and the output of the largest dynamic loop. The animal’s motor actions make it progress toward the behavioral goals, but also change the sensory input in order to gain more information about the scene.

References

    1. Amrhein V., Kunc H. P., Naguib M. (2004). Non-territorial nightingales prospect territories during the dawn chorus. Proc. R. Soc. Lond. B Biol. Sci. 271(Suppl. 4) S167–S169 10.1098/rsbl.2003.0133 - DOI - PMC - PubMed
    1. Appeltants D., Gentner T., Hulse S., Balthazart J., Ball G. (2005). The effect of auditory distractors on song discrimination in male canaries (Serinus canaria). Behav. Process. 69 331–341 10.1016/j.beproc.2005.01.010 - DOI - PubMed
    1. Aubin T., Jouventin P. (1998). Cocktail-party effect in king penguin colonies. Proc. R. Soc. Lond. B Biol. Sci. 265 1665–1673 10.1098/rspb.1998.0486 - DOI
    1. Bacelo J., Engelmann J., Hollmann M., von der Emde G., Grant K. (2008). Functional foveae in an electrosensory system. J. Comp. Neurol. 511 342–359 10.1002/cne.21843 - DOI - PubMed
    1. Ball G., Hulse S. (1998). Birdsong. Am. Psychol. 53 37–58 10.1037/0003-066X.53.1.37 - DOI - PubMed

LinkOut - more resources