

Airway obstruction, dynamic hyperinflation, and breathing pattern during incremental exercise in COPD patients
- PMID: 24744891
- PMCID: PMC3966235
- DOI: 10.1002/phy2.222
Airway obstruction, dynamic hyperinflation, and breathing pattern during incremental exercise in COPD patients
Abstract
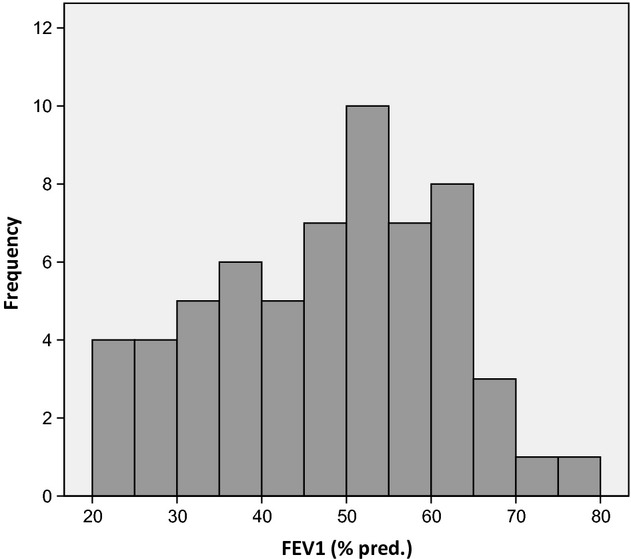
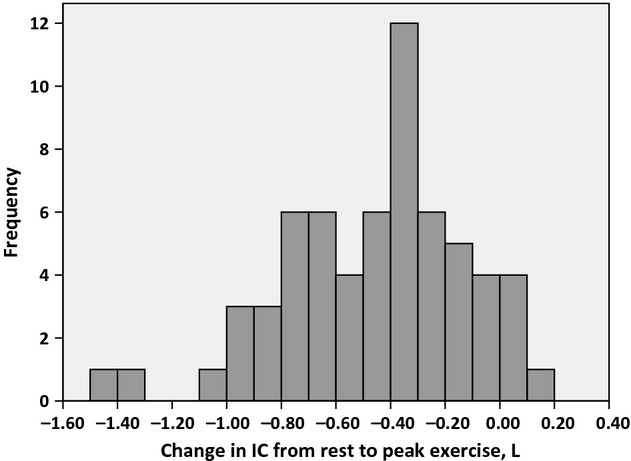
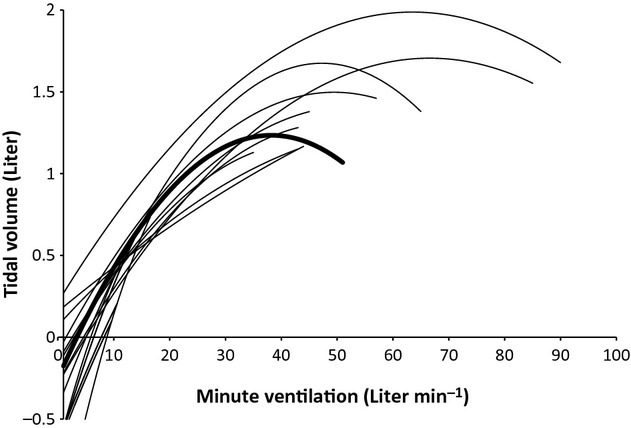
Ventilatory capacity is reduced in chronic obstructive pulmonary disease (COPD) patients. Tidal volume (V T) is lower and breathing frequency higher at a given ventilation (V E) compared to healthy subjects. We examined whether airflow limitation and dynamic hyperinflation in COPD patients were related to breathing pattern. An incremental treadmill exercise test was performed in 63 COPD patients (35 men), aged 65 years (48-79 years) with a mean forced expiratory volume in 1 sec (FEV1) of 48% of predicted (SD = 15%). Data were averaged over 20-sec intervals. The relationship between V E and V T was described by the quadratic equation V T = a + bV E + cV E (2) for each subject. The relationships between the curve parameters b and c, and spirometric variables and dynamic hyperinflation measured as the difference in inspiratory capacity from start to end of exercise, were analyzed by multivariate linear regression. The relationship between V E and V T could be described by a quadratic model in 59 patients with median R (2) of 0.90 (0.40-0.98). The linear coefficient (b) was negatively (P = 0.001) and the quadratic coefficient (c) positively (P < 0.001) related to FEV1. Forced vital capacity, gender, height, weight, age, inspiratory reserve volume, and dynamic hyperinflation were not associated with the curve parameters after adjusting for FEV1. We concluded that a quadratic model could satisfactorily describe the relationship between V E and V T in most COPD patients. The curve parameters were related to FEV1. With a lower FEV1, maximal V T was lower and achieved at a lower V E. Dynamic hyperinflation was not related to breathing pattern when adjusting for FEV1.
Keywords: Chronic obstructive pulmonary disease; exercise; inspiratory capacity; spirometry.
Figures
Similar articles
-
Peak oxygen uptake and breathing pattern in COPD patients--a four-year longitudinal study.BMC Pulm Med. 2015 Aug 19;15:93. doi: 10.1186/s12890-015-0095-y. BMC Pulm Med. 2015. PMID: 26286397 Free PMC article.
-
Intercept of minute ventilation versus carbon dioxide output relationship as an index of ventilatory inefficiency in chronic obstructive pulmonary disease.J Thorac Dis. 2021 Mar;13(3):1553-1563. doi: 10.21037/jtd-20-2725. J Thorac Dis. 2021. PMID: 33841947 Free PMC article.
-
Absence of dynamic hyperinflation during exhaustive exercise in severe COPD reflects submaximal IC maneuvers rather than a nonhyperinflator phenotype.J Appl Physiol (1985). 2020 Mar 1;128(3):586-595. doi: 10.1152/japplphysiol.00695.2018. Epub 2020 Jan 16. J Appl Physiol (1985). 2020. PMID: 31944886
-
[Physiopathology of acute respiratory failure in COPD and asthma].Minerva Anestesiol. 2001 Apr;67(4):198-205. Minerva Anestesiol. 2001. PMID: 11376510 Review. Italian.
-
Hyperinflation and its management in COPD.Int J Chron Obstruct Pulmon Dis. 2006;1(4):381-400. doi: 10.2147/copd.2006.1.4.381. Int J Chron Obstruct Pulmon Dis. 2006. PMID: 18044095 Free PMC article. Review.
Cited by
-
Ventilatory Efficiency in Children and Adolescents Born Extremely Preterm.Front Physiol. 2017 Jul 13;8:499. doi: 10.3389/fphys.2017.00499. eCollection 2017. Front Physiol. 2017. PMID: 28751866 Free PMC article.
-
Peak oxygen uptake and breathing pattern in COPD patients--a four-year longitudinal study.BMC Pulm Med. 2015 Aug 19;15:93. doi: 10.1186/s12890-015-0095-y. BMC Pulm Med. 2015. PMID: 26286397 Free PMC article.
-
Submissive hypercapnia: Why COPD patients are more prone to CO2 retention than heart failure patients.Respir Physiol Neurobiol. 2015 Sep 15;216:86-93. doi: 10.1016/j.resp.2015.03.001. Epub 2015 Apr 17. Respir Physiol Neurobiol. 2015. PMID: 25891787 Free PMC article. Review.
References
-
- Borg G. 1998inBorg's perceived exertion and pain scales Champaign, IL: Human Kinetics
-
- Bruce R. A. 1971. Exercise testing of patients with coronary heart disease. Principles and normal standards for evaluation. Ann. Clin. Res.; 3:323-332 - PubMed
-
- Bruce R. A., Kusumi F., Hosmer D. 1973. Maximal oxygen intake and nomographic assessment of functional aerobic impairment in cardiovascular disease. Am. Heart J.; 85:546-562 - PubMed
-
- Clark T. J., Freedman S., Campbell E. J., Winn R. R. 1969. The ventilatory capacity of patients with chronic airways obstruction. Clin. Sci.; 36:307-316 - PubMed
-
- Cotes J. E. 1972. Response to progressive exercise: a three‐index test. Br. J. Dis. Chest; 66:169-184 - PubMed
LinkOut - more resources
Full Text Sources
Other Literature Sources
