Comparative Study
. 2014 May 7;82(3):670-81.
doi: 10.1016/j.neuron.2014.03.013. Epub 2014 Apr 17.

Slow and fast γ rhythms coordinate different spatial coding modes in hippocampal place cells

Affiliations
Comparative Study

Slow and fast γ rhythms coordinate different spatial coding modes in hippocampal place cells

Kevin Wood Bieri et al. Neuron. .

Abstract

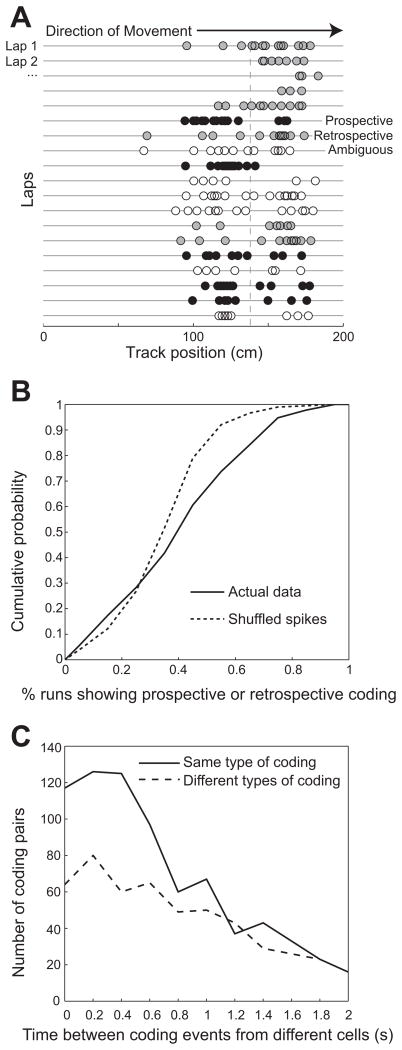
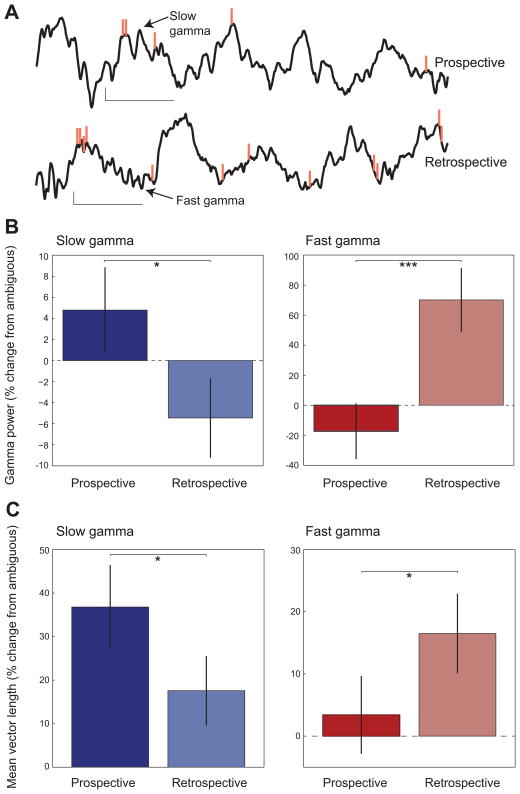
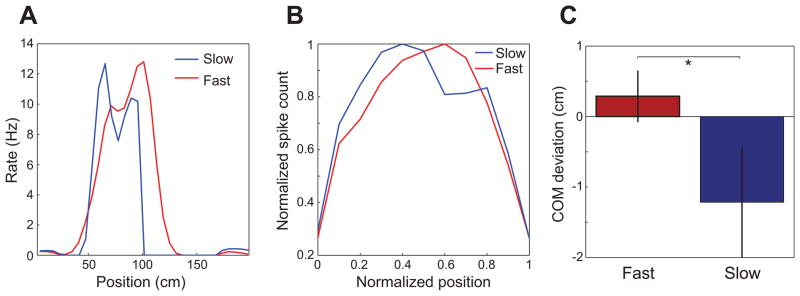
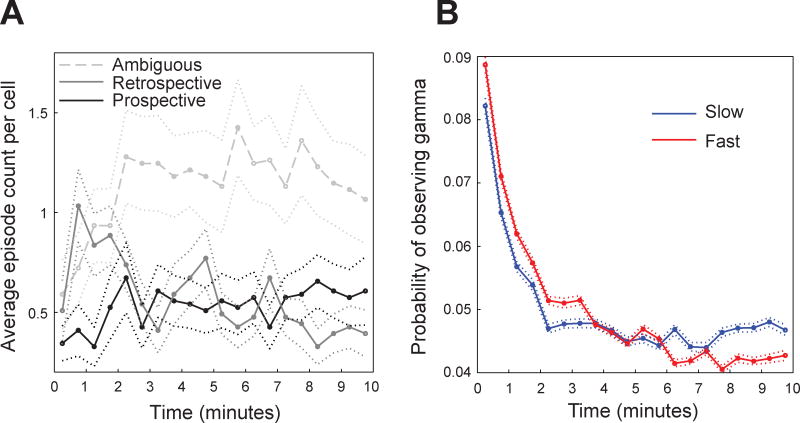
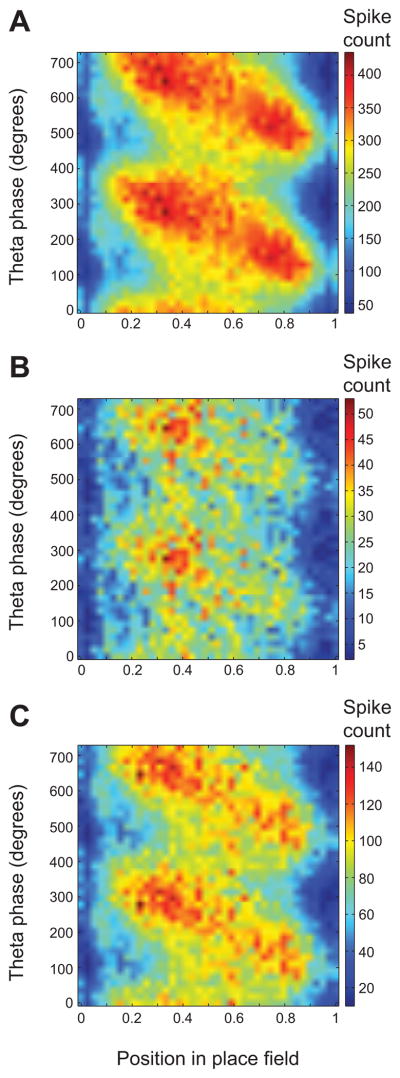
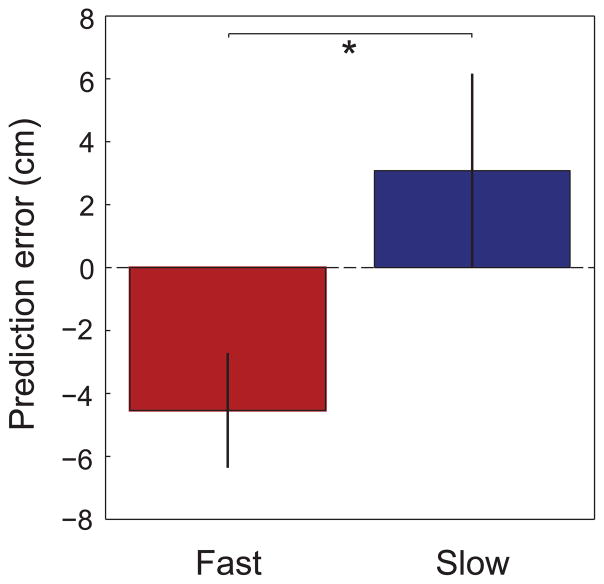
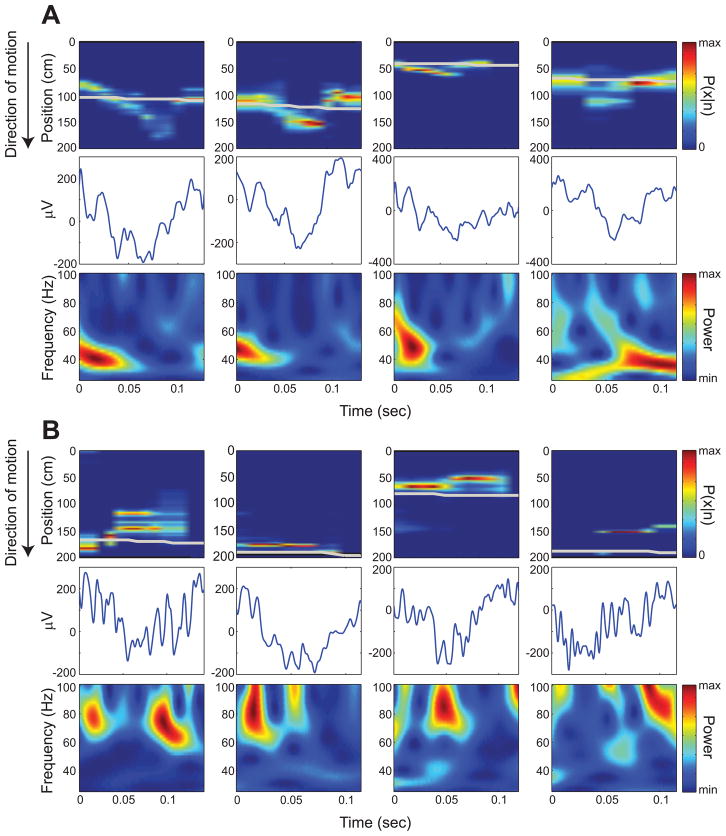
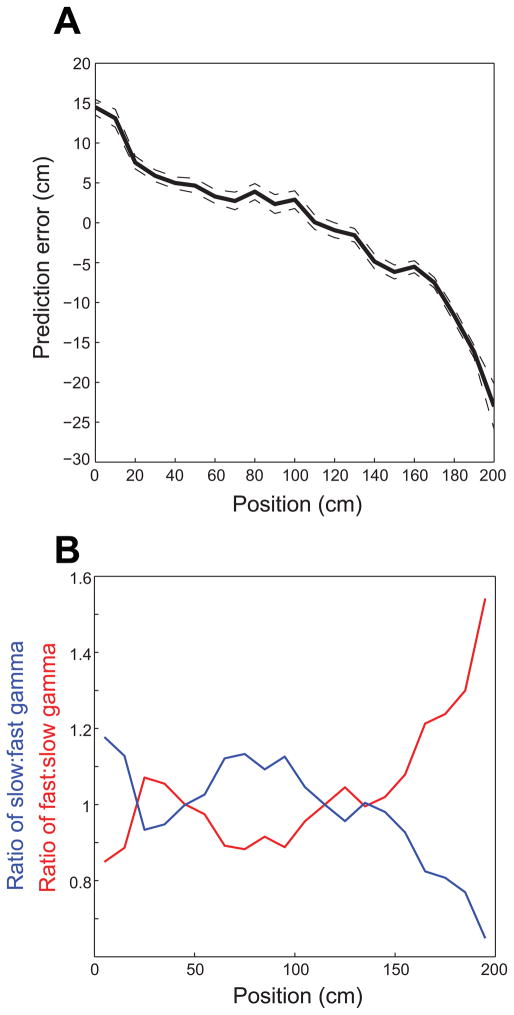
Previous work has hinted that prospective and retrospective coding modes exist in hippocampus. Prospective coding is believed to reflect memory retrieval processes, whereas retrospective coding is thought to be important for memory encoding. Here, we show in rats that separate prospective and retrospective modes exist in hippocampal subfield CA1 and that slow and fast gamma rhythms differentially coordinate place cells during the two modes. Slow gamma power and phase locking of spikes increased during prospective coding; fast gamma power and phase locking increased during retrospective coding. Additionally, slow gamma spikes occurred earlier in place fields than fast gamma spikes, and cell ensembles retrieved upcoming positions during slow gamma and encoded past positions during fast gamma. These results imply that alternating slow and fast gamma states allow the hippocampus to switch between prospective and retrospective modes, possibly to prevent interference between memory retrieval and encoding.


Figures

Figure 1
Figure 1. Prospective and retrospective coding modes in CA1 place cells
(A) Individual spike positions for an example CA1 place cell recorded in a rat running on a linear track. Successive laps in the rightward direction are shown for an ~10 minute session. The mean field position across all laps is indicated with a vertical dashed line. Passes through a place field were classified as ‘prospective’ (black circles) if ≥2/3 of spikes were in the 1st half of the field and ‘retrospective’ (gray circles) if ≥2/3 of spikes were in the 2nd half of the field. Passes that did not fall under either of these definitions were classified as ambiguous (white circles). See also Figure S1. (B) Prospective and retrospective coding occur more often than expected by chance. The percentage of runs showing some type of coding (i.e., either prospective or retrospective, not ambiguous) is shown. A greater proportion of runs exhibit some type of coding mode, either prospective or retrospective, in the actual data compared to shuffled data, in which a larger number of ambiguous runs occur. (C) Prospective and retrospective coding events were detected for all recorded CA1 place cells. Successive coding events from place cell pairs were likely to be of the same type if they occurred closely in time (i.e., < 0.8 s).
Figure 2
Figure 2. Slow and fast gamma during prospective and retrospective coding in CA1
(A) Example LFP recordings from CA1 s. pyramidale are shown with corresponding spikes from an example place cell (orange vertical lines, same place cell as shown in Figure 1A). Slow gamma during a prospective coding event is shown above, and fast gamma during a retrospective coding event is shown below (calibration: 100 ms, 0.2 mV). The top recording corresponds to one of the prospective coding events shown in Figure 1A (5th row from the bottom), and the bottom recording corresponds to a retrospective coding event in Figure 1A (5th row from the top). (B) Slow (blue) and fast (red) gamma power in CA1 during prospective and retrospective coding events. Power is plotted as the percent change (mean ± SEM) relative to power during ambiguous runs (see Figure S2A). Slow gamma power was higher during prospective coding than during retrospective coding. Fast gamma power was greater for retrospective coding compared to prospective coding. (C) Phase-locking of interneuron spike times (mean ± SEM) to slow and fast gamma during prospective and retrospective coding events. Slow gamma phase-locking was greater during prospective coding than during retrospective coding. Fast gamma phase-locking was greater during retrospective coding than during prospective coding. See also Figure S2B.
Figure 3
Figure 3. Place fields constructed from spikes emitted during slow and fast gamma periods in CA1
(A) Rate maps constructed for spikes occurring during slow and fast gamma for an example CA1 place cell from a rat running in the rightward direction (B) Spike counts across position combined for all spikes from all cells, subsampled for non-overlapping slow and fast gamma periods. Spike counts were normalized according to each cell’s maximum, and the x-axis shows normalized position within each cell’s place field (ranging from 0 to 1). Leftward runs were reversed so that place fields from runs in both directions could be combined, such that animals were running from position = 0 to position = 1 in all cases. See also Figure S3. (C) Center of mass (COM) deviations (mean ± SEM) for place fields subsampled for non-overlapping slow and fast gamma periods. Zero represents the place field COM for all spikes. Place field COMs were shifted significantly forward during fast gamma compared to place field COMs during slow gamma.
Figure 4
Figure 4. Time course of slow and fast gamma episodes and prospective and retrospective coding events in CA1
(A) The mean (± SEM) distribution of ambiguous, retrospective, and prospective coding events during the first 10-minute session of each day is shown. (B) The mean (± SEM) probability of detecting slow and fast gamma episodes across the first 10-minute recording session for each day is shown.
Figure 5
Figure 5. Theta phase precession during slow and fast gamma periods in CA1
For each panel, normalized position within the place field is plotted on the x-axis, and the theta phase at which each spike occurred is plotted on the y-axis. (A) Theta phase precession is depicted for all spikes. (B) The relationship between theta phase and position is shown during periods of slow gamma. Note how spikes primarily occur in the first half of the place field. (C) The relationship between theta phase and position is shown during periods of fast gamma. Spikes occur across the full range of positions and theta phases. Note that spike counts in (B) and (C) do not sum to spike counts in (A) because (A) also includes periods when neither fast nor slow gamma were detected. See also Figure S4.
Figure 6
Figure 6. Reconstruction errors (difference between the position estimated by Bayesian decoding and the animal’s actual position) during periods of slow and fast gamma in CA1
Prediction errors (mean ± SEM) were negative on average during fast gamma and positive on average during slow gamma. Negative prediction errors indicate that the decoded position is behind the actual position, whereas positive prediction errors indicate that the decoded position is ahead of the actual position. See Figure S7 for example place cell recording sites used in Bayesian decoding analyses.
Figure 7
Figure 7. Examples of reconstructed positions from theta cycles showing slow or fast gamma
Top panels show Bayesian decoded spatial probability distributions for example theta cycles (raw traces shown in middle panels); the gray line indicates the rat’s actual position. Rats were running from 0 to 200 cm. The bottom panels depict color-coded power across time (x-axis) for the range of gamma frequencies (y-axis). (A) Examples showing positive prediction errors associated with slow gamma. (B) Examples showing negative prediction errors associated with fast gamma. See also Figure S5.
Figure 8
Figure 8. Negative and positive prediction errors from Bayesian decoding are associated with particular locations, and slow and fast gamma predominate at different locations, on the linear track
Leftward runs were reversed (as described in Figure 3). (A) Mean prediction errors ± 95% confidence intervals are plotted against position on the track. Note that positive prediction errors were associated with positions where rats were leaving the end of the track, and negative prediction errors were associated with positions where rats were approaching the end of the track. (B) The ratio of the probability of slow gamma occurrence to the probability of fast gamma occurrence (blue) and the ratio of the probability of fast gamma occurrence to the probability of slow gamma occurrence (red) are plotted against position on the track. Note that these results are a transformed version of what is shown in the left panel of Figure S4B. See also Figure S6.

Comment in

  • On track with two gammas.
    Dvorak D, Fenton AA. Dvorak D, et al. Neuron. 2014 May 7;82(3):506-8. doi: 10.1016/j.neuron.2014.04.027. Neuron. 2014. PMID: 24811375

References

    1. Ahmed OJ, Mehta MR. Running speed alters the frequency of hippocampal gamma oscillations. J Neurosci. 2012;32:7373–7383. - PMC - PubMed
    1. Barbieri R, Wilson MA, Frank LM, Brown EN. An analysis of hippocampal spatio-temporal representations using a Bayesian Algorithm for Neural Spike Train Decoding. IEEE Trans Neural Syst Rehabil Eng. 2005;13:131–136. - PubMed
    1. Battaglia FP, Sutherland GR, McNaughton BL. Local sensory cues and place cell directionality: additional evidence of prospective coding in the hippocampus. J Neurosci. 2004;24:4541–4550. - PMC - PubMed
    1. Belluscio MA, Mizuseki K, Schmidt R, Kempter R, Buzsaki G. Cross-frequency phase-phase coupling between theta and gamma oscillations in the hippocampus. J Neurosci. 2012;32:423–435. - PMC - PubMed
    1. Bragin A, Jando G, Nadasdy Z, Hetke J, Wise K, Buzsaki G. Gamma (40–100 Hz) oscillation in the hippocampus of the behaving rat. J Neurosci. 1995;15:47–60. - PMC - PubMed

Publication types

LinkOut - more resources