. 2014 Apr 28;29(2):217-32.
doi: 10.1016/j.devcel.2014.03.012. Epub 2014 Apr 17.

Cyclin B1/Cdk1 coordinates mitochondrial respiration for cell-cycle G2/M progression

Affiliations

Cyclin B1/Cdk1 coordinates mitochondrial respiration for cell-cycle G2/M progression

Zhaoqing Wang et al. Dev Cell. .

Abstract

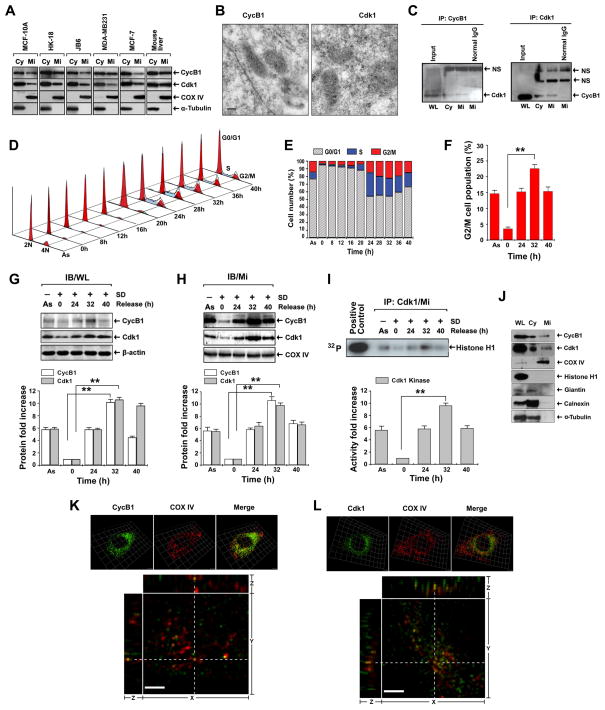
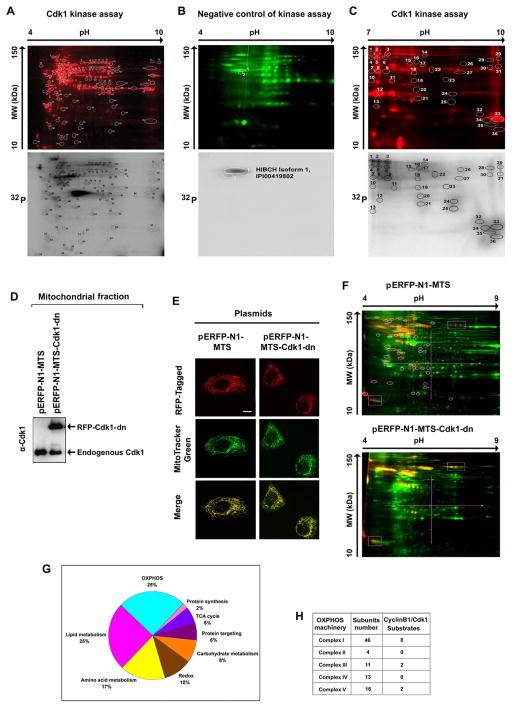
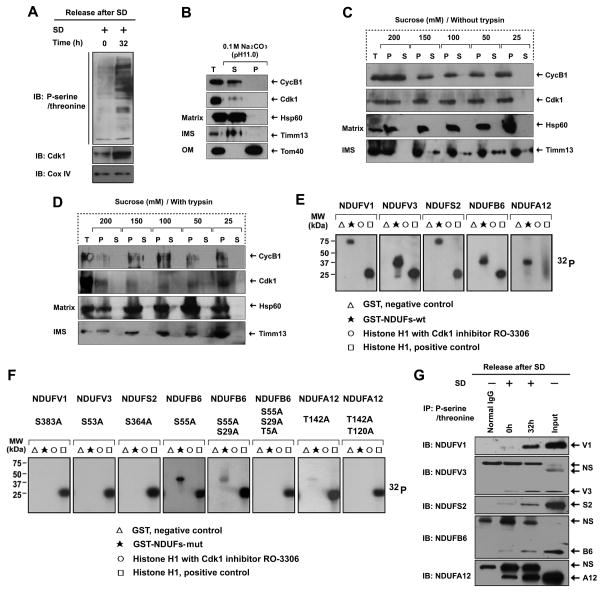
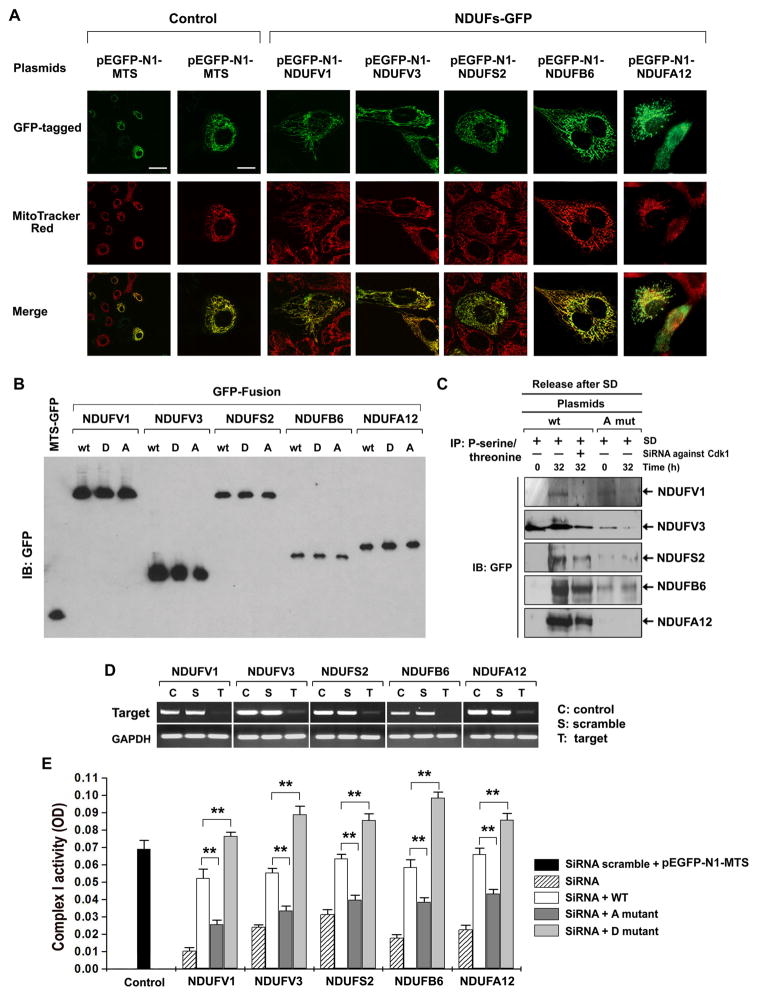
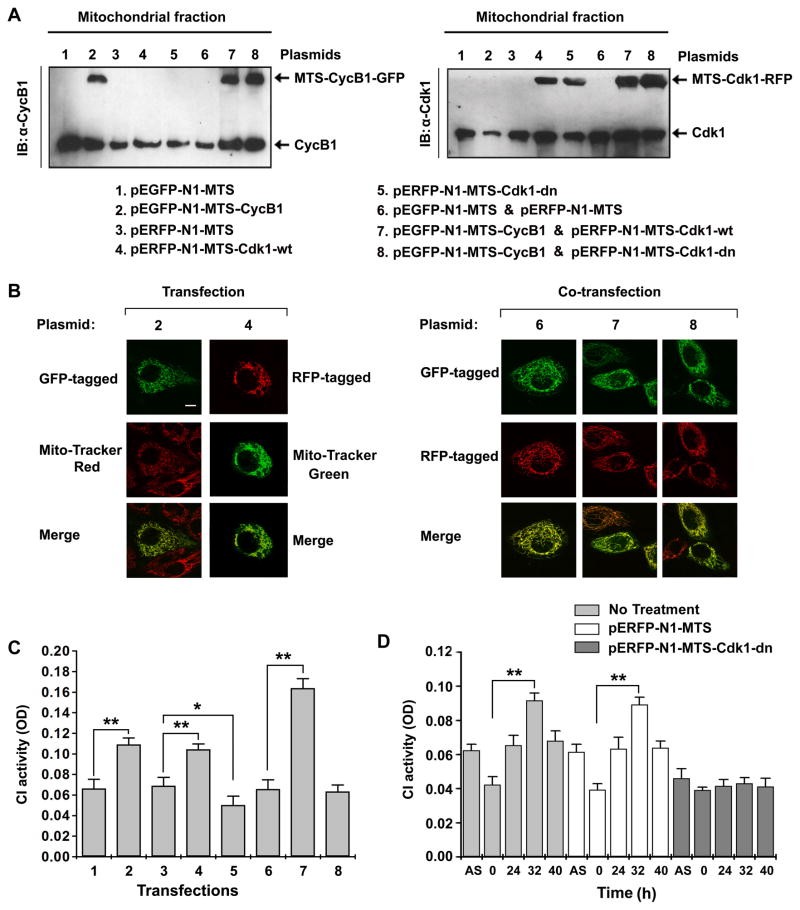
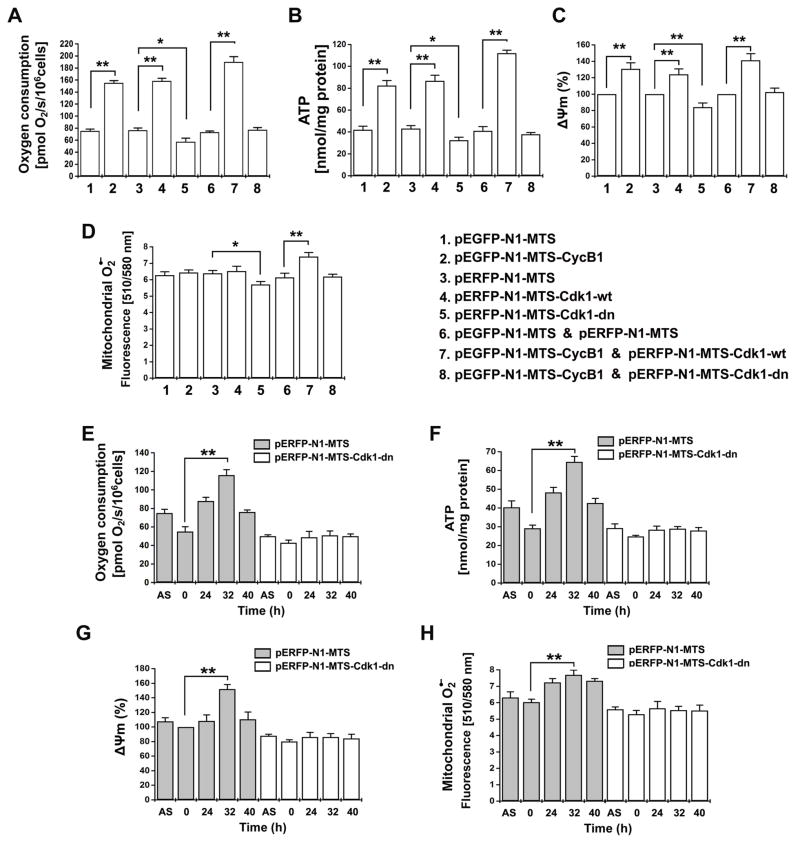
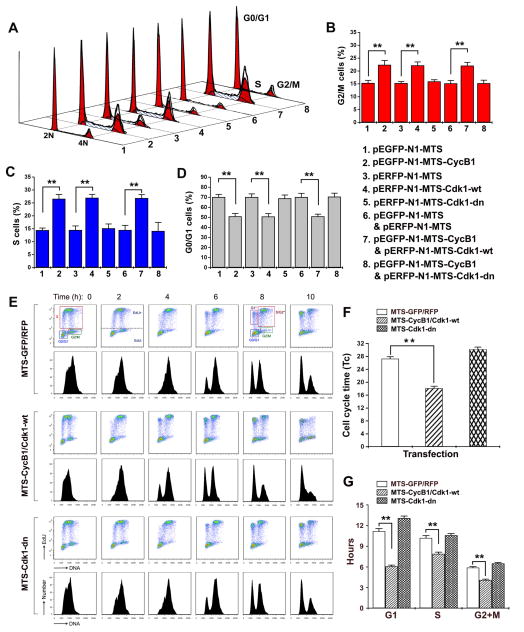
A substantial amount of mitochondrial energy is required for cell-cycle progression. The mechanisms underlying the coordination of the mitochondrial respiration with cell-cycle progression, especially the G2/M transition, remain to be elucidated. Here, we show that a fraction of cyclin B1/Cdk1 proteins localizes to the matrix of mitochondria and phosphorylates a cluster of mitochondrial proteins, including the complex I (CI) subunits in the respiratory chain. Cyclin B1/Cdk1-mediated CI phosphorylation enhances CI activity, whereas deficiency of such phosphorylation in each of the relevant CI subunits results in impairment of CI function. Mitochondria-targeted cyclin B1/Cdk1 increases mitochondrial respiration with enhanced oxygen consumption and ATP generation, which provides cells with efficient bioenergy for G2/M transition and shortens overall cell-cycle time. Thus, cyclin B1/Cdk1-mediated phosphorylation of mitochondrial substrates allows cells to sense and respond to increased energy demand for G2/M transition and, subsequently, to upregulate mitochondrial respiration for successful cell-cycle progression.


Figures

Figure 1
Figure 1. Mitochondrial CyclinB1/Cdk1 Is Actively Correlated with G2/M Transition
(A) Immunoblotting (IB) analysis of CyclinB1 (CycB1) and Cdk1 of cytosolic (Cy) and mitochondrial (Mi) fractions isolated from an array of human and mouse cell lines and mouse liver tissue (α-Tubulin, cytosolic marker; COX IV, mitochondrial marker). MCF-10A cells were used in all further experiments. (B) Mi CyclinB1 and Cdk1 detected by immunoelectron microscopy with gold-labeled antibodies (dot arrows, 10 nm gold-particles for CyclinB1 and Cdk1; scale bar, 250 nm). (C) Immunoprecipitation (IP) of CyclinB1 followed by IB of Cdk1 or reverse using whole cell lysates (WL), cytosolic (Cy)and mitochondrial (Mi) fractions (NS, non-specific binding). (D, E, F) Cell cycle distribution after release from G0/G1 synchronization (As, asynchronous cells) with G2/M population peakedat 32 h (F) (mean ± SD; n = 3; **p < 0.01). (G, H) IB of CyclinB1 and Cdk1 in whole cell lysates (WL, G) and Mi fraction (H) at indicated time intervals after release from G0/G1 synchronization. (I) Kinase assay of Mi Cdk1 isolated by IP after release from G0/G1 synchronization (Histone H1, control substrate; commercial Cdk1, positive control). The lower panels show estimated fold changes of protein expression (G, H) and Cdk1 kinase activity in autoradiography (I) using Image software (mean ± SD; n = 3; **p < 0.01). (J) CyclinB1 and Cdk1 in WL, Cy and Mi fractions isolated from G2/M-peaked cells were detected by IB together with different markers (Histone H1, nuclear protein; Cox IV, Mi marker, Giantin, Golgi apparatus membrane marker; Calnexin, endoplasmic reticulum membrane marker, α-Tubulin, Cy marker). (K, L) Mitochondrial localization of CyclinB1 and Cdk1 detected by immunofluorescence using 3D structured illumination super-resolution microscopy. Upper panels, fluorescence images of immunostained mitochondrial CyclinB1 (K) and Cdk1 (L) isolated from G2/M-enriched cells with COX IV as control. Lower panels, the raw fluorescence images were also deconvoluted with a proprietary software package to enhance the resolutions. Yellow dots from merged images represent co-localization of CyclinB1/Cdk1 and COX IV from orthogonal views (xy-, yz- and xz- planes). See also Figures S1–S4, Movies S1 & S2.
Figure 2
Figure 2. Potential Mitochondrial Substrates of Cdk1
(A) Mitochondrial (Mi) proteins (1 mg) isolated from G0/G1 cells were incubated with commercial Cdk1 in the presence of [γ-32P] ATP, of which 50 μg was separated by 2-D gel electrophoresis (pH 4–9) after labeled with Cy5 (upper panel). The phosphorylated spots were detected by autoradiography (lower panel) and the circled spots were extracted and identified by mass spectrometry and the potential Cdk1 -phosphorylated Mi proteins are listed in Table S1. (B) A negative control of (A) with the absence of commercial Cdk1 and presence of the Cdk1 inhibitor RO-3306. (C) Cdk1-Mi target proteins detected with the same Cdk1 kinase assay as (A) with electrophoresis in the range pH 7–10. (D) Immunoblotting analysis of Cdk1 in Mi fractions isolated from cells transfected with mitochondria-targeted dominate negative mutant Cdk1 and empty vectors. (E) Representative images of mitochondria-targeted (MTS) Cdk1-wt-RFP, Cdk1-dn-RFP and empty vector MTS-RFP. (F) Mi proteins extracted from G2/M-peaked cells transfected with mitochondria-targeted empty vector (pERFP-N1-MTS, upper panel) or mutant Cdk1 (pERFP-N1-MTS-Cdk-dn, lower panel) were labeled with Cy5 (green), separated by 2-D gel and phosphorylated proteins were stained with Pro-Q Diamond dye (red). Spots absent in the Mi profile of cells with mitochondria-targeted mutant Cdk1 compared with the vector control transfectants (circled) were extracted and analyzed by mass spectrometry. The potential Cdk1 Mi targets detected by these experiments were listed in Table S3. (G) Summary of potential Cdk1-targeted mitochondrial proteins detected by in vitro (A–C) and in vivo (E–F) Cdk1 kinase assays. (H) Distribution of potential MiCdk1 targets in the subunits of complexes. See also Tables S1–S4.
Figure 3
Figure 3. Mitochondrial CyclinB1/Cdk1 localizes in the Matrix and Phosphorylate CI Subunits at G2/M Transition
(A) Immunoblotting analysis of mitochondrial (Mi) phospho-serine/threonine proteins isolated from G0/G1 (0 h) and G2/M(32 h) cells after release from G0/G1 synchronization. (B) Sub-mitochondrial localization of CyclinB1 and Cdk1 detected by alkaline extraction (Antonyuk et al.). Matrix proteins were separated from integral membrane proteins by extracting mitochondria with sodium carbonate (pH 11), then the total input (T), soluble matrix proteins (S), and membrane vesicle pellets (P) were immunoblotted for CyclinB1, Cdk1, Tom40 (an outer membrane protein), TIMM13 (an inter-space protein), and HSP60 (a matrix protein). (C, D) Sub-mitochondrial localization of CyclinB1 and Cdk1 detected via mitoplasting and protease protection assay (Antonyuk et al.). Mitochondria were incubated in gradient hypotonic sucrose buffer as indicated to digest the outer membrane of mitochondria with or without soybean trypsin. The total (T), pellet (P), and supernatant (S) fractions were subjected to IB analysis with indicated antibodies. (E, F) Five GST-fused human wild type CI subunits (E) and their mutants (F) in the indicated potential Cdk1 phosphorylation sites (note, multiple mutations created in NDUFB6 and NDUFA12) were synthetized and tested as substrates in kinase assay with commercial Cdk1. (G) Mitochondrial proteins from G0/G1 and G2/M cells were extracted by IP using a phospho-serine/threonine antibody followed by IB using antibodies to each of the CI subunits (normal IgG, control for the IP reaction; NS, non -specific band). See also Figure S5 & Table S4.
Figure 4
Figure 4. Cdk1-mediated Phosphorylation of CI Subunits Is Required for CI Activity
(A) Representative images of mitochondria (Mi)-localized CI subunits of transfected cells co-stained with GFP and Mito Tracker Red (Control, empty MTS-GFP vector, scale bar: left = 30 μm, right =10 μm). (B) Expression of wild type or mutant forms of each CI subunit in transfected cells tested by IB of GFP (MTS-GFP, empty vector; A, alanine mutation; D, aspartate mutation. (C) Phosphorylated proteins were extracted by IP with phospho-serine/threonine antibody from wild type and A mutant CI transfected cells at 0 h and 32 h after release from synchronization, followed by IB for GFP. Additional cells transfected with wild type CI and treated with Cdk1 siRNA were included as controls. (D) RT-PCR analysis of siRNA-mediated inhibition on each of CI subunits. (E) CI activity rescued by wild type but not mutant CI subunits. CI activity was measured in cells co-transfected with wild type or mutant CI subunits along with siRNAs against each of the endogenous CI subunits (See also Table S8). SiRNA scramble + MTS-EGFP, a non-target control; A mutant, phosphorylation-defective form; D mutant, constitutive phosphorylation-mimic form; one unit of OD is equal to 29.3 μmoles/min/mg of proteins (mean ± SD, n = 3; **p < 0.01). See also Figure S6, Tables S6, S7 & S8.
Figure 5
Figure 5. Mitochondrial Cdk1 Is Required for G2/M-associated CI Activation
(A) IB of mitochondrial fraction isolated from cells for mitochondria-targeted CyclinB1 with wild type or dominant negative mutant Cdk1 (plasmids are indicated on the bottom. pEGFP-N1-MTS and pERFP-N1-MTS were empty vector controls for MTS-Cylcin B1 and MTS-Cdk1 respectively; see also Table S2 for detailed information on the plasmid constructs). (B) Representative images of mitochondria-localized CyclinB1 (2), Cdk1 (4), or co-localized wild type and mutant Cdk1 with CyclinB1(6, 7, 8). (C) CI activity measured with asynchronous cells at 48 h following transfection of above indicated plasmids (mean ± SD; n = 3; *p < 0.05; **p < 0.01). (D) CI activity measured in control (no treatment) and in cells with empty vector (pERFP-N1-MTS) or Cdk1-dn mutant (pERFP-N1-MTS-Cdk1-dn) at indicated times after release from G0/G1 synchronization (mean ± SD;n = 3, ** p < 0.01).
Figure 6
Figure 6. Mitochondrial Cdk1 Is Required for G2/M-associated Mitochondrial Respiration
(A–D) Mitochondrial oxygen consumption, ATP generation, Δψm, and O2·− levels were measured in cells at 48 h after transfection with the indicated plasmids. (E–H) Mitochondrial oxygen consumption, ATP generation, Δψm, and O2·− levels were measured in cells with empty vector (pERFP-N1-MTS) or Cdk1-dn mutant (pERFP-N1-MTS-Cdk1-dn) at indicated times after release from G0/G1 synchronization (mean ± SD; n = 3; *p <0.05; **p <0.01). See also Figures S7 & S8.
Figure 7
Figure 7. Mitochondrial Cdk1 Enhances G2/M Transition and Overall Cycle Progression
(A–D) Cell population kinetics in cells after 48 h transfection with indicated mitochondria-targeted CyclinB1, Cdk1, CyclinB1/Cdk1 and control vectors; a representative plot (A), and percentage in G2/M(B), S (C) and G0/G1(D)phases (mean ± SD; n = 3; **p <0.01). (E–F). Cell cycle time (Tc, in G) and each phase (G1, S, and G2/M in H) progression analysis were performed based on the flow cytometry analysis of the DNA content. (Mean ± SD; n = 3; *p <0.05; **p <0.01). See also Figure S9 & Table S9. (G) Cell cycle analysis with EdU pulse-chase labeling. Cells were pulsed with EdU for 30 min following 24 h transfection with indicated constructs on the left. The EdU-positive population was followed over time as it progressed through cell cycle phases. Scatter plot histograms of EdU-labeled cells were stained for DNA content (X-axis) and EdU (Y-axis). The lower figures in each panel show the mean fluorescence intensity of the EdU labeled nuclei. The time points were indicated in h after the EdU pulse. For all time points, unique gates displaying the following populations were drawn: G0/G1, S, and G2/M. For 6, 8, and 10-h time points, EdU- labeled G1*, S/G2*, and G2/M* populations are shown.

References

    1. Antonyuk SV, Han C, Eady RR, Hasnain SS. Structures of protein-protein complexes involved in electron transfer. Nature. 2013;496:123–126. - PMC - PubMed
    1. Atherton-Fessler S, Parker LL, Geahlen RL, Piwnica-Worms H. Mechanisms of p34cdc2 regulation. Mol Cell Biol. 1993;13:1675–1685. - PMC - PubMed
    1. Bao Y, Mukai K, Hishiki T, Kubo A, Ohmura M, Sugiura Y, Matsuura T, Nagahata Y, Hayakawa N, Yamamoto T, et al. Energy management by enhanced glycolysis in G1-phase in human colon cancer cells in vitro and in vivo. Mol Cancer Res. 2013;11:973–985. - PubMed
    1. Barnes EA, Kong M, Ollendorff V, Donoghue DJ. Patched1 interacts with cyclin B1 to regulate cell cycle progression. EMBO J. 2001;20:2214–2223. - PMC - PubMed
    1. Baumann K. Cell cycle: Order in the pericentriolar material. Nat Rev Mol Cell Biol. 2012;13:749. - PubMed

Publication types

MeSH terms